You are not logged in.
This means you
CAN ONLY VIEW reports that were published prior to Thursday, March 20, 2025.
You
MUST UPGRADE YOUR MEMBERSHIP if you want to see any current reports.
AFTER MARKET UPDATE - FRIDAY, MAY 14TH, 2021
Previous After Market Report Next After Market Report >>>
|
|
|
|
DOW |
+360.68 |
34,382.13 |
+1.06% |
|
Volume |
851,675,284 |
-17% |
|
Volume |
3,992,578,600 |
-14% |
|
NASDAQ |
+308.01 |
13,433.00 |
+2.35% |
|
Advancers |
2,666 |
81% |
|
Advancers |
3,202 |
81% |
|
S&P 500 |
+61.35 |
4,173.85 |
+1.49% |
|
Decliners |
632 |
19% |
|
Decliners |
770 |
19% |
|
Russell 2000 |
+53.68 |
2,224.63 |
+2.47% |
|
52 Wk Highs |
135 |
|
|
52 Wk Highs |
105 |
|
|
S&P 600 |
+29.22 |
1,354.82 |
+2.20% |
|
52 Wk Lows |
36 |
|
|
52 Wk Lows |
66 |
|
|
 |
Major Indices Rebounded Without Great Volume Conviction
Kenneth J. Gruneisen - Passed the CAN SLIM® Master's Exam
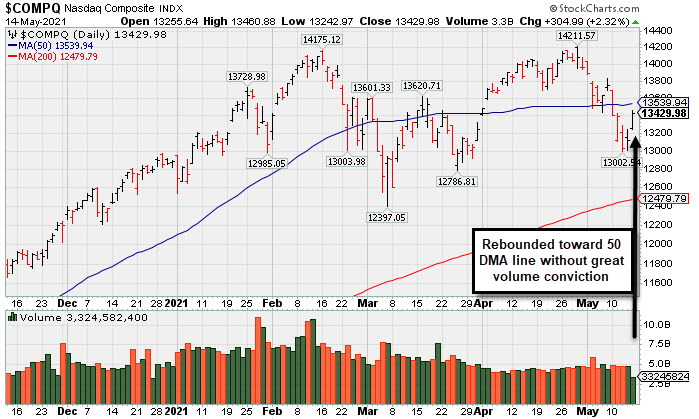
The Dow climbed 360 points, while the S&P 500 rebounded 1.5%, trimming their weekly declines to 1.1% and 1.4%, respectively. The Nasdaq Composite rallied 2.3%, halving its weekly drop to 2.3%. This still marked the tech-heavy benchmark’s fourth straight weekly decline, its longest such losing streak since August 2019. The volume totals reported Friday were lighter than the prior session on the NYSE and on the Nasdaq exchange, indicative of lackluster institutional buying demand behind the market's late-week rebound. Breadth was clearly positive as advancers led decliners by a 4-1 margin on the NYSE and on the Nasdaq exchange. There were 44 high-ranked companies from the Leaders List that hit new 52-week highs and were listed on the BreakOuts Page, versus 15 on the prior session, still down considerably from the total of 171 on Monday's session. New 52-week highs outnumbered new 52-week lows on both the NYSE and the Nasdaq exchange. The major indices (M criteria) are in a confirmed uptrend. Investors are reminded to always make buying and selling decisions on case-by-case basis under the strict criteria and rules of the fact-based investment system.
PICTURED: The Nasdaq Composite Index posted gains without great volume conviction while rebounding toward its 50-day moving average (DMA) line.
U.S. stocks finished broadly higher on Friday, though the major averages still capped their worst week since February as lingering inflation jitters weighed on sentiment. Meanwhile, the CBOE Volatility Index (VIX)--Wall Street’s so-called “fear gauge”--eased back below 20 after spiking to its highest level in over two months at (27.63) on Wednesday.
On the data front Friday, retail sales were unchanged in April, missing estimates calling for a 1% gain. However, the previous figure was upwardly revised to reflect a 10.7% surge. Separately, a preliminary reading on consumer sentiment from the University of Michigan unexpectedly declined to a three-month low in May. Treasuries strengthened, with the yield on the 10-year note down two basis points to 1.63%. In commodities, WTI crude notched a third consecutive weekly advance, up 2.4% on Friday to $65.36/barrel.
All 11 S&P 500 sectors closed in positive territory, with Technology rebounding more than 2%. The Philadelphia Semiconductor Index (SOX) climbed 3% (and out of correction territory) on reports that lawmakers planned to unveil a $52 billion proposal that would elevate domestic chip production over the next five years. In earnings, Walt Disney Co. (DIS -2.58%) fell after missing revenue projections and attracting fewer streaming subscribers than expected in the last quarter. |
 Kenneth J. Gruneisen started out as a licensed stockbroker in August 1987, a couple of months prior to the historic stock market crash that took the Dow Jones Industrial Average down -22.6% in a single day. He has published daily fact-based fundamental and technical analysis on high-ranked stocks online for two decades. Through FACTBASEDINVESTING.COM, Kenneth provides educational articles, news, market commentary, and other information regarding proven investment systems that work in good times and bad.
Comments contained in the body of this report are technical opinions only and are not necessarily those of Gruneisen Growth Corp. The material herein has been obtained from sources believed to be reliable and accurate, however, its accuracy and completeness cannot be guaranteed. Our firm, employees, and customers may effect transactions, including transactions contrary to any recommendation herein, or have positions in the securities mentioned herein or options with respect thereto. Any recommendation contained in this report may not be suitable for all investors and it is not to be deemed an offer or solicitation on our part with respect to the purchase or sale of any securities. |
|
 |
Financial, Retail, Tech, and Commodity-Linked Groups Rose
Kenneth J. Gruneisen - Passed the CAN SLIM® Master's Exam
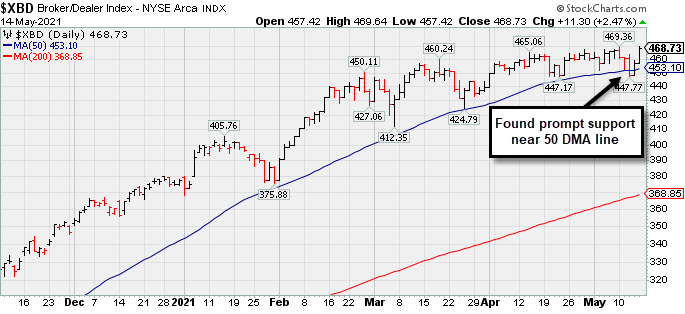
The Broker/Dealer Index ($XBD +2.47%), Bank Index ($BKX +1.58%), and Retail Index ($RLX +1.39%) posed unanimous gains. The Semiconductor Index ($SOX +2.98%) and Networking Index ($NWX +2.15%) both outpaced the Biotech Index ($BTK +1.70%) as the tech sector also rebounded. Commodity-linked groups had a positive bias as the Gold & Silver Index ($XAU +2.89%), Oil Services Index ($OSX +3.92%), and Integrated Oil Index ($XOI +3.60%) each posted a solid gain.
PICTURED: The Broker/Dealer Index ($XBD +2.47%) found prompt support near its 50-day moving average line.
| Oil Services |
$OSX |
61.94 |
+2.34 |
+3.92% |
+39.72% |
| Integrated Oil |
$XOI |
1,099.45 |
+38.20 |
+3.60% |
+38.74% |
| Semiconductor |
$SOX |
2,980.17 |
+86.23 |
+2.98% |
+6.61% |
| Networking |
$NWX |
795.30 |
+16.75 |
+2.15% |
+10.90% |
| Broker/Dealer |
$XBD |
468.73 |
+11.30 |
+2.47% |
+24.13% |
| Retail |
$RLX |
3,826.78 |
+52.42 |
+1.39% |
+7.40% |
| Gold & Silver |
$XAU |
157.36 |
+4.41 |
+2.89% |
+9.13% |
| Bank |
$BKX |
133.69 |
+2.08 |
+1.58% |
+36.54% |
| Biotech |
$BTK |
5,564.58 |
+92.79 |
+1.70% |
-3.04% |
|
|
|
 |
Rebound Above 50-Day Moving Average Helped Technical Stance
Kenneth J. Gruneisen - Passed the CAN SLIM® Master's Exam
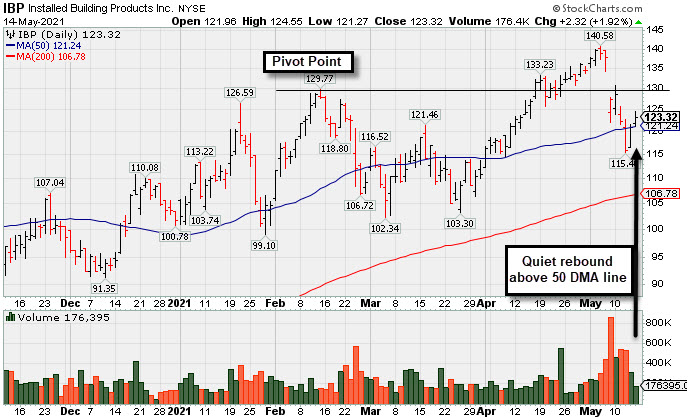
Installed Building Products (IBP +$2.32 or +1.92% to $123.32) showed resilience this week, quietly rebounding above its 50-day moving average (DMA) line ($121.27), helping its outlook improve. More damaging losses below the recent low ($115.46) would raise serious concerns, technically.
Weak action came after it reported Mar '21 quarterly earnings +15% on +10% sales revenues versus the year ago period, below the +25% minimum earnings guideline (C criteria) raising fundamental concerns. IBP currently has an Earnings Per Share Rating of 94. Two of the past 4 consecutive quarterly comparisons were below the +25% minimum earnings guideline (C criteria). Its annual earnings (A criteria) history has been strong.
IBP was highlighted in yellow with new pivot point cited based on its 2/12/21 high plus 10 cents in the mid-day report (read here ). It was last shown in this FSU section on 4/19/21 with an annotated graph under the headline, "Steady Streak of Gains Into New High Territory".
Its current Up/Down Volume Ratio of 1.8 is an unbiased neutral indication with regard to accumulation/distribution over the past 50 days. The high-ranked Building - Maintenance & Service firm has seen the number of top-rated funds owning its shares rose from 226 in Mar '16 to 411 in Mar '21, a reassuring sign concerning the I criteria. Its small supply of only 29.7 million shares outstanding (S criteria) can contribute to greater price volatility in the event of institutional buying or selling. It currently has a Timeliness Rating of B and a Sponsorship Rating of C. |
|
|
Color Codes Explained :
Y - Better candidates highlighted by our
staff of experts.
G - Previously featured
in past reports as yellow but may no longer be buyable under the
guidelines.
***Last / Change / Volume data in this table is the closing quote data***
Symbol/Exchange
Company Name
Industry Group |
PRICE |
CHANGE
(%Change) |
Day High |
Volume
(% DAV)
(% 50 day avg vol) |
52 Wk Hi
% From Hi |
Featured
Date |
Price
Featured |
Pivot Featured |
|
Max Buy |
 SIVB
-
NASDAQ
SIVB
-
NASDAQ
S V B Financial Group
BANKING - Regional - Pacific Banks
|
$578.42
|
+20.86
3.74% |
$580.06
|
314,895
55.73% of 50 DAV
50 DAV is 565,000
|
$595.90
-2.93%
|
4/23/2021
|
$579.70
|
PP = $577.16
|
|
MB = $606.02
|
 Most Recent Note - 5/14/2021 5:24:06 PM
Y - Posted a second consecutive gain with light volume, hovering near its high. Confirming volume-driven gains are still needed to help clinch a convincing technical buy signal. Bullish action came after it reported earnings +293% on +64% sales revenues for the Mar '21 quarter versus the year ago period, its 3rd strong comparison. Completed a new Public Offering on 3/24/21.
>>> FEATURED STOCK ARTICLE : Hit New High But Closed Below Pivot Point - 4/23/2021 |
View all notes |
Set NEW NOTE alert |
Company Profile |
SEC
News |
Chart |
Request a new note
C
A
S
I |
CROX
-
NASDAQ
Crocs Inc
CONSUMER NON-DURABLES - Textile - Apparel Footwear
|
$101.98
|
+1.69
1.69% |
$102.63
|
700,911
49.29% of 50 DAV
50 DAV is 1,422,000
|
$109.91
-7.21%
|
4/27/2021
|
$99.81
|
PP = $86.50
|
|
MB = $90.83
|
Most Recent Note - 5/13/2021 6:03:53 PM
G - Posted a gain today with lighter volume following 3 consecutive losses from its all-time high. It is very extended from the latest base. Prior highs in the $86 area define initial support to watch on pullbacks.
>>> FEATURED STOCK ARTICLE : Powerful "Breakaway Gap" for CROX - 4/27/2021 |
View all notes |
Set NEW NOTE alert |
Company Profile |
SEC
News |
Chart |
Request a new note
C
A
S
I |
RCKY
-
NASDAQ
Rocky Brands Inc
CONSUMER NON-DURABLES - Textile - Apparel Footwear
|
$55.79
|
+0.12
0.22% |
$56.74
|
64,055
71.97% of 50 DAV
50 DAV is 89,000
|
$69.00
-19.14%
|
5/5/2021
|
$61.65
|
PP = $61.55
|
|
MB = $64.63
|
Most Recent Note - 5/12/2021 5:11:08 PM
G - Abruptly pulled back from its all-time high with today's 3rd big volume-driven loss undercutting the prior high in the $61 area raising concerns. Fundamentals remain strong. The 50 DMA line ($53.65) defines the next important support level.
>>> FEATURED STOCK ARTICLE : Rocky Brands Powered Higher After Strong Earnings - 5/5/2021 |
View all notes |
Set NEW NOTE alert |
Company Profile |
SEC
News |
Chart |
Request a new note
C
A
S
I |
CRL
-
NYSE
Charles River Labs Intl
DRUGS - Biotechnology
|
$329.07
|
+8.06
2.51% |
$332.15
|
781,907
141.14% of 50 DAV
50 DAV is 554,000
|
$349.13
-5.75%
|
12/17/2020
|
$247.06
|
PP = $257.98
|
|
MB = $270.88
|
Most Recent Note - 5/14/2021 12:39:47 PM
G - Extended from any sound base, it abruptly retreated from its all-time high with a spurt of volume-driven losses. Its 50 DMA line ($307.75) defines near-term support above the prior high ($303). Reported Mar '21 quarterly earnings +38% on +17%v sales revenues versus the year ago period. Two of the past 3 quarterly comparisons have been above the +25% minimum earnings guideline (C criteria).
>>> FEATURED STOCK ARTICLE : Pulling Back From Record High Following Strong Quarterly Report - 5/6/2021 |
View all notes |
Set NEW NOTE alert |
Company Profile |
SEC
News |
Chart |
Request a new note
C
A
S
I |
CAMT
-
NASDAQ
Camtek Ltd
ELECTRONICS - Scientific and Technical Instrum
|
$27.42
|
+0.98
3.71% |
$27.75
|
239,280
80.57% of 50 DAV
50 DAV is 297,000
|
$36.14
-24.13%
|
4/28/2021
|
$35.03
|
PP = $35.34
|
|
MB = $37.11
|
Most Recent Note - 5/14/2021 5:20:26 PM
G - Remains well below its 50 DMA line ($30.83) after damaging losses. A prompt rebound is needed for its outlook to improve. Subsequent gains and a strong close above the pivot point backed by at least +40% above average volume still are needed to trigger a technical buy signal.
>>> FEATURED STOCK ARTICLE : Earnings Acceleration and Perched at High After Ascending Base - 4/28/2021 |
View all notes |
Set NEW NOTE alert |
Company Profile |
SEC
News |
Chart |
Request a new note
C
A
S
I |
Symbol/Exchange
Company Name
Industry Group |
PRICE |
CHANGE
(%Change) |
Day High |
Volume
(% DAV)
(% 50 day avg vol) |
52 Wk Hi
% From Hi |
Featured
Date |
Price
Featured |
Pivot Featured |
|
Max Buy |
BRKS
-
NASDAQ
Brooks Automation
ELECTRONICS - Semiconductor Equipment and Mate
|
$92.11
|
+2.53
2.82% |
$93.26
|
774,715
94.25% of 50 DAV
50 DAV is 822,000
|
$108.72
-15.28%
|
4/5/2021
|
$99.31
|
PP = $91.88
|
|
MB = $96.47
|
Most Recent Note - 5/13/2021 5:56:47 PM
G - Posted a volume-driven gain today but it is still sputtering below prior highs in the $91 area and also below its 50 DMA line ($91.12). More damaging losses would raise greater concerns.
>>> FEATURED STOCK ARTICLE : Extended From Base and Consolidating After Recent Rally - 4/30/2021 |
View all notes |
Set NEW NOTE alert |
Company Profile |
SEC
News |
Chart |
Request a new note
C
A
S
I |
OPY
-
NYSE
Oppenheimer Holdings Inc
FINANCIAL SERVICES - Investment Brokerage - Regiona
|
$48.87
|
+0.65
1.35% |
$48.96
|
56,521
48.31% of 50 DAV
50 DAV is 117,000
|
$52.45
-6.83%
|
2/25/2021
|
$38.95
|
PP = $38.11
|
|
MB = $40.02
|
Most Recent Note - 5/14/2021 5:25:22 PM
G - Posted a 2nd consecutive quiet gain, hovering near its all-time high, very extended from any sound base. Bullish action came after it reported Mar '21 quarterly earnings +402% on +59% sales revenues versus the year ago period. Prior high in the $44 area defines initial support to watch coinciding with its 50 DMA line.
>>> FEATURED STOCK ARTICLE : Negative Reversal After 7 Consecutive Gains - 4/20/2021 |
View all notes |
Set NEW NOTE alert |
Company Profile |
SEC
News |
Chart |
Request a new note
C
A
S
I |
MTH
-
NYSE
Meritage Homes Corp
MATERIALS and CONSTRUCTION - Residential Construction
|
$112.68
|
+1.41
1.27% |
$113.17
|
327,026
76.28% of 50 DAV
50 DAV is 428,700
|
$120.19
-6.25%
|
10/26/2004
|
$108.84
|
PP = $117.16
|
|
MB = $123.02
|
Most Recent Note - 5/13/2021 5:52:47 PM
Y - Posted a solid gain today, halting its slide following 2 consecutive volume-driven losses after hitting new 52-week highs with volume-driven gains. Subsequent gains above the pivot point with at least +40% above average volume would be a reassuring confirmation of fresh institutional buying demand. Reported earnings +88% on +20% sales revenues for the Mar '21 quarter versus the year ago period, its 7th consecutive strong quarterly comparison above the +25% minimum guideline (C criteria). Annual earnings (A criteria) history has been strong after a downturn in FY '15. See the latest FSU analysis for more details and a new annotated graph.
>>> FEATURED STOCK ARTICLE : Homebuilder Pulled Back After Hitting New High - 5/13/2021 |
View all notes |
Set NEW NOTE alert |
Company Profile |
SEC
News |
Chart |
Request a new note
C
A
S
I |
LAD
-
NYSE
Lithia Motors Inc Cl A
SPECIALTY RETAIL - Auto Dealerships
|
$369.38
|
+9.15
2.54% |
$370.56
|
223,101
75.88% of 50 DAV
50 DAV is 294,000
|
$417.98
-11.63%
|
4/21/2021
|
$377.00
|
PP = $418.08
|
|
MB = $438.98
|
Most Recent Note - 5/14/2021 5:26:47 PM
G - Remains below its 50 DMA line ($385) following a noted streak of losses. A prompt rebound above its 50 DMA line is needed for its outlook to improve. Subsequent gains above the pivot point backed by at least +40% above average volume are needed to trigger a technical buy signal.
>>> FEATURED STOCK ARTICLE : Building a Base With Rebound Above 50-Day Moving Average - 4/21/2021 |
View all notes |
Set NEW NOTE alert |
Company Profile |
SEC
News |
Chart |
Request a new note
C
A
S
I |
MED
-
NYSE
Medifast Inc
SPECIALTY RETAIL - Specialty Retail, Other
|
$297.00
|
+10.61
3.70% |
$297.13
|
157,763
127.23% of 50 DAV
50 DAV is 124,000
|
$296.50
0.17%
|
5/11/2021
|
$285.72
|
PP = $279.56
|
|
MB = $293.54
|
Most Recent Note - 5/14/2021 5:22:57 PM
G - Color code is changed to green after it posted a big gain today rising above its "max buy" level with +27% above average volume for a best-ever close. Showed resilience after briefly slumping back into the prior base.
>>> FEATURED STOCK ARTICLE : Held Ground Following Breakout Gain on Prior Session - 5/11/2021 |
View all notes |
Set NEW NOTE alert |
Company Profile |
SEC
News |
Chart |
Request a new note
C
A
S
I |
Symbol/Exchange
Company Name
Industry Group |
PRICE |
CHANGE
(%Change) |
Day High |
Volume
(% DAV)
(% 50 day avg vol) |
52 Wk Hi
% From Hi |
Featured
Date |
Price
Featured |
Pivot Featured |
|
Max Buy |
CLFD
-
NASDAQ
Clearfield Inc
TELECOMMUNICATIONS - Cables / Satalite Equipment
|
$35.34
|
+1.01
2.94% |
$35.84
|
61,090
43.95% of 50 DAV
50 DAV is 139,000
|
$40.26
-12.22%
|
4/26/2021
|
$39.68
|
PP = $38.85
|
|
MB = $40.79
|
Most Recent Note - 5/13/2021 6:02:11 PM
Y - Posted a solid gain today following 3 consecutive losses with below average volume. Fundamentals remain strong after it reported Mar '21 quarterly earnings +440% on +45% sales revenues versus the year ago period, continuing its strong earnings track record.
>>> FEATURED STOCK ARTICLE : Rallied Straight Up From Bottom of 10-Week Base - 4/26/2021 |
View all notes |
Set NEW NOTE alert |
Company Profile |
SEC
News |
Chart |
Request a new note
C
A
S
I |
SMPL
-
NASDAQ
Simply Good Foods Co
Food-Confectionery
|
$33.41
|
+0.24
0.71% |
$33.86
|
764,239
112.26% of 50 DAV
50 DAV is 680,800
|
$35.34
-5.46%
|
12/28/2020
|
$30.40
|
PP = $31.44
|
|
MB = $33.01
|
Most Recent Note - 5/13/2021 1:10:15 PM
G - Undercutting its 50 DMA line ($32.54) with today's loss backed by higher volume raising concerns. Reported Feb '21 quarterly earnings +9% on +2% sales revenues versus the year ago period, below the +25% minimum earnings guideline (C criteria), raising fundamental concerns. Its current Relative Strength Rating is 79, just below the 80+ minimum guideline for buy candidates.
>>> FEATURED STOCK ARTICLE : Hovering Near All-Time High Following Lackluster Quarter - 5/10/2021 |
View all notes |
Set NEW NOTE alert |
Company Profile |
SEC
News |
Chart |
Request a new note
C
A
S
I |
IBP
-
NYSE
Installed Building Prod
DIVERSIFIED SERVICES - Business/Management Services
|
$123.32
|
+2.32
1.92% |
$124.55
|
176,395
71.41% of 50 DAV
50 DAV is 247,000
|
$140.58
-12.28%
|
4/19/2021
|
$131.15
|
PP = $130.21
|
|
MB = $136.72
|
Most Recent Note - 5/14/2021 5:18:20 PM
G - Showed resilience late this week with quiet gains while rebounding above its 50 DMA line ($121). More damaging losses would raise serious concerns. Weak action came after it reported Mar '21 quarterly earnings +15% on +10% sales revenues versus the year ago period, below the +25% minimum earnings guideline (C criteria) raising fundamental concerns. See the latest FSU analysis for more details and a new annotated graph.
>>> FEATURED STOCK ARTICLE : Rebound Above 50-Day Moving Average Helped Technical Stance - 5/14/2021 |
View all notes |
Set NEW NOTE alert |
Company Profile |
SEC
News |
Chart |
Request a new note
C
A
S
I |
QRVO
-
NASDAQ
"Qorvo, Inc"
ELECTRONICS - Semiconductor - Integrated Cir
|
$171.01
|
+4.16
2.49% |
$172.89
|
1,290,006
1,060.86% of 50 DAV
50 DAV is 121,600
|
$201.68
-15.21%
|
4/1/2021
|
$190.48
|
PP = $191.92
|
|
MB = $201.52
|
Most Recent Note - 5/14/2021 12:56:51 PM
G - Halted its slide this week after violating its 50 DMA line and the prior low with a damaging volume-driven loss on 5/10/21 triggering a technical sell signal. A rebound above the 50 DMA line ($183) is needed for its outlook to improve. Its Relative Strength Rating is 59, below the 80+ minimum for buy candidates. Reported Mar '21 quarterly earnings +75% on +36% sales revenues versus the year ago period, its 3rd very strong quarterly comparison. It stalled after recently wedging up to new highs from a 9-week base.
>>> FEATURED STOCK ARTICLE : Quiet Gain For Best Ever Close - 4/29/2021 |
View all notes |
Set NEW NOTE alert |
Company Profile |
SEC
News |
Chart |
Request a new note
C
A
S
I |
YETI
-
NYSE
Yeti Holdings Inc
Leisure-Products
|
$88.55
|
+2.73
3.18% |
$88.77
|
2,540,229
188.86% of 50 DAV
50 DAV is 1,345,000
|
$90.65
-2.32%
|
5/13/2021
|
$84.20
|
PP = $90.65
|
|
MB = $95.18
|
Most Recent Note - 5/14/2021 1:08:27 PM
Y - Quickly rebounding after a pullback tested support at its 50 DMA line and prior high. Reported Mar 21 quarterly earnings +245% on +42% sales revenues versus the year ago period, continuing its strong earnings track record. Color code was changed to yellow as it was noted that a valid secondary buy point exists from its 10 WMA line up to 5% above the latest high.
>>> FEATURED STOCK ARTICLE : Hovering Near Record High Following Volume-Driven Gains - 5/3/2021 |
View all notes |
Set NEW NOTE alert |
Company Profile |
SEC
News |
Chart |
Request a new note
C
A
S
I |
Symbol/Exchange
Company Name
Industry Group |
PRICE |
CHANGE
(%Change) |
Day High |
Volume
(% DAV)
(% 50 day avg vol) |
52 Wk Hi
% From Hi |
Featured
Date |
Price
Featured |
Pivot Featured |
|
Max Buy |
MRBK
-
NASDAQ
Meridian Corp
Banks-Northeast
|
$26.75
|
+0.82
3.16% |
$27.31
|
51,096
143.53% of 50 DAV
50 DAV is 35,600
|
$27.96
-4.33%
|
2/22/2021
|
$25.58
|
PP = $26.10
|
|
MB = $27.41
|
Most Recent Note - 5/13/2021 5:54:43 PM
Y - Posted a gain today with slightly above average volume. Consolidating near its 50 DMA line ($25.90), still perched only -7.3% off its 52-week high. Reported Mar '21 earnings +323% on +93% sales revenues versus the year ago period, continuing its strong earnings track record. Recent low ($24.01 on 4/21/21) defines important near-term support where any violation may trigger a worrisome technical sell signal. Its Relative Strength Rating is 78, below the 80 minimum guideline.
>>> FEATURED STOCK ARTICLE : Bank Consolidating Near 50 Day Moving Average Line - 5/7/2021 |
View all notes |
Set NEW NOTE alert |
Company Profile |
SEC
News |
Chart |
Request a new note
C
A
S
I |
CLAR
-
NASDAQ
Clarus Corporation
Leisure-Products
|
$21.28
|
+0.38
1.82% |
$21.46
|
162,945
95.85% of 50 DAV
50 DAV is 170,000
|
$21.93
-2.96%
|
5/12/2021
|
$21.40
|
PP = $19.73
|
|
MB = $20.72
|
Most Recent Note - 5/12/2021 5:06:34 PM
Y - Held its ground today after highlighted in yellow with pivot point cited based on its 3/09/21 high plus 10 cents. Quickly getting extended from prior highs with today's 4th consecutive gain backed by ever-increasing volume. The Sep, Dec '20 and Mar '21 quarterly results showed very strong earnings increases over the year ago periods with impressive acceleration in sales revenues growth rate. Annual earnings history has been strong. See the latest FSU analysis for more details and a new annotated graph.
>>> FEATURED STOCK ARTICLE : 4 Volume-Driven Gains Into New High Territory - 5/12/2021 |
View all notes |
Set NEW NOTE alert |
Company Profile |
SEC
News |
Chart |
Request a new note
C
A
S
I |
|
|
|
THESE ARE NOT BUY RECOMMENDATIONS!
Comments contained in the body of this report are technical
opinions only. The material herein has been obtained
from sources believed to be reliable and accurate, however,
its accuracy and completeness cannot be guaranteed.
This site is not an investment advisor, hence it does
not endorse or recommend any securities or other investments.
Any recommendation contained in this report may not
be suitable for all investors and it is not to be deemed
an offer or solicitation on our part with respect to
the purchase or sale of any securities. All trademarks,
service marks and trade names appearing in this report
are the property of their respective owners, and are
likewise used for identification purposes only.
This report is a service available
only to active Paid Premium Members.
You may opt-out of receiving report notifications
at any time. Questions or comments may be submitted
by writing to Premium Membership Services 665 S.E. 10 Street, Suite 201 Deerfield Beach, FL 33441-5634 or by calling 1-800-965-8307
or 954-785-1121.
|
|
|