You are not logged in.
This means you
CAN ONLY VIEW reports that were published prior to Thursday, March 20, 2025.
You
MUST UPGRADE YOUR MEMBERSHIP if you want to see any current reports.
AFTER MARKET UPDATE - TUESDAY, MAY 18TH, 2021
Previous After Market Report Next After Market Report >>>
|
|
|
|
DOW |
-267.13 |
34,060.66 |
-0.78% |
|
Volume |
927,896,768 |
+5% |
|
Volume |
4,236,770,300 |
+7% |
|
NASDAQ |
-67.62 |
13,311.43 |
-0.51% |
|
Advancers |
1,508 |
46% |
|
Advancers |
2,126 |
51% |
|
S&P 500 |
-35.46 |
4,127.83 |
-0.85% |
|
Decliners |
1,763 |
54% |
|
Decliners |
2,012 |
49% |
|
Russell 2000 |
-16.24 |
2,210.88 |
-0.73% |
|
52 Wk Highs |
228 |
|
|
52 Wk Highs |
136 |
|
|
S&P 600 |
-15.07 |
1,341.76 |
-1.11% |
|
52 Wk Lows |
24 |
|
|
52 Wk Lows |
53 |
|
|
 |
Major Indices Fell With Volume Totals Higher
Kenneth J. Gruneisen - Passed the CAN SLIM® Master's Exam
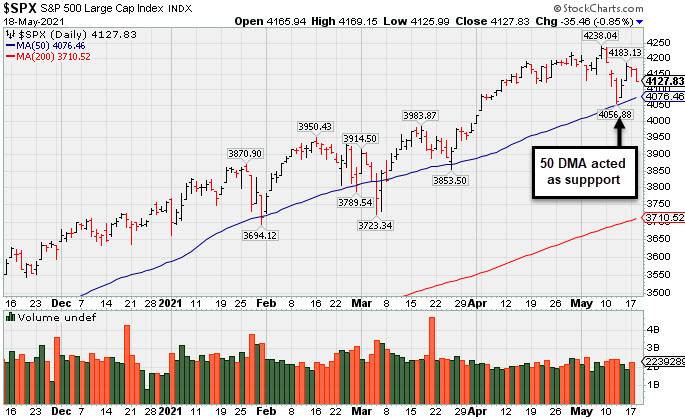
The Dow and S&P 500 both declined for a second day, sliding 267 points and 0.9%, respectively. The Nasdaq Composite reversed earlier gains, falling 0.6%, and remains on pace for its worst monthly performance since September (-4.7% month-to-date in May). The volume totals reported were higher than the prior session on the NYSE and on the Nasdaq exchange, indicative of distributional pressure. Advancers led decliners by a narrow margin on the Nasdaq exchange while decliners narrowly led advancers on the NYSE. There were 51 high-ranked companies from the Leaders List that hit new 52-week highs and were listed on the BreakOuts Page, versus 42 on the prior session. New 52-week highs totals expanded and outnumbered shrinking new 52-week lows totals on both the NYSE and the Nasdaq exchange. The major indices (M criteria) are in a confirmed uptrend. Investors are reminded to always make buying and selling decisions on case-by-case basis under the strict criteria and rules of the fact-based investment system.
PICTURED: The S&P 500 Index recently found support at its 50-day moving average (DMA) line.
UU.S. stocks ended lower on Tuesday as investors weighed solid retail earnings results against disappointing housing data. On the data front, housing starts declined a worse-than-expected 9.5% in April, weighed down by increasing materials costs and supply chain issues. Building permits increased 0.3% during the same period, missing estimates of a 0.6% advance. Treasuries were little changed as market participants awaited tomorrow’s release of the Federal Reserve’s April meeting minutes. The yield on the benchmark 10-year note held steady at 1.64%. In commodities, WTI crude slid 1.1% to $65.57/barrel following media reports that Washington and Tehran made progress towards reviving a nuclear deal, which could pave the way for Iran to boost its oil exports.
Nine of 11 S&P 500 sectors closed in negative territory, with Real Estate and Health Care the lone advancers. In earnings, Walmart (WMT +2.17%) rose after firmly topping Wall Street profit estimates on strong grocery sales and a 37% jump in e-commerce revenue. The big-box retailer also lifted its 2021 outlook. Meanwhile, Home Depot (HD -1.02%) fell as a lack of forward guidance and disappointing housing data overshadowed a strong top and bottom line beat. In other corporate news, AT&T (T -5.80%) fell on reports its dividend payout ratio would be cut as a result of its media spinoff deal with Discovery, Inc. (DISCA -1.57%) |
 Kenneth J. Gruneisen started out as a licensed stockbroker in August 1987, a couple of months prior to the historic stock market crash that took the Dow Jones Industrial Average down -22.6% in a single day. He has published daily fact-based fundamental and technical analysis on high-ranked stocks online for two decades. Through FACTBASEDINVESTING.COM, Kenneth provides educational articles, news, market commentary, and other information regarding proven investment systems that work in good times and bad.
Comments contained in the body of this report are technical opinions only and are not necessarily those of Gruneisen Growth Corp. The material herein has been obtained from sources believed to be reliable and accurate, however, its accuracy and completeness cannot be guaranteed. Our firm, employees, and customers may effect transactions, including transactions contrary to any recommendation herein, or have positions in the securities mentioned herein or options with respect thereto. Any recommendation contained in this report may not be suitable for all investors and it is not to be deemed an offer or solicitation on our part with respect to the purchase or sale of any securities. |
|
 |
Energy, Financial, Retail, and Semiconductor Indexes Fell
Kenneth J. Gruneisen - Passed the CAN SLIM® Master's Exam
The Bank Index ($BKX -1.75%) and Broker/Dealer Index ($XBD -1.51%) both lost ground and the Retail Index ($RLX -1.15%) also created a drag on the major averages on Tuesday. The tech sector was mixed as the Biotech Index ($BTK +0.35%) eked out a small gain while the Semiconductor Index ($SOX -0.85%) outpaced the Networking Index ($NWX -0.17%) to the downside. The Oil Services Index ($OSX -2.88%) and Integrated Oil Index ($XOI -1.89%) both slumped for standout losses while the Gold & Silver Index ($XAU -0.41%) suffered a smaller loss. PICTURED: The Oil Services Index ($OSX -2.88%) pulled back on Tuesday. It is perched within striking distance of its March 2021 high.
| Oil Services |
$OSX |
62.01 |
-1.84 |
-2.88% |
+39.89% |
| Integrated Oil |
$XOI |
1,099.12 |
-21.20 |
-1.89% |
+38.69% |
| Semiconductor |
$SOX |
2,929.40 |
-25.22 |
-0.85% |
+4.79% |
| Networking |
$NWX |
793.34 |
-1.38 |
-0.17% |
+10.63% |
| Broker/Dealer |
$XBD |
460.42 |
-7.05 |
-1.51% |
+21.93% |
| Retail |
$RLX |
3,800.49 |
-44.31 |
-1.15% |
+6.66% |
| Gold & Silver |
$XAU |
165.33 |
-0.68 |
-0.41% |
+14.66% |
| Bank |
$BKX |
132.19 |
-2.35 |
-1.75% |
+35.01% |
| Biotech |
$BTK |
5,533.60 |
+19.40 |
+0.35% |
-3.58% |
|
|
|
 |
Thinly-Traded Bank Consolidating Above 50-Day Moving Average
Kenneth J. Gruneisen - Passed the CAN SLIM® Master's Exam
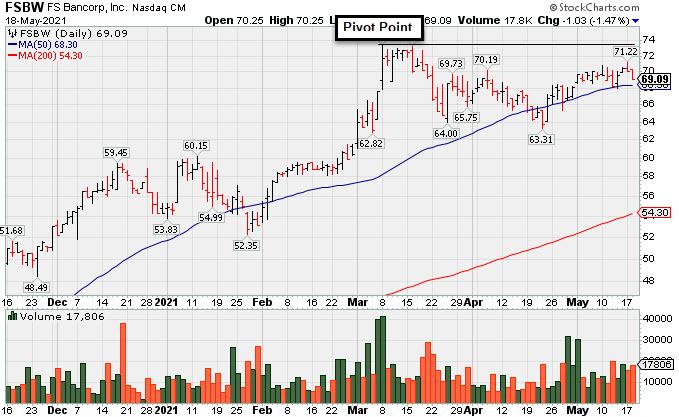
F S Bancorp (FSBW -$1.03 or -1.47% to $69.09) was highlighted in yellow with pivot point cited based on its 3/08/21 high plus 10 cents in the earlier mid-day report (read here). It is consolidating above its 50-day moving average (DMA) line ($68.52) where it found prompt support during its ongoing ascent. Subsequent gains above the pivot point backed by at least +40% above average volume are needed to trigger a technical buy signal.
FSBW has an Earnings Per Share Rating of 97. It reported Mar '21 quarterly earnings +137% on +16% sales revenues versus the year ago period, its 4th consecutive strong quarterly comparison above the +25% minimum earnings guideline (C criteria), matching the fact-based investment system's winning models. Its annual earnings (A criteria) history has been great. This thinly traded Bank completed a new Public Offering on 9/08/17.
The number of top-rated funds owning its shares rose from 168 in Jun '20 to 184 in Mar '21, a reassuring sign concerning the I criteria. Its small supply of only 4.2 million shares outstanding can contribute to greater price volatility in the event of institutional buying or selling. It has a Timeliness Rating of A and Sponsorship Rating of B.
|
|
|
Color Codes Explained :
Y - Better candidates highlighted by our
staff of experts.
G - Previously featured
in past reports as yellow but may no longer be buyable under the
guidelines.
***Last / Change / Volume data in this table is the closing quote data***
Symbol/Exchange
Company Name
Industry Group |
PRICE |
CHANGE
(%Change) |
Day High |
Volume
(% DAV)
(% 50 day avg vol) |
52 Wk Hi
% From Hi |
Featured
Date |
Price
Featured |
Pivot Featured |
|
Max Buy |
 SIVB
-
NASDAQ
SIVB
-
NASDAQ
S V B Financial Group
BANKING - Regional - Pacific Banks
|
$575.46
|
-2.08
-0.36% |
$587.86
|
463,153
83.00% of 50 DAV
50 DAV is 558,000
|
$595.90
-3.43%
|
4/23/2021
|
$579.70
|
PP = $577.16
|
|
MB = $606.02
|
Most Recent Note - 5/14/2021 5:24:06 PM
Y - Posted a second consecutive gain with light volume, hovering near its high. Confirming volume-driven gains are still needed to help clinch a convincing technical buy signal. Bullish action came after it reported earnings +293% on +64% sales revenues for the Mar '21 quarter versus the year ago period, its 3rd strong comparison. Completed a new Public Offering on 3/24/21.
>>> FEATURED STOCK ARTICLE : Hit New High But Closed Below Pivot Point - 4/23/2021 |
View all notes |
Set NEW NOTE alert |
Company Profile |
SEC
News |
Chart |
Request a new note
C
A
S
I |
CROX
-
NASDAQ
Crocs Inc
CONSUMER NON-DURABLES - Textile - Apparel Footwear
|
$101.79
|
-2.09
-2.01% |
$105.28
|
690,989
49.53% of 50 DAV
50 DAV is 1,395,000
|
$109.91
-7.39%
|
4/27/2021
|
$99.81
|
PP = $86.50
|
|
MB = $90.83
|
Most Recent Note - 5/13/2021 6:03:53 PM
G - Posted a gain today with lighter volume following 3 consecutive losses from its all-time high. It is very extended from the latest base. Prior highs in the $86 area define initial support to watch on pullbacks.
>>> FEATURED STOCK ARTICLE : Powerful "Breakaway Gap" for CROX - 4/27/2021 |
View all notes |
Set NEW NOTE alert |
Company Profile |
SEC
News |
Chart |
Request a new note
C
A
S
I |
RCKY
-
NASDAQ
Rocky Brands Inc
CONSUMER NON-DURABLES - Textile - Apparel Footwear
|
$54.50
|
-2.38
-4.18% |
$57.57
|
91,873
103.23% of 50 DAV
50 DAV is 89,000
|
$69.00
-21.01%
|
5/5/2021
|
$61.65
|
PP = $61.55
|
|
MB = $64.63
|
Most Recent Note - 5/17/2021 5:51:59 PM
G - Halted its slide above its 50 DMA line ($54.30) after undercutting the prior high ($61) area raised concerns. Fundamentals remain strong. More damaging losses would raise serious concerns and trigger a technical sell signal.
>>> FEATURED STOCK ARTICLE : Rocky Brands Powered Higher After Strong Earnings - 5/5/2021 |
View all notes |
Set NEW NOTE alert |
Company Profile |
SEC
News |
Chart |
Request a new note
C
A
S
I |
CRL
-
NYSE
Charles River Labs Intl
DRUGS - Biotechnology
|
$319.70
|
-3.01
-0.93% |
$323.13
|
508,479
89.84% of 50 DAV
50 DAV is 566,000
|
$349.13
-8.43%
|
12/17/2020
|
$247.06
|
PP = $257.98
|
|
MB = $270.88
|
Most Recent Note - 5/14/2021 12:39:47 PM
G - Extended from any sound base, it abruptly retreated from its all-time high with a spurt of volume-driven losses. Its 50 DMA line ($307.75) defines near-term support above the prior high ($303). Reported Mar '21 quarterly earnings +38% on +17%v sales revenues versus the year ago period. Two of the past 3 quarterly comparisons have been above the +25% minimum earnings guideline (C criteria).
>>> FEATURED STOCK ARTICLE : Pulling Back From Record High Following Strong Quarterly Report - 5/6/2021 |
View all notes |
Set NEW NOTE alert |
Company Profile |
SEC
News |
Chart |
Request a new note
C
A
S
I |
CAMT
-
NASDAQ
Camtek Ltd
ELECTRONICS - Scientific and Technical Instrum
|
$27.59
|
+0.37
1.36% |
$28.17
|
222,962
75.84% of 50 DAV
50 DAV is 294,000
|
$36.14
-23.66%
|
4/28/2021
|
$35.03
|
PP = $35.34
|
|
MB = $37.11
|
 Most Recent Note - 5/18/2021 4:00:07 PM
G - Posted a gain today with light volume. Remains well below its 50 DMA line ($30.89) after damaging losses. A prompt rebound is needed for its outlook to improve. Subsequent gains and a strong close above the pivot point backed by at least +40% above average volume still are needed to trigger a technical buy signal.
>>> FEATURED STOCK ARTICLE : Earnings Acceleration and Perched at High After Ascending Base - 4/28/2021 |
View all notes |
Set NEW NOTE alert |
Company Profile |
SEC
News |
Chart |
Request a new note
C
A
S
I |
Symbol/Exchange
Company Name
Industry Group |
PRICE |
CHANGE
(%Change) |
Day High |
Volume
(% DAV)
(% 50 day avg vol) |
52 Wk Hi
% From Hi |
Featured
Date |
Price
Featured |
Pivot Featured |
|
Max Buy |
BRKS
-
NASDAQ
Brooks Automation
ELECTRONICS - Semiconductor Equipment and Mate
|
$91.44
|
+0.65
0.72% |
$93.33
|
1,174,738
143.09% of 50 DAV
50 DAV is 821,000
|
$108.72
-15.89%
|
4/5/2021
|
$99.31
|
PP = $91.88
|
|
MB = $96.47
|
Most Recent Note - 5/13/2021 5:56:47 PM
G - Posted a volume-driven gain today but it is still sputtering below prior highs in the $91 area and also below its 50 DMA line ($91.12). More damaging losses would raise greater concerns.
>>> FEATURED STOCK ARTICLE : Extended From Base and Consolidating After Recent Rally - 4/30/2021 |
View all notes |
Set NEW NOTE alert |
Company Profile |
SEC
News |
Chart |
Request a new note
C
A
S
I |
OPY
-
NYSE
Oppenheimer Holdings Inc
FINANCIAL SERVICES - Investment Brokerage - Regiona
|
$48.25
|
-1.22
-2.47% |
$49.86
|
75,351
65.52% of 50 DAV
50 DAV is 115,000
|
$52.45
-8.01%
|
2/25/2021
|
$38.95
|
PP = $38.11
|
|
MB = $40.02
|
Most Recent Note - 5/17/2021 5:47:07 PM
G - Posted a 3rd consecutive quiet gain, hovering near its all-time high, very extended from any sound base. Bullish action came after it reported Mar '21 quarterly earnings +402% on +59% sales revenues versus the year ago period. Prior high in the $44 area defines initial support to watch coinciding with its 50 DMA line. See the latest FSU analysis for more details and a new annotated graph.
>>> FEATURED STOCK ARTICLE : Extended From Any Sound Base After Decent Rally - 5/17/2021 |
View all notes |
Set NEW NOTE alert |
Company Profile |
SEC
News |
Chart |
Request a new note
C
A
S
I |
MTH
-
NYSE
Meritage Homes Corp
MATERIALS and CONSTRUCTION - Residential Construction
|
$108.15
|
-3.71
-3.32% |
$112.00
|
348,853
82.67% of 50 DAV
50 DAV is 422,000
|
$120.19
-10.02%
|
5/12/2021
|
$108.84
|
PP = $117.16
|
|
MB = $123.02
|
Most Recent Note - 5/18/2021 4:54:50 PM
Y - Pulled back today for a 2nd consecutive loss with light volume. Subsequent gains above the pivot point with at least +40% above average volume would be a reassuring confirmation of fresh institutional buying demand. Reported earnings +88% on +20% sales revenues for the Mar '21 quarter versus the year ago period, its 7th consecutive strong quarterly comparison above the +25% minimum guideline (C criteria). Annual earnings (A criteria) history has been strong after a downturn in FY '15.
>>> FEATURED STOCK ARTICLE : Homebuilder Pulled Back After Hitting New High - 5/13/2021 |
View all notes |
Set NEW NOTE alert |
Company Profile |
SEC
News |
Chart |
Request a new note
C
A
S
I |
LAD
-
NYSE
Lithia Motors Inc Cl A
SPECIALTY RETAIL - Auto Dealerships
|
$356.25
|
-9.84
-2.69% |
$368.72
|
253,346
88.27% of 50 DAV
50 DAV is 287,000
|
$417.98
-14.77%
|
4/21/2021
|
$377.00
|
PP = $418.08
|
|
MB = $438.98
|
Most Recent Note - 5/14/2021 5:26:47 PM
G - Remains below its 50 DMA line ($385) following a noted streak of losses. A prompt rebound above its 50 DMA line is needed for its outlook to improve. Subsequent gains above the pivot point backed by at least +40% above average volume are needed to trigger a technical buy signal.
>>> FEATURED STOCK ARTICLE : Building a Base With Rebound Above 50-Day Moving Average - 4/21/2021 |
View all notes |
Set NEW NOTE alert |
Company Profile |
SEC
News |
Chart |
Request a new note
C
A
S
I |
MED
-
NYSE
Medifast Inc
SPECIALTY RETAIL - Specialty Retail, Other
|
$317.14
|
+9.94
3.24% |
$326.81
|
213,955
172.54% of 50 DAV
50 DAV is 124,000
|
$308.44
2.82%
|
5/11/2021
|
$285.72
|
PP = $279.56
|
|
MB = $293.54
|
Most Recent Note - 5/18/2021 12:41:40 PM
G - Rising into record high territory with today's 4th consecutive volume-driven gain, getting extended from the previously noted base. Prior highs in the $279 area define initial support to watch on pullbacks.
>>> FEATURED STOCK ARTICLE : Held Ground Following Breakout Gain on Prior Session - 5/11/2021 |
View all notes |
Set NEW NOTE alert |
Company Profile |
SEC
News |
Chart |
Request a new note
C
A
S
I |
Symbol/Exchange
Company Name
Industry Group |
PRICE |
CHANGE
(%Change) |
Day High |
Volume
(% DAV)
(% 50 day avg vol) |
52 Wk Hi
% From Hi |
Featured
Date |
Price
Featured |
Pivot Featured |
|
Max Buy |
CLFD
-
NASDAQ
Clearfield Inc
TELECOMMUNICATIONS - Cables / Satalite Equipment
|
$36.54
|
+0.85
2.38% |
$37.07
|
76,389
57.44% of 50 DAV
50 DAV is 133,000
|
$40.26
-9.24%
|
4/26/2021
|
$39.68
|
PP = $38.85
|
|
MB = $40.79
|
Most Recent Note - 5/13/2021 6:02:11 PM
Y - Posted a solid gain today following 3 consecutive losses with below average volume. Fundamentals remain strong after it reported Mar '21 quarterly earnings +440% on +45% sales revenues versus the year ago period, continuing its strong earnings track record.
>>> FEATURED STOCK ARTICLE : Rallied Straight Up From Bottom of 10-Week Base - 4/26/2021 |
View all notes |
Set NEW NOTE alert |
Company Profile |
SEC
News |
Chart |
Request a new note
C
A
S
I |
FSBW
-
NASDAQ
F S Bancorp
Banks-West/Southwest
|
$69.09
|
-1.03
-1.47% |
$70.25
|
17,806
127.19% of 50 DAV
50 DAV is 14,000
|
$73.62
-6.15%
|
5/18/2021
|
$70.16
|
PP = $73.72
|
|
MB = $77.41
|
Most Recent Note - 5/18/2021 4:53:22 PM
Y - Color code was changed to yellow with pivot point cited based on its 3/08/21 high plus 10 cents. Consolidating above its 50 DMA line ($68.54) where it found prompt support during its ongoing ascent. Subsequent gains above the pivot point backed by at least +40% above average volume are needed to trigger a technical buy signal. Reported Mar '21 quarterly earnings +137% on +16% sales revenues versus the year ago period, its 4th consecutive strong quarterly comparison above the +25% minimum earnings guideline (C criteria), matching the fact-based investment system's winning models. Its annual earnings (A criteria) history has been great. This thinly traded Bank completed a new Public Offering on 9/08/17. See the latest FSU analysis for more details and a new annotated graph.
>>> FEATURED STOCK ARTICLE : Thinly-Traded Bank Consolidating Above 50-Day Moving Average - 5/18/2021 |
View all notes |
Set NEW NOTE alert |
Company Profile |
SEC
News |
Chart |
Request a new note
C
A
S
I |
SMPL
-
NASDAQ
Simply Good Foods Co
Food-Confectionery
|
$33.76
|
+2.07
6.53% |
$34.20
|
881,471
126.94% of 50 DAV
50 DAV is 694,400
|
$35.34
-4.47%
|
12/28/2020
|
$30.40
|
PP = $31.44
|
|
MB = $33.01
|
Most Recent Note - 5/18/2021 3:59:02 PM
G - Rebounding above its 50 DMA line ($32.74) with today's big gain backed by above average volume, raising concerns. Reported Feb '21 quarterly earnings +9% on +2% sales revenues versus the year ago period, below the +25% minimum earnings guideline (C criteria), raising fundamental concerns. Its current Relative Strength Rating is 71, below the 80+ minimum guideline for buy candidates.
>>> FEATURED STOCK ARTICLE : Hovering Near All-Time High Following Lackluster Quarter - 5/10/2021 |
View all notes |
Set NEW NOTE alert |
Company Profile |
SEC
News |
Chart |
Request a new note
C
A
S
I |
IBP
-
NYSE
"Installed Building Products, Inc"
DIVERSIFIED SERVICES - Business/Management Services
|
$116.54
|
-4.36
-3.61% |
$121.05
|
200,381
80.96% of 50 DAV
50 DAV is 247,500
|
$140.58
-17.10%
|
4/19/2021
|
$131.15
|
PP = $130.21
|
|
MB = $136.72
|
Most Recent Note - 5/18/2021 4:56:39 PM
G - Slumped below its 50 DMA line ($121) with today's 2nd consecutive loss with light volume. More damaging losses below the prior low ($115.46 on 5/12/21) would raise serious concerns. Weak action came after it reported Mar '21 quarterly earnings +15% on +10% sales revenues versus the year ago period, below the +25% minimum earnings guideline (C criteria) raising fundamental concerns.
>>> FEATURED STOCK ARTICLE : Rebound Above 50-Day Moving Average Helped Technical Stance - 5/14/2021 |
View all notes |
Set NEW NOTE alert |
Company Profile |
SEC
News |
Chart |
Request a new note
C
A
S
I |
QRVO
-
NASDAQ
"Qorvo, Inc"
ELECTRONICS - Semiconductor - Integrated Cir
|
$170.07
|
-1.01
-0.59% |
$173.28
|
730,712
61.18% of 50 DAV
50 DAV is 1,194,400
|
$201.68
-15.67%
|
4/1/2021
|
$190.48
|
PP = $191.92
|
|
MB = $201.52
|
Most Recent Note - 5/14/2021 12:56:51 PM
G - Halted its slide this week after violating its 50 DMA line and the prior low with a damaging volume-driven loss on 5/10/21 triggering a technical sell signal. A rebound above the 50 DMA line ($183) is needed for its outlook to improve. Its Relative Strength Rating is 59, below the 80+ minimum for buy candidates. Reported Mar '21 quarterly earnings +75% on +36% sales revenues versus the year ago period, its 3rd very strong quarterly comparison. It stalled after recently wedging up to new highs from a 9-week base.
>>> FEATURED STOCK ARTICLE : Quiet Gain For Best Ever Close - 4/29/2021 |
View all notes |
Set NEW NOTE alert |
Company Profile |
SEC
News |
Chart |
Request a new note
C
A
S
I |
Symbol/Exchange
Company Name
Industry Group |
PRICE |
CHANGE
(%Change) |
Day High |
Volume
(% DAV)
(% 50 day avg vol) |
52 Wk Hi
% From Hi |
Featured
Date |
Price
Featured |
Pivot Featured |
|
Max Buy |
YETI
-
NYSE
Yeti Holdings Inc
Leisure-Products
|
$86.20
|
+0.19
0.22% |
$87.19
|
2,112,317
153.96% of 50 DAV
50 DAV is 1,372,000
|
$90.65
-4.91%
|
5/13/2021
|
$84.20
|
PP = $90.65
|
|
MB = $95.18
|
Most Recent Note - 5/17/2021 12:56:01 PM
Y - Quickly rebounded after a pullback last week tested support at its 50 DMA line and prior high. Reported Mar 21 quarterly earnings +245% on +42% sales revenues versus the year ago period, continuing its strong earnings track record. Color code was changed to yellow as it was noted that a valid secondary buy point exists from its 10 WMA line up to 5% above the latest high.
>>> FEATURED STOCK ARTICLE : Hovering Near Record High Following Volume-Driven Gains - 5/3/2021 |
View all notes |
Set NEW NOTE alert |
Company Profile |
SEC
News |
Chart |
Request a new note
C
A
S
I |
MRBK
-
NASDAQ
Meridian Corp
Banks-Northeast
|
$27.77
|
+1.30
4.91% |
$29.18
|
74,021
211.49% of 50 DAV
50 DAV is 35,000
|
$27.96
-0.68%
|
5/18/2021
|
$25.58
|
PP = $28.06
|
|
MB = $29.46
|
Most Recent Note - 5/18/2021 3:57:55 PM
Y - New pivot point is cited based on its 3/11/21 high plus 10 cents. Hitting a new 52-week high with today's big volume-driven gain clearing an orderly consolidation. Reported Mar '21 earnings +323% on +93% sales revenues versus the year ago period, continuing its strong earnings track record. Recent low ($24.01 on 4/21/21) defines important near-term support where any violation may trigger a worrisome technical sell signal. Its Relative Strength Rating is 80, at the 80 minimum guideline.
>>> FEATURED STOCK ARTICLE : Bank Consolidating Near 50 Day Moving Average Line - 5/7/2021 |
View all notes |
Set NEW NOTE alert |
Company Profile |
SEC
News |
Chart |
Request a new note
C
A
S
I |
CLAR
-
NASDAQ
Clarus Corporation
Leisure-Products
|
$21.24
|
-0.22
-1.03% |
$22.27
|
135,914
80.90% of 50 DAV
50 DAV is 168,000
|
$21.93
-3.15%
|
5/12/2021
|
$21.40
|
PP = $19.73
|
|
MB = $20.72
|
Most Recent Note - 5/17/2021 5:50:02 PM
G - Color code is changed to green after rising even further above its "max buy" level with today's gain with light volume for a best-ever close. Prior high ($19.63 on 3/09/21) defines initial support to watch on pullbacks.
>>> FEATURED STOCK ARTICLE : 4 Volume-Driven Gains Into New High Territory - 5/12/2021 |
View all notes |
Set NEW NOTE alert |
Company Profile |
SEC
News |
Chart |
Request a new note
C
A
S
I |
|
|
|
THESE ARE NOT BUY RECOMMENDATIONS!
Comments contained in the body of this report are technical
opinions only. The material herein has been obtained
from sources believed to be reliable and accurate, however,
its accuracy and completeness cannot be guaranteed.
This site is not an investment advisor, hence it does
not endorse or recommend any securities or other investments.
Any recommendation contained in this report may not
be suitable for all investors and it is not to be deemed
an offer or solicitation on our part with respect to
the purchase or sale of any securities. All trademarks,
service marks and trade names appearing in this report
are the property of their respective owners, and are
likewise used for identification purposes only.
This report is a service available
only to active Paid Premium Members.
You may opt-out of receiving report notifications
at any time. Questions or comments may be submitted
by writing to Premium Membership Services 665 S.E. 10 Street, Suite 201 Deerfield Beach, FL 33441-5634 or by calling 1-800-965-8307
or 954-785-1121.
|
|
|