You are not logged in.
This means you
CAN ONLY VIEW reports that were published prior to Thursday, March 20, 2025.
You
MUST UPGRADE YOUR MEMBERSHIP if you want to see any current reports.
AFTER MARKET UPDATE - FRIDAY, APRIL 23RD, 2021
Previous After Market Report Next After Market Report >>>
|
|
|
|
DOW |
+227.59 |
34,043.49 |
+0.67% |
|
Volume |
778,416,833 |
-10% |
|
Volume |
4,298,655,500 |
-2% |
|
NASDAQ |
+199.31 |
14,017.73 |
+1.44% |
|
Advancers |
2,532 |
78% |
|
Advancers |
3,069 |
74% |
|
S&P 500 |
+45.19 |
4,180.17 |
+1.09% |
|
Decliners |
714 |
22% |
|
Decliners |
1,086 |
26% |
|
Russell 2000 |
+39.24 |
2,271.86 |
+1.76% |
|
52 Wk Highs |
309 |
|
|
52 Wk Highs |
173 |
|
|
S&P 600 |
+24.22 |
1,350.06 |
+1.83% |
|
52 Wk Lows |
14 |
|
|
52 Wk Lows |
30 |
|
|
 |
Major Indices Rose With Positive Breadth and More Leadership
Kenneth J. Gruneisen - Passed the CAN SLIM® Master's Exam
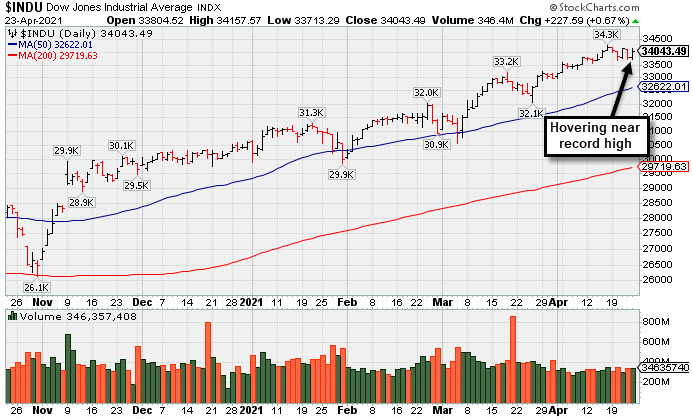
The S&P 500 rallied 1.1%, trimming its weekly decline to just 0.1%. The broad benchmark barely snapped a four-week winning streak that had been its longest such stretch of gains since August. The Nasdaq Composite jumped 1.4%, ending the week just 0.3% lower. The Dow surged 227 points, paring its weekly loss to 0.5%. Small-caps outperformed, with the Russell 2000 soaring 2%, bringing it into positive territory for the week (+0.2%). The volume totals reported were lighter than the prior session on the NYSE and on the Nasdaq exchange, action indicative of lackluster institutional buying demand. Breadth was positive as advancers led decliners by more than a 3-1 margin on the NYSE and nearl7y 3-1 on the Nasdaq exchange. Leadership improved as there were 62 high-ranked companies from the Leaders List that hit new 52-week highs and were listed on the BreakOuts Page, versus the total of 38 on the prior session. New 52-week highs totals expanded and solidly outnumbered new 52-week lows on both the NYSE and the Nasdaq exchange. The major indices (M criteria) are in a confirmed uptrend. Investors are reminded to always make buying and selling decisions on case-by-case basis under the strict criteria and rules of the fact-based investment system.
PICTURED: The Dow Jones Industrial Average is hovering near its record high.
U.S. stocks finished higher on Friday as Wall Street digested a deluge of corporate earnings results and fresh economic data. The major averages staged a sharp comeback from Thursday’s worst sell-off since March, with investors turning jittery on reports that President Biden was considering nearly doubling the capital gains tax on wealthy Americans.
On the data front, a preliminary survey from research firm IHS Markit revealed composite growth in both the U.S. manufacturing and services sectors accelerated at a record pace in April. Separately, new home sales surged 20.7% in March to the highest level since 2006. Treasuries weakened slightly, with the yield on the 10-year note up one basis point to 1.55%. In commodities, WTI crude rebounded 1.2% to $62.15/barrel, helped by a weaker dollar and optimism surrounding European reopenings.
Nine of 11 S&P 500 sectors closed higher, with Financials, Materials, and Information Technology pacing the gains. In earnings, Intel (INTC -5.3%) fell after its CEO warned that the global chip supply shortage could last two more years. Social media company Snap, Inc. (SNAP +7.5%) rose following a better-than-expected user growth metrics. Kimberly-Clark (KMB -5.9%) fell after providing disappointing full-year forecast. |
 Kenneth J. Gruneisen started out as a licensed stockbroker in August 1987, a couple of months prior to the historic stock market crash that took the Dow Jones Industrial Average down -22.6% in a single day. He has published daily fact-based fundamental and technical analysis on high-ranked stocks online for two decades. Through FACTBASEDINVESTING.COM, Kenneth provides educational articles, news, market commentary, and other information regarding proven investment systems that work in good times and bad.
Comments contained in the body of this report are technical opinions only and are not necessarily those of Gruneisen Growth Corp. The material herein has been obtained from sources believed to be reliable and accurate, however, its accuracy and completeness cannot be guaranteed. Our firm, employees, and customers may effect transactions, including transactions contrary to any recommendation herein, or have positions in the securities mentioned herein or options with respect thereto. Any recommendation contained in this report may not be suitable for all investors and it is not to be deemed an offer or solicitation on our part with respect to the purchase or sale of any securities. |
|
 |
Financial, Retail, Tech, and Energy-Linked Groups Rose
Kenneth J. Gruneisen - Passed the CAN SLIM® Master's Exam
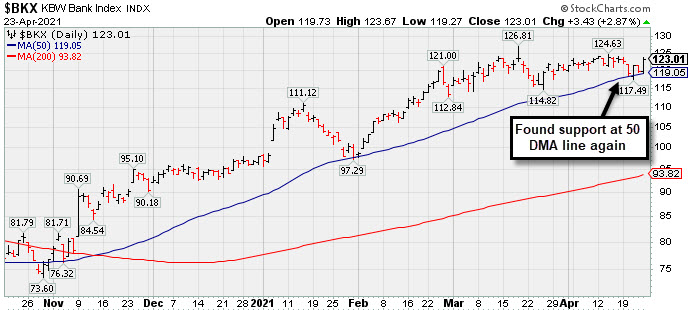
The Bank Index ($BKX +2.87%) and Broker/Dealer Index ($XBD +2.49%) posted solid gains that helped give the major averages a positive bias. The Retail Index ($RLX +0.81%) posted a smaller gain . The tech sector also had a positive bias as the Semiconductor Index ($SOX +2.05%) outpaced the Networking Index ($NWX +1.63%) and the Biotech Index ($BTK +0.43%) followed. The Integrated Oil Index ($XOI +1.13%) and Oil Services Index ($OSX +0.58%) posted modest gains while the Gold & Silver Index ($XAU -0.01%) finished unchanged.
PICTURED: The Bank Index ($BKX +2.87%) posted a solid gain on Friday, finding support again this week at its 50-day moving average (DMA) line.
| Oil Services |
$OSX |
50.13 |
+0.29 |
+0.58% |
+13.08% |
| Integrated Oil |
$XOI |
978.67 |
+10.98 |
+1.13% |
+23.50% |
| Semiconductor |
$SOX |
3,197.49 |
+64.33 |
+2.05% |
+14.38% |
| Networking |
$NWX |
804.43 |
+12.87 |
+1.63% |
+12.18% |
| Broker/Dealer |
$XBD |
459.33 |
+11.18 |
+2.49% |
+21.65% |
| Retail |
$RLX |
3,902.36 |
+31.32 |
+0.81% |
+9.52% |
| Gold & Silver |
$XAU |
148.53 |
-0.02 |
-0.01% |
+3.01% |
| Bank |
$BKX |
123.01 |
+3.43 |
+2.87% |
+25.64% |
| Biotech |
$BTK |
5,630.44 |
+24.29 |
+0.43% |
-1.89% |
|
|
|
 |
Hit New High But Closed Below Pivot Point
Kenneth J. Gruneisen - Passed the CAN SLIM® Master's Exam
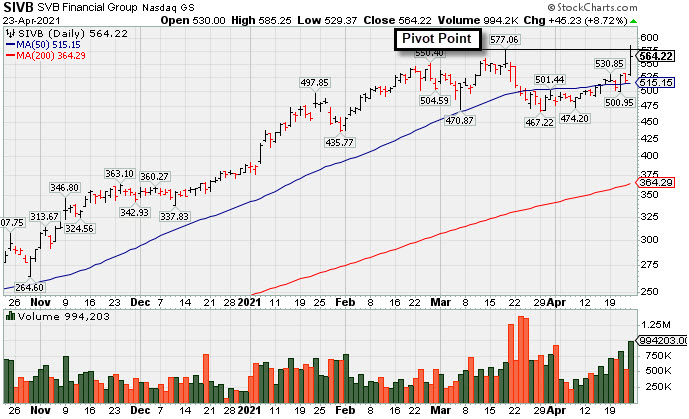
S V B Financial Group (SIVB +$45.23 or +8.72% to $564.22) was highlighted in yellow in the earlier mid-day report (read here) with a pivot point cited based on its 3/18/21 high plus 10 cents. It spiked up to touch a new all-time high with today's volume-driven gain but did not close above the pivot point. Confirming volume-driven gains for new highs may help clinch a proper technical buy signal.
Bullish action came after it reported earnings +293% on +64% sales revenues for the Mar '21 quarter versus the year ago period, its 3rd strong comparison above the +25% minimum guideline (C criteria) of the fact-based investment system's guidelines. It has a great annual earnings history (A criteria).
SIVB completed a new Public Offering on 3/24/21. It went through a deep consolidation and made impressive progress since dropped from the Featured Stocks list on 10/23/18 following its last appearance in this FSU section on 10/11/18 with an annotated graph under the headline, "Weak Action Amid Broader Market Declines".
The number of top-rated funds owning its shares rose from 761 in Mar '17 to 1,634 in Mar '21, a reassuring sign concerning the I criteria. Its current Up/Down Volume ratio of 0.8 is an unbiased indication its shares have been under slight distributional pressure over the past 50 days. It has earned a Timeliness rating of A and a Sponsorship Rating of B. There are only 53.9 million shares outstanding (S criteria) which can contribute to greater price volatility in the event of institutional buying or selling. |
|
|
Color Codes Explained :
Y - Better candidates highlighted by our
staff of experts.
G - Previously featured
in past reports as yellow but may no longer be buyable under the
guidelines.
***Last / Change / Volume data in this table is the closing quote data***
Symbol/Exchange
Company Name
Industry Group |
PRICE |
CHANGE
(%Change) |
Day High |
Volume
(% DAV)
(% 50 day avg vol) |
52 Wk Hi
% From Hi |
Featured
Date |
Price
Featured |
Pivot Featured |
|
Max Buy |
 SIVB
-
NASDAQ
SIVB
-
NASDAQ
S V B Financial Group
BANKING - Regional - Pacific Banks
|
$564.22
|
+45.23
8.72% |
$585.25
|
995,533
186.43% of 50 DAV
50 DAV is 534,000
|
$577.06
-2.23%
|
4/23/2021
|
$579.70
|
PP = $577.16
|
|
MB = $606.02
|
 Most Recent Note - 4/23/2021 5:01:55 PM
Y - Posted a solid gain but did not close above the pivot point cited based on its 3/18/21 high plus 10 cents. Spiked to a new all-time high with today's volume-driven gain. Bullish action came after it reported earnings +293% on +64% sales revenues for the Mar '21 quarter versus the year ago period, its 3rd strong comparison. Completed a new Public Offering on 3/24/21. Went through a deep consolidation and made impressive progress since dropped from the Featured Stocks list on 10/23/18. See the latest FSU analysis for more details.
>>> FEATURED STOCK ARTICLE : Hit New High But Closed Below Pivot Point - 4/23/2021 |
View all notes |
Set NEW NOTE alert |
Company Profile |
SEC
News |
Chart |
Request a new note
C
A
S
I |
CRL
-
NYSE
Charles River Labs Intl
DRUGS - Biotechnology
|
$334.34
|
+6.64
2.03% |
$336.56
|
304,793
93.49% of 50 DAV
50 DAV is 326,000
|
$331.16
0.96%
|
12/17/2020
|
$247.06
|
PP = $257.98
|
|
MB = $270.88
|
Most Recent Note - 4/20/2021 5:32:31 PM
G - There was a "negative reversal" today after hitting new all-time highs with 3 consecutive gains. Its 50 DMA line ($290) acted as support throughout its ongoing ascent. Its Relative Strength Rating is 83, above the 80+ minimum guideline for buy candidates. Dec '20 quarterly earnings rose +19% on +14% sales revenues versus the year ago period, below the +25% minimum earnings guideline (C criteria), raising fundamental concerns.
>>> FEATURED STOCK ARTICLE : Perched at Record High After Rally From 50-Day Moving Average - 4/9/2021 |
View all notes |
Set NEW NOTE alert |
Company Profile |
SEC
News |
Chart |
Request a new note
C
A
S
I |
BRKS
-
NASDAQ
Brooks Automation
ELECTRONICS - Semiconductor Equipment and Mate
|
$102.74
|
+3.64
3.67% |
$103.40
|
743,281
103.38% of 50 DAV
50 DAV is 719,000
|
$104.40
-1.59%
|
4/5/2021
|
$99.31
|
PP = $91.88
|
|
MB = $96.47
|
Most Recent Note - 4/23/2021 5:04:03 PM
G - Posted a 3rd consecutive gain today with average volume for a best-ever close, getting extended from the prior base. Prior highs in the $91 area define initial support to watch above its 50 DMA line ($87.72).
>>> FEATURED STOCK ARTICLE : High Ranked Semiconductor Equipment Firm Powered Higher - 4/7/2021 |
View all notes |
Set NEW NOTE alert |
Company Profile |
SEC
News |
Chart |
Request a new note
C
A
S
I |
ENTG
-
NASDAQ
Entegris Inc
ELECTRONICS - Semiconductor Equipment and Mate
|
$113.15
|
+3.16
2.87% |
$113.48
|
658,661
68.65% of 50 DAV
50 DAV is 959,400
|
$126.41
-10.49%
|
4/1/2021
|
$118.42
|
PP = $110.37
|
|
MB = $115.89
|
Most Recent Note - 4/22/2021 5:13:40 PM
Y - Sputtering near the prior high in the $110 area which defines support to watch above its 50 DMA line ($107.83). More damaging losses would raise concerns and trigger technical sell signals. See the latest FSU analysis for more details and a new annotated graph.
>>> FEATURED STOCK ARTICLE : Negated Recent Breakout and Sputtering Near Prior High - 4/22/2021 |
View all notes |
Set NEW NOTE alert |
Company Profile |
SEC
News |
Chart |
Request a new note
C
A
S
I |
OPY
-
NYSE
Oppenheimer Holdings Inc
FINANCIAL SERVICES - Investment Brokerage - Regiona
|
$47.41
|
+2.36
5.24% |
$47.68
|
114,224
95.99% of 50 DAV
50 DAV is 119,000
|
$46.18
2.66%
|
2/25/2021
|
$38.95
|
PP = $38.11
|
|
MB = $40.02
|
Most Recent Note - 4/23/2021 5:05:23 PM
G - Posted a big gain today with average volume for a new 52-week high. It is extended from any sound base. Its 50 DMA line ($41) and prior low define near-term support to watch on pullbacks.
>>> FEATURED STOCK ARTICLE : Negative Reversal After 7 Consecutive Gains - 4/20/2021 |
View all notes |
Set NEW NOTE alert |
Company Profile |
SEC
News |
Chart |
Request a new note
C
A
S
I |
Symbol/Exchange
Company Name
Industry Group |
PRICE |
CHANGE
(%Change) |
Day High |
Volume
(% DAV)
(% 50 day avg vol) |
52 Wk Hi
% From Hi |
Featured
Date |
Price
Featured |
Pivot Featured |
|
Max Buy |
LAD
-
NYSE
Lithia Motors Inc Cl A
SPECIALTY RETAIL - Auto Dealerships
|
$390.70
|
+8.50
2.22% |
$392.15
|
200,571
67.08% of 50 DAV
50 DAV is 299,000
|
$417.98
-6.53%
|
4/21/2021
|
$377.00
|
PP = $418.08
|
|
MB = $438.98
|
Most Recent Note - 4/21/2021 5:55:20 PM
Y - Finished strong today after highlighted in yellow in the earlier mid-day report with a pivot point cited based on its 3/17/21 high plus 10 cents. Today's volume-driven gain helped it close back above its 50 DMA line ($384) which has acted as support during its ongoing ascent. Subsequent gains above the pivot point backed by at least +40% above average volume may trigger a technical buy signal. Completed a new Public Offering on 9/30/20. Reported earnings +193% on +55% sales revenues for the Mar '21 quarter versus the year ago period, its 3rd consecutive quarterly earnings increases above the +25% minimum (C criteria) guideline with sequential quarters showing acceleration in its sales revenues growth rate. This Medford, Oregon-based Retail/Wholesale - Automobile firm's annual earnings history (A criteria) has been strong and steady after a dramatic downturn in FY '07 and '08 earnings. See the latest FSU analysis for more details and a new annotated graph.
>>> FEATURED STOCK ARTICLE : Building a Base With Rebound Above 50-Day Moving Average - 4/21/2021 |
View all notes |
Set NEW NOTE alert |
Company Profile |
SEC
News |
Chart |
Request a new note
C
A
S
I |
EDUC
-
NASDAQ
Educational Development
WHOLESALE - Basic Materials Wholesale
|
$17.26
|
+0.03
0.17% |
$17.64
|
10,683
39.57% of 50 DAV
50 DAV is 27,000
|
$20.00
-13.70%
|
3/10/2021
|
$17.89
|
PP = $20.10
|
|
MB = $21.11
|
Most Recent Note - 4/21/2021 5:56:20 PM
Y - Volume totals are cooling while still consolidating above its 50 DMA line ($17.02) which defines important near-term support. Met stubborn resistance in the $19-20 area. Subsequent gains above the pivot point backed by at least +40% above average volume are needed to trigger a proper technical buy signal.
>>> FEATURED STOCK ARTICLE : Finding Support During Consolidation Above 50-Day Moving Average - 4/16/2021 |
View all notes |
Set NEW NOTE alert |
Company Profile |
SEC
News |
Chart |
Request a new note
C
A
S
I |
SMPL
-
NASDAQ
Simply Good Foods Co
Food-Confectionery
|
$33.64
|
-0.30
-0.88% |
$34.15
|
564,497
79.39% of 50 DAV
50 DAV is 711,000
|
$35.25
-4.57%
|
12/28/2020
|
$30.40
|
PP = $31.44
|
|
MB = $33.01
|
Most Recent Note - 4/21/2021 6:05:43 PM
G - Posted a quiet gain today, still perched within close striking distance of its 52-week and all-time high with volume totals cooling. Reported Feb '21 quarterly earnings +9% on +2% sales revenues versus the year ago period, below the +25% minimum earnings guideline (C criteria), raising fundamental concerns. Found prompt support near its 50 DMA line ($31) but its current Relative Strength Rating is 78, below the 80+ minimum guideline for buy candidates.
>>> FEATURED STOCK ARTICLE : Perched Near High But Fundamental Concerns Were Raised - 4/14/2021 |
View all notes |
Set NEW NOTE alert |
Company Profile |
SEC
News |
Chart |
Request a new note
C
A
S
I |
IBP
-
NYSE
Installed Building Prod
DIVERSIFIED SERVICES - Business/Management Services
|
$131.13
|
+2.58
2.01% |
$133.30
|
554,228
253.07% of 50 DAV
50 DAV is 219,000
|
$133.23
-1.58%
|
4/19/2021
|
$131.15
|
PP = $130.21
|
|
MB = $136.72
|
Most Recent Note - 4/23/2021 12:41:11 PM
Y - Hovering near its all-time high with today's volume-driven gain. A gain and strong close above its pivot point may help clinch a convincing technical buy signal. Reported earnings +34% on +10% sales revenues for the Dec '20 quarter versus the year-ago period. Three of the past 4 consecutive quarterly comparisons were above the +25% minimum earnings guideline (C criteria). Annual earnings (A criteria) history has been strong.
>>> FEATURED STOCK ARTICLE : Steady Streak of Gains Into New High Territory - 4/19/2021 |
View all notes |
Set NEW NOTE alert |
Company Profile |
SEC
News |
Chart |
Request a new note
C
A
S
I |
QRVO
-
NASDAQ
Qorvo Inc
ELECTRONICS - Semiconductor - Integrated Cir
|
$193.92
|
+6.87
3.67% |
$195.20
|
872,864
72.14% of 50 DAV
50 DAV is 1,210,000
|
$199.94
-3.01%
|
4/1/2021
|
$190.48
|
PP = $191.92
|
|
MB = $201.52
|
Most Recent Note - 4/23/2021 5:08:25 PM
Y - Posted a big gain today with light volume, rising from its 50 DMA line ($180.55). That important short-term average acted as support when it stalled after recently wedging up to new highs from a 9-week base. Its Relative Strength Rating has slumped to 77, below the 80+ minimum for buy candidates.
>>> FEATURED STOCK ARTICLE : Hit Another New High With Even Less Volume Conviction - 4/5/2021 |
View all notes |
Set NEW NOTE alert |
Company Profile |
SEC
News |
Chart |
Request a new note
C
A
S
I |
Symbol/Exchange
Company Name
Industry Group |
PRICE |
CHANGE
(%Change) |
Day High |
Volume
(% DAV)
(% 50 day avg vol) |
52 Wk Hi
% From Hi |
Featured
Date |
Price
Featured |
Pivot Featured |
|
Max Buy |
YETI
-
NYSE
Yeti Holdings Inc
Leisure-Products
|
$87.83
|
+1.99
2.32% |
$89.08
|
1,315,973
91.96% of 50 DAV
50 DAV is 1,431,000
|
$88.88
-1.18%
|
4/6/2021
|
$76.95
|
PP = $79.42
|
|
MB = $83.39
|
Most Recent Note - 4/21/2021 5:58:37 PM
G - Posted a solid gain on lighter volume today. Perched near its all-time high and slightly extended from the latest base. Prior highs in the $80 area define initial support to watch on pullbacks.
>>> FEATURED STOCK ARTICLE : YETI Perched Within Striking Distance of High - 4/7/2021 |
View all notes |
Set NEW NOTE alert |
Company Profile |
SEC
News |
Chart |
Request a new note
C
A
S
I |
DT
-
NYSE
Dynatrace Inc
Computer Sftwr-Enterprse
|
$52.85
|
+1.70
3.32% |
$53.13
|
768,218
36.86% of 50 DAV
50 DAV is 2,084,300
|
$56.94
-7.18%
|
2/4/2021
|
$51.39
|
PP = $48.95
|
|
MB = $51.40
|
Most Recent Note - 4/20/2021 5:36:57 PM
G - Violated its 50 DMA line ($51.52) with today's 3rd consecutive loss on light volume, retreating from near its 52-week high. Only a prompt rebound would help its outlook improve. Recent lows in the $45 area define important near-term support to watch on pullbacks. Its Relative Strength Rating is 66, below the 80+ minimum guideline for buy candidates. Fundamentals remain strong after it reported Dec '20 earnings +70% on +28% sales revenues versus the year ago period.
>>> FEATURED STOCK ARTICLE : Gap Up Rebounding Further Above 50-Day Moving Average - 4/8/2021 |
View all notes |
Set NEW NOTE alert |
Company Profile |
SEC
News |
Chart |
Request a new note
C
A
S
I |
MRBK
-
NASDAQ
Meridian Corp
Banks-Northeast
|
$25.10
|
+0.09
0.36% |
$25.98
|
20,546
57.07% of 50 DAV
50 DAV is 36,000
|
$27.96
-10.23%
|
2/22/2021
|
$25.58
|
PP = $26.10
|
|
MB = $27.41
|
Most Recent Note - 4/20/2021 5:44:59 PM
G - Color code is changed to green after slumping below its 50 DMA line ($25.38) encountering distributional pressure. Undercut the prior low ($24.13 on 3/25/21) by one cent yet recovered from the session low. More damaging losses may trigger technical sell signals. Its Relative Strength Rating is 81, just above the 80+ minimum guideline.
>>> FEATURED STOCK ARTICLE : Encountering Distributional Pressure - 4/12/2021 |
View all notes |
Set NEW NOTE alert |
Company Profile |
SEC
News |
Chart |
Request a new note
C
A
S
I |
|
|
|
THESE ARE NOT BUY RECOMMENDATIONS!
Comments contained in the body of this report are technical
opinions only. The material herein has been obtained
from sources believed to be reliable and accurate, however,
its accuracy and completeness cannot be guaranteed.
This site is not an investment advisor, hence it does
not endorse or recommend any securities or other investments.
Any recommendation contained in this report may not
be suitable for all investors and it is not to be deemed
an offer or solicitation on our part with respect to
the purchase or sale of any securities. All trademarks,
service marks and trade names appearing in this report
are the property of their respective owners, and are
likewise used for identification purposes only.
This report is a service available
only to active Paid Premium Members.
You may opt-out of receiving report notifications
at any time. Questions or comments may be submitted
by writing to Premium Membership Services 665 S.E. 10 Street, Suite 201 Deerfield Beach, FL 33441-5634 or by calling 1-800-965-8307
or 954-785-1121.
|
|
|