You are not logged in.
This means you
CAN ONLY VIEW reports that were published prior to Thursday, March 20, 2025.
You
MUST UPGRADE YOUR MEMBERSHIP if you want to see any current reports.
AFTER MARKET UPDATE - FRIDAY, MAY 7TH, 2021
Previous After Market Report Next After Market Report >>>
|
|
|
|
DOW |
+229.23 |
34,777.76 |
+0.66% |
|
Volume |
871,724,982 |
-13% |
|
Volume |
4,364,792,300 |
-12% |
|
NASDAQ |
+116.81 |
13,749.65 |
+0.86% |
|
Advancers |
2,426 |
74% |
|
Advancers |
2,757 |
67% |
|
S&P 500 |
+30.98 |
4,232.60 |
+0.74% |
|
Decliners |
830 |
25% |
|
Decliners |
1,386 |
33% |
|
Russell 2000 |
+30.21 |
2,271.63 |
+1.35% |
|
52 Wk Highs |
552 |
|
|
52 Wk Highs |
284 |
|
|
S&P 600 |
+12.65 |
1,374.26 |
+0.93% |
|
52 Wk Lows |
23 |
|
|
52 Wk Lows |
69 |
|
|
 |
More Leadership and Breadth Positive but on Lighter Volume
Kenneth J. Gruneisen - Passed the CAN SLIM® Master's Exam
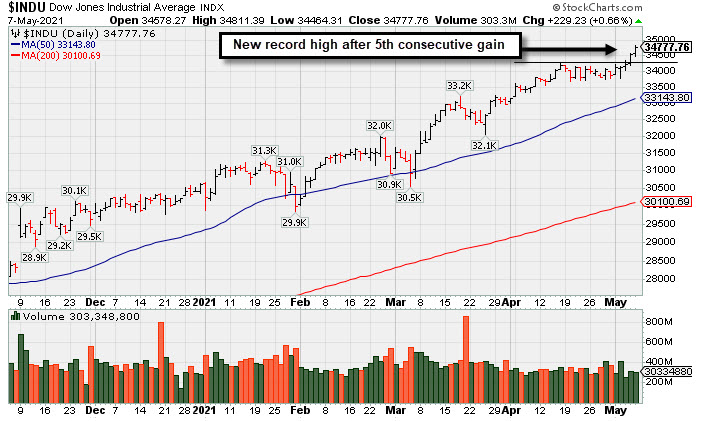
The Dow climbed 229 points to a fresh all-time high, and snapped a two week losing streak with a 2.7% advance. The S&P 500 rose 0.7%, also closing at a new record level and bringing the broad benchmark 1.2% higher on the week. The tech-heavy Nasdaq Composite rallied 0.9%, paring its weekly decline to 1.5%. The volume totals reported were lighter than the prior session on the NYSE and on the Nasdaq exchange, indicative of lackluster institutional buying demand. Breadth was positive as advancers led decliners by almost a 3-1 margin on the NYSE and 2-1 on the Nasdaq exchange. Leadership improved as there were 128 high-ranked companies from the Leaders List that hit new 52-week highs and were listed on the BreakOuts Page, versus the total of 89 on the prior session. New 52-week highs totals expanded and solidly outnumbered shrinking new 52-week lows totals on both the NYSE and the Nasdaq exchange. The major indices (M criteria) are in a confirmed uptrend. Investors are reminded to always make buying and selling decisions on case-by-case basis under the strict criteria and rules of the fact-based investment system.
PICTURED: The Dow Jones Industrial Average hit a new record high with its 5th consecutive gain.
U.S. stocks finished higher on Friday despite a disappointing monthly jobs report. The Labor Department’s release revealed non-farm payrolls rose by just 266,000 in April, far below estimates calling for a 1 million addition and March's downwardly revised 770,000 figure. Equities reacted positively, however, as the weak payrolls print helped alleviate worries that a swift labor market recovery would force the Federal Reserve to tighten monetary policy sooner than expected, and thus remove significant economic stimulus.
Treasuries ended the session little changed, with the yield on the 10-year note steady at 1.57% after briefly dropping as low as 1.48% in an initial response to the jobs number miss. In commodities, WTI crude added 0.2% to $64.85/barrel to cap a second straight weekly gain. Metals also continued their ascent, with copper touching an all-time high and COMEX gold rising 1% to $1,833.00/ounce as a gauge of the U.S. dollar slumped 0.8% to its lowest point since February.
All 11 S&P 500 sectors closed in positive territory, with Energy shares leading the advance to bring the group’s weekly jump to nearly 9%. In earnings, Roku (ROKU +11.55%) surged after easily topping consensus forecasts and providing upbeat revenue guidance. |
 Kenneth J. Gruneisen started out as a licensed stockbroker in August 1987, a couple of months prior to the historic stock market crash that took the Dow Jones Industrial Average down -22.6% in a single day. He has published daily fact-based fundamental and technical analysis on high-ranked stocks online for two decades. Through FACTBASEDINVESTING.COM, Kenneth provides educational articles, news, market commentary, and other information regarding proven investment systems that work in good times and bad.
Comments contained in the body of this report are technical opinions only and are not necessarily those of Gruneisen Growth Corp. The material herein has been obtained from sources believed to be reliable and accurate, however, its accuracy and completeness cannot be guaranteed. Our firm, employees, and customers may effect transactions, including transactions contrary to any recommendation herein, or have positions in the securities mentioned herein or options with respect thereto. Any recommendation contained in this report may not be suitable for all investors and it is not to be deemed an offer or solicitation on our part with respect to the purchase or sale of any securities. |
|
 |
Financial, Retail, Tech, and Commodity-Linked Groups Rose
Kenneth J. Gruneisen - Passed the CAN SLIM® Master's Exam
The Bank Index ($BKX +0.45%), Broker/Dealer Index ($XBD +0.20%), and Retail Index ($RLX +0.26%) each edged higher on Friday. The tech sector had a positive bias as the Networking Index ($NWX +1.88%), Semiconductor Index ($SOX +1.52%), and Biotech Index ($BTK +1.05%) posted unanimous gains. The Oil Services Index ($OSX +5.15%) and Integrated Oil Index ($XOI +2.02%) both outpaced the Gold & Silver Index ($XAU +1.60%), rounding out the widely positive session.
PICTURED: The Biotech Index ($BTK +1.05%) bounced but still closed the week below its 50-day and 200-day moving average (DMA) lines. The Medical - Biomed/Biotech industry group is currently ranked 143 out of 197 industry groups.
| Oil Services |
$OSX |
61.72 |
+3.02 |
+5.15% |
+39.22% |
| Integrated Oil |
$XOI |
1,105.09 |
+21.87 |
+2.02% |
+39.45% |
| Semiconductor |
$SOX |
3,112.74 |
+46.51 |
+1.52% |
+11.35% |
| Networking |
$NWX |
813.29 |
+14.98 |
+1.88% |
+13.41% |
| Broker/Dealer |
$XBD |
466.79 |
+0.92 |
+0.20% |
+23.62% |
| Retail |
$RLX |
3,924.43 |
+10.22 |
+0.26% |
+10.14% |
| Gold & Silver |
$XAU |
156.28 |
+2.46 |
+1.60% |
+8.38% |
| Bank |
$BKX |
132.77 |
+0.60 |
+0.45% |
+35.60% |
| Biotech |
$BTK |
5,535.30 |
+57.43 |
+1.05% |
-3.55% |
|
|
|
 |
Bank Consolidating Near 50 Day Moving Average Line
Kenneth J. Gruneisen - Passed the CAN SLIM® Master's Exam
Meridian Corp (MRBK +$0.07 or +0.25% to $25.83) halted its slide near its 50-day moving average (DMA) line ($25.71) after 5 consecutive small losses. It remains perched within striking distance of its 52-week high. The recent low ($24.01 on 4/21/21) defines important near-term support where any violation may trigger a worrisome technical sell signal. Its Relative Strength Rating is 74, below the 80 minimum guideline, however it is perched only -7.6% off its high.
MRBK reported Mar '21 earnings +323% on +93% sales revenues versus the year ago period, continuing its strong earnings track record. That marked its 4th quarterly earnings increase well above the +25% minimum guideline (C criteria). It was highlighted in yellow with pivot point cited based on its 12/18/21 high plus 10 cents in the 2/22/21 mid-day report (read here). It was last shown in this FSU section on 4/12/21 with an annotated graph under the headline, "Encountering Distributional Pressure".
The thinly-traded company is in the Banks-Northeast industry group which currently has a Group Relative Strength Rating of 87 (A). There are a fair number of other strong leaders (L criteria) in the group. Annual earnings growth (A criteria) has been good since it Nov '17 IPO at $17.
The number of top rated funds that own its shares rose from 30 in Mar '20 to 134 in Mar '21, a reassuring sign concerning the I criteria. The current Up/Down Volume Ratio of 1.0 is an unbiased indication its shares have been neutral concerning accumulation/distribution over the past 50 days. The small supply of only 6.2 million shares outstanding (S criteria) can contribute to greater volatility in the event of institutional buying or selling. |
|
|
Color Codes Explained :
Y - Better candidates highlighted by our
staff of experts.
G - Previously featured
in past reports as yellow but may no longer be buyable under the
guidelines.
***Last / Change / Volume data in this table is the closing quote data***
Symbol/Exchange
Company Name
Industry Group |
PRICE |
CHANGE
(%Change) |
Day High |
Volume
(% DAV)
(% 50 day avg vol) |
52 Wk Hi
% From Hi |
Featured
Date |
Price
Featured |
Pivot Featured |
|
Max Buy |
 SIVB
-
NASDAQ
SIVB
-
NASDAQ
S V B Financial Group
BANKING - Regional - Pacific Banks
|
$587.98
|
+9.02
1.56% |
$589.41
|
329,657
59.18% of 50 DAV
50 DAV is 557,000
|
$586.78
0.20%
|
4/23/2021
|
$579.70
|
PP = $577.16
|
|
MB = $606.02
|
Most Recent Note - 5/5/2021 5:39:19 PM
Y - Posted another gain today with below average volume, wedging higher for a best-ever close. Confirming volume-driven gains are still needed to help clinch a convincing technical buy signal. Bullish action came after it reported earnings +293% on +64% sales revenues for the Mar '21 quarter versus the year ago period, its 3rd strong comparison. Completed a new Public Offering on 3/24/21.
>>> FEATURED STOCK ARTICLE : Hit New High But Closed Below Pivot Point - 4/23/2021 |
View all notes |
Set NEW NOTE alert |
Company Profile |
SEC
News |
Chart |
Request a new note
C
A
S
I |
CROX
-
NASDAQ
Crocs Inc
CONSUMER NON-DURABLES - Textile - Apparel Footwear
|
$108.92
|
+2.75
2.59% |
$109.39
|
1,795,025
132.28% of 50 DAV
50 DAV is 1,357,000
|
$107.75
1.09%
|
4/27/2021
|
$99.81
|
PP = $86.50
|
|
MB = $90.83
|
Most Recent Note - 5/4/2021 5:46:16 PM
G - Hit another new all-time high with today's volume-driven gain, getting very extended from the latest base. Prior highs in the $86 area define initial support to watch on pullbacks.
>>> FEATURED STOCK ARTICLE : Powerful "Breakaway Gap" for CROX - 4/27/2021 |
View all notes |
Set NEW NOTE alert |
Company Profile |
SEC
News |
Chart |
Request a new note
C
A
S
I |
RCKY
-
NASDAQ
Rocky Brands Inc
CONSUMER NON-DURABLES - Textile - Apparel Footwear
|
$65.49
|
+1.04
1.61% |
$66.63
|
122,850
141.21% of 50 DAV
50 DAV is 87,000
|
$69.00
-5.09%
|
5/5/2021
|
$61.65
|
PP = $61.55
|
|
MB = $64.63
|
 Most Recent Note - 5/7/2021 12:58:26 PM
G - Perched at its all-time high today following 2 big volume-driven gains. Prior high in the $61 area defines initial support to watch on pullbacks. Bullish action came after it reported Mar '21 quarterly earnings +341% on +57% sales revenues versus the year ago period, its 3rd strong quarterly comparison. Annual earnings (A criteria) history has been strong since a downturn in FY '16.
>>> FEATURED STOCK ARTICLE : Rocky Brands Powered Higher After Strong Earnings - 5/5/2021 |
View all notes |
Set NEW NOTE alert |
Company Profile |
SEC
News |
Chart |
Request a new note
C
A
S
I |
CRL
-
NYSE
Charles River Labs Intl
DRUGS - Biotechnology
|
$342.55
|
+5.71
1.70% |
$346.51
|
320,491
101.42% of 50 DAV
50 DAV is 316,000
|
$349.13
-1.88%
|
12/17/2020
|
$247.06
|
PP = $257.98
|
|
MB = $270.88
|
Most Recent Note - 5/6/2021 6:06:23 PM
G - Pulled back from its all-time high with today's loss following 2 consecutive volume-driven gains. Very extended from any sound base. Its 50 DMA line ($302) acted as support throughout its ongoing ascent. Reported Mar '21 quarterly earnings +38% on +17%v sales revenues versus the year ago period. Two of the past 3 quarterly comparisons have been above the +25% minimum earnings guideline (C criteria). See the latest FSU analysis for more details and a new annotated graph.
>>> FEATURED STOCK ARTICLE : Pulling Back From Record High Following Strong Quarterly Report - 5/6/2021 |
View all notes |
Set NEW NOTE alert |
Company Profile |
SEC
News |
Chart |
Request a new note
C
A
S
I |
CAMT
-
NASDAQ
Camtek Ltd
ELECTRONICS - Scientific and Technical Instrum
|
$31.02
|
+1.02
3.40% |
$31.61
|
267,033
82.42% of 50 DAV
50 DAV is 324,000
|
$36.14
-14.17%
|
4/28/2021
|
$35.03
|
PP = $35.34
|
|
MB = $37.11
|
Most Recent Note - 5/7/2021 11:58:34 AM
Y - Finding prompt support today near its 50 DMA line ($30.87) after a streak of 6 consecutive losses, action indicative of distributional pressure. Subsequent gains and a strong close above the pivot point backed by at least +40% above average volume are needed to trigger a technical buy signal.
>>> FEATURED STOCK ARTICLE : Earnings Acceleration and Perched at High After Ascending Base - 4/28/2021 |
View all notes |
Set NEW NOTE alert |
Company Profile |
SEC
News |
Chart |
Request a new note
C
A
S
I |
Symbol/Exchange
Company Name
Industry Group |
PRICE |
CHANGE
(%Change) |
Day High |
Volume
(% DAV)
(% 50 day avg vol) |
52 Wk Hi
% From Hi |
Featured
Date |
Price
Featured |
Pivot Featured |
|
Max Buy |
BRKS
-
NASDAQ
Brooks Automation
ELECTRONICS - Semiconductor Equipment and Mate
|
$99.17
|
+4.53
4.79% |
$100.61
|
1,036,995
136.63% of 50 DAV
50 DAV is 759,000
|
$108.72
-8.78%
|
4/5/2021
|
$99.31
|
PP = $91.88
|
|
MB = $96.47
|
Most Recent Note - 5/7/2021 11:54:09 AM
G - Color code is changed to green after rising back above the previously noted "max buy" level. Tested support near prior highs in the $91 area and its 50 DMA line ($90.71). More damaging losses would raise concerns and trigger technical sell signals.
>>> FEATURED STOCK ARTICLE : Extended From Base and Consolidating After Recent Rally - 4/30/2021 |
View all notes |
Set NEW NOTE alert |
Company Profile |
SEC
News |
Chart |
Request a new note
C
A
S
I |
ENTG
-
NASDAQ
Entegris Inc
ELECTRONICS - Semiconductor Equipment and Mate
|
$114.71
|
+3.41
3.06% |
$114.80
|
867,431
95.22% of 50 DAV
50 DAV is 911,000
|
$126.41
-9.26%
|
4/1/2021
|
$118.42
|
PP = $110.37
|
|
MB = $115.89
|
Most Recent Note - 5/4/2021 5:50:12 PM
G - Color code is changed to green after a volume-driven loss today, slumping below the prior high in the $110 area and closing below its 50 DMA line ($109.54). Only a prompt rebound would help its outlook improve.
>>> FEATURED STOCK ARTICLE : Negated Recent Breakout and Sputtering Near Prior High - 4/22/2021 |
View all notes |
Set NEW NOTE alert |
Company Profile |
SEC
News |
Chart |
Request a new note
C
A
S
I |
OPY
-
NYSE
Oppenheimer Holdings Inc
FINANCIAL SERVICES - Investment Brokerage - Regiona
|
$50.95
|
+0.81
1.62% |
$51.22
|
74,704
59.76% of 50 DAV
50 DAV is 125,000
|
$52.45
-2.86%
|
2/25/2021
|
$38.95
|
PP = $38.11
|
|
MB = $40.02
|
Most Recent Note - 5/4/2021 12:40:38 PM
G - Powered higher in recent weeks and it is very extended from any sound base. Bullish action came after it reported Mar '21 quarterly earnings +402% on +59% sales revenues versus the year ago period. Prior high in the $44 area defines initial support to watch above its 50 DMA line ($42.67).
>>> FEATURED STOCK ARTICLE : Negative Reversal After 7 Consecutive Gains - 4/20/2021 |
View all notes |
Set NEW NOTE alert |
Company Profile |
SEC
News |
Chart |
Request a new note
C
A
S
I |
LAD
-
NYSE
Lithia Motors Inc Cl A
SPECIALTY RETAIL - Auto Dealerships
|
$379.93
|
-0.39
-0.10% |
$383.51
|
234,552
77.67% of 50 DAV
50 DAV is 302,000
|
$417.98
-9.10%
|
4/21/2021
|
$377.00
|
PP = $418.08
|
|
MB = $438.98
|
Most Recent Note - 5/5/2021 5:44:36 PM
G - Volume was higher (near average ) as it sputtered to a close below its 50 DMA line ($386) and its color code is changed to green. A prompt rebound above its 50 DMA line is needed for its outlook to improve. Subsequent gains above the pivot point backed by at least +40% above average volume are needed to trigger a technical buy signal.
>>> FEATURED STOCK ARTICLE : Building a Base With Rebound Above 50-Day Moving Average - 4/21/2021 |
View all notes |
Set NEW NOTE alert |
Company Profile |
SEC
News |
Chart |
Request a new note
C
A
S
I |
CLFD
-
NASDAQ
Clearfield Inc
TELECOMMUNICATIONS - Cables / Satalite Equipment
|
$39.09
|
+0.36
0.93% |
$39.59
|
126,122
88.82% of 50 DAV
50 DAV is 142,000
|
$40.26
-2.91%
|
4/26/2021
|
$39.68
|
PP = $38.85
|
|
MB = $40.79
|
Most Recent Note - 5/6/2021 6:12:28 PM
Y - Posted a 4th consecutive gain today with higher volume for its second-best ever close. Fundamentals remain strong after it reported Mar '21 quarterly earnings +440% on +45% sales revenues versus the year ago period, continuing its strong earnings track record.
>>> FEATURED STOCK ARTICLE : Rallied Straight Up From Bottom of 10-Week Base - 4/26/2021 |
View all notes |
Set NEW NOTE alert |
Company Profile |
SEC
News |
Chart |
Request a new note
C
A
S
I |
Symbol/Exchange
Company Name
Industry Group |
PRICE |
CHANGE
(%Change) |
Day High |
Volume
(% DAV)
(% 50 day avg vol) |
52 Wk Hi
% From Hi |
Featured
Date |
Price
Featured |
Pivot Featured |
|
Max Buy |
EDUC
-
NASDAQ
Educational Development
WHOLESALE - Basic Materials Wholesale
|
$17.45
|
+0.49
2.89% |
$17.74
|
3,578
14.31% of 50 DAV
50 DAV is 25,000
|
$20.00
-12.75%
|
3/10/2021
|
$17.89
|
PP = $20.10
|
|
MB = $21.11
|
Most Recent Note - 5/4/2021 5:47:42 PM
Y - Volume totals have been cooling while consolidating above its 50 DMA line ($17.32) which defines important near-term support. Met stubborn resistance in the $19-20 area. Subsequent gains above the pivot point backed by at least +40% above average volume are needed to trigger a proper technical buy signal.
>>> FEATURED STOCK ARTICLE : Finding Support During Consolidation Above 50-Day Moving Average - 4/16/2021 |
View all notes |
Set NEW NOTE alert |
Company Profile |
SEC
News |
Chart |
Request a new note
C
A
S
I |
SMPL
-
NASDAQ
Simply Good Foods Co
Food-Confectionery
|
$34.89
|
+0.10
0.29% |
$35.10
|
466,892
69.07% of 50 DAV
50 DAV is 676,000
|
$35.34
-1.27%
|
12/28/2020
|
$30.40
|
PP = $31.44
|
|
MB = $33.01
|
Most Recent Note - 5/6/2021 6:09:08 PM
G - Still perched at its all-time high, stubbornly holding its ground with volume totals cooling. Reported Feb '21 quarterly earnings +9% on +2% sales revenues versus the year ago period, below the +25% minimum earnings guideline (C criteria), raising fundamental concerns. Its 50 DMA line ($32.11) defines important near-term support to watch on pullbacks. Its current Relative Strength Rating is 80, right at the 80+ minimum guideline for buy candidates.
>>> FEATURED STOCK ARTICLE : Perched Near High But Fundamental Concerns Were Raised - 4/14/2021 |
View all notes |
Set NEW NOTE alert |
Company Profile |
SEC
News |
Chart |
Request a new note
C
A
S
I |
IBP
-
NYSE
Installed Building Prod
DIVERSIFIED SERVICES - Business/Management Services
|
$127.57
|
-10.35
-7.50% |
$128.00
|
845,023
387.63% of 50 DAV
50 DAV is 218,000
|
$140.58
-9.25%
|
4/19/2021
|
$131.15
|
PP = $130.21
|
|
MB = $136.72
|
Most Recent Note - 5/7/2021 12:25:31 PM
G - Reported Mar '21 quarterly earnings +15% on +10% sales revenues versus the year ago period, below the +25% minimum earnings guideline (C criteria) raising fundamental concerns. Gapped down today for a big volume-driven loss slumping below the prior high in the $130 area, raising technical concerns. Its 50 DMA line ($120) defines the next important near-term support level.
>>> FEATURED STOCK ARTICLE : Steady Streak of Gains Into New High Territory - 4/19/2021 |
View all notes |
Set NEW NOTE alert |
Company Profile |
SEC
News |
Chart |
Request a new note
C
A
S
I |
QRVO
-
NASDAQ
"Qorvo, Inc"
ELECTRONICS - Semiconductor - Integrated Cir
|
$184.18
|
-0.51
-0.28% |
$186.69
|
1,609,918
141.87% of 50 DAV
50 DAV is 1,134,800
|
$201.68
-8.68%
|
4/1/2021
|
$190.48
|
PP = $191.92
|
|
MB = $201.52
|
Most Recent Note - 5/6/2021 1:04:00 PM
Y - Reported Mar '21 quarterly earnings +75% on +36% sales revenues versus the year ago period, its 3rd very strong quarterly comparison. Finding support near its 50 DMA line ($183) this week. That important short-term average acted as support when it stalled after recently wedging up to new highs from a 9-week base. Its Relative Strength Rating is 67, below the 80+ minimum for buy candidates, yet it is only -7.3% off its high.
>>> FEATURED STOCK ARTICLE : Quiet Gain For Best Ever Close - 4/29/2021 |
View all notes |
Set NEW NOTE alert |
Company Profile |
SEC
News |
Chart |
Request a new note
C
A
S
I |
YETI
-
NYSE
Yeti Holdings Inc
Leisure-Products
|
$89.78
|
+1.67
1.90% |
$90.54
|
1,016,948
81.49% of 50 DAV
50 DAV is 1,248,000
|
$89.70
0.09%
|
4/6/2021
|
$76.95
|
PP = $79.42
|
|
MB = $83.39
|
Most Recent Note - 5/6/2021 6:11:00 PM
G - Stubbornly holding its ground in a tight range near its all-time high, extended from the latest base. Prior highs in the $80 area define initial support to watch on pullbacks.
>>> FEATURED STOCK ARTICLE : Hovering Near Record High Following Volume-Driven Gains - 5/3/2021 |
View all notes |
Set NEW NOTE alert |
Company Profile |
SEC
News |
Chart |
Request a new note
C
A
S
I |
Symbol/Exchange
Company Name
Industry Group |
PRICE |
CHANGE
(%Change) |
Day High |
Volume
(% DAV)
(% 50 day avg vol) |
52 Wk Hi
% From Hi |
Featured
Date |
Price
Featured |
Pivot Featured |
|
Max Buy |
MRBK
-
NASDAQ
Meridian Corp
Banks-Northeast
|
$25.83
|
+0.07
0.25% |
$25.99
|
25,269
69.04% of 50 DAV
50 DAV is 36,600
|
$27.96
-7.62%
|
2/22/2021
|
$25.58
|
PP = $26.10
|
|
MB = $27.41
|
Most Recent Note - 5/7/2021 5:40:40 PM
Y - Posted a small gain today halting its slide after 5 consecutive small losses. Consolidating near its 50 DMA line ($25.83), still perched only -7.6% off its 52-week high. Reported Mar '21 earnings +323% on +93% sales revenues versus the year ago period, continuing its strong earnings track record. Recent low ($24.01 on 4/21/21) defines important near-term support where any violation may trigger a worrisome technical sell signal. Its Relative Strength Rating is 74, below the 80 minimum guideline. See the latest FSU analysis for more details and a new annotated graph.
>>> FEATURED STOCK ARTICLE : Encountering Distributional Pressure - 4/12/2021 |
View all notes |
Set NEW NOTE alert |
Company Profile |
SEC
News |
Chart |
Request a new note
C
A
S
I |
|
|
|
THESE ARE NOT BUY RECOMMENDATIONS!
Comments contained in the body of this report are technical
opinions only. The material herein has been obtained
from sources believed to be reliable and accurate, however,
its accuracy and completeness cannot be guaranteed.
This site is not an investment advisor, hence it does
not endorse or recommend any securities or other investments.
Any recommendation contained in this report may not
be suitable for all investors and it is not to be deemed
an offer or solicitation on our part with respect to
the purchase or sale of any securities. All trademarks,
service marks and trade names appearing in this report
are the property of their respective owners, and are
likewise used for identification purposes only.
This report is a service available
only to active Paid Premium Members.
You may opt-out of receiving report notifications
at any time. Questions or comments may be submitted
by writing to Premium Membership Services 665 S.E. 10 Street, Suite 201 Deerfield Beach, FL 33441-5634 or by calling 1-800-965-8307
or 954-785-1121.
|
|
|