You are not logged in.
This means you
CAN ONLY VIEW reports that were published prior to Thursday, March 20, 2025.
You
MUST UPGRADE YOUR MEMBERSHIP if you want to see any current reports.
AFTER MARKET UPDATE - TUESDAY, MAY 11TH, 2021
Previous After Market Report Next After Market Report >>>
|
|
|
|
DOW |
-473.66 |
34,269.16 |
-1.36% |
|
Volume |
994,470,563 |
-0% |
|
Volume |
4,697,937,500 |
-1% |
|
NASDAQ |
-7.78 |
13,394.08 |
-0.06% |
|
Advancers |
874 |
26% |
|
Advancers |
1,613 |
39% |
|
S&P 500 |
-36.33 |
4,152.10 |
-0.87% |
|
Decliners |
2,427 |
74% |
|
Decliners |
2,516 |
61% |
|
Russell 2000 |
-5.71 |
2,206.99 |
-0.26% |
|
52 Wk Highs |
75 |
|
|
52 Wk Highs |
38 |
|
|
S&P 600 |
-7.08 |
1,337.38 |
-0.53% |
|
52 Wk Lows |
95 |
|
|
52 Wk Lows |
232 |
|
|
 |
Leadership Abruptly Thinned as Major Indices Slumped
Kenneth J. Gruneisen - Passed the CAN SLIM® Master's Exam
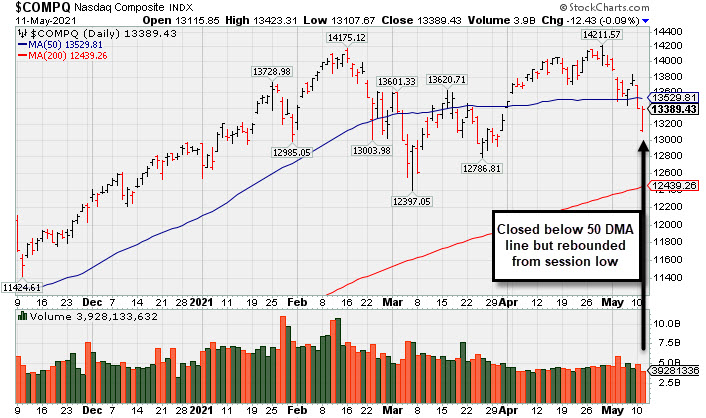
Both the Dow and S&P 500 extended declines from their record levels reached on Friday, shedding 473 points and 0.9%, respectively. The 30-stock index saw its worst session since February, while the S&P 500 capped its steepest two-day drop since March. The Nasdaq Composite slipped 0.1%, paring a more than 2% decline as some investors seemed to “buy the dip.” The volume totals reported were lighter than the prior session on the NYSE and on the Nasdaq exchange, indicative of less institutional selling pressure. Breadth was negative as decliners led advancers by almost a 3-1 margin on the NYSE and 5-3 on the Nasdaq exchange. There were only 10 high-ranked companies from the Leaders List that hit new 52-week highs and were listed on the BreakOuts Page, down abruptly from the total of 171 on the prior session. New 52-week highs totals contracted and they were outnumbered by new 52-week lows on both the NYSE and the Nasdaq exchange. The major indices (M criteria) are in a confirmed uptrend. Investors are reminded to always make buying and selling decisions on case-by-case basis under the strict criteria and rules of the fact-based investment system.
PICTURED: The Nasdaq Composite Index rebounded from the session's early low but still closed below its 50-day moving average (DMA) line.
U.S. stocks retreated for a second session on Tuesday, as an early sell-off in tech and growth-oriented stocks permeated into cyclical and value-oriented shares. Rising inflation worries remained front of mind, as investors digested the latest update on the labor market and a continued upward trajectory of commodity prices.
On the data front, the Jobs Openings and Labor Turnover Survey (JOLTS) showed a record high 8.1 million available positions in March, well above forecasts and February’s 7.5 million figure. Meanwhile, the NFIB small business index improved to a five-month high, although a record share of respondents (44%) noted difficulty in filling jobs. Despite the equity sell-off, COMEX gold slipped 0.1% to $1836.00/ounce, while Treasuries weakened, with the yield on the 10-year note up three basis points to 1.62%.
Ten of 11 S&P 500 sectors ended in negative territory, with the Materials group the lone advancer. Energy lagged despite WTI crude climbing 0.7% $65.35/barrel. A recent sell-off in chipmakers eased, but the Philadelphia Semiconductor Index closed in correction territory for a second day, falling more than 10% from its recent April 5 peak. Elsewhere, the CBOE volatility Index, Wall Street’s so-called “fear gauge,” climbed above 20 for the first time in two months. |
 Kenneth J. Gruneisen started out as a licensed stockbroker in August 1987, a couple of months prior to the historic stock market crash that took the Dow Jones Industrial Average down -22.6% in a single day. He has published daily fact-based fundamental and technical analysis on high-ranked stocks online for two decades. Through FACTBASEDINVESTING.COM, Kenneth provides educational articles, news, market commentary, and other information regarding proven investment systems that work in good times and bad.
Comments contained in the body of this report are technical opinions only and are not necessarily those of Gruneisen Growth Corp. The material herein has been obtained from sources believed to be reliable and accurate, however, its accuracy and completeness cannot be guaranteed. Our firm, employees, and customers may effect transactions, including transactions contrary to any recommendation herein, or have positions in the securities mentioned herein or options with respect thereto. Any recommendation contained in this report may not be suitable for all investors and it is not to be deemed an offer or solicitation on our part with respect to the purchase or sale of any securities. |
|
 |
Gold & Silver, Semiconductor, and Biotech Indexes Rose
Kenneth J. Gruneisen - Passed the CAN SLIM® Master's Exam
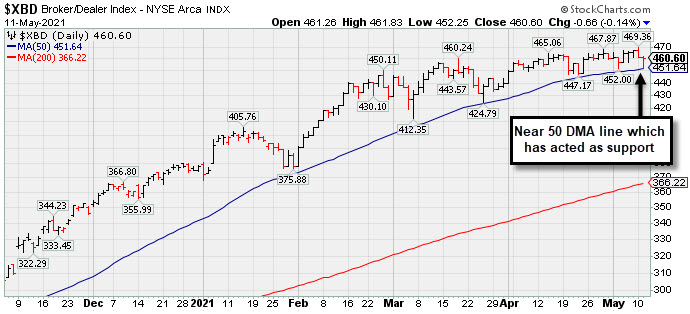
The Retail Index ($RLX -0.51%) and Bank Index ($BKX -1.13%) both lost ground while the Broker/Dealer Index ($XBD -0.14%) did a better job of holding its ground. The Semiconductor Index ($SOX +0.31%) and Biotech Index ($BTK +0.42%) both posted modest gains, but the Networking Index ($NWX -0.42%) edged lower. Commodity-linked groups were mixed as the Gold & Silver Index ($XAU +1.56%) rose while the Oil Services Index ($OSX -0.06%) finished flat and the Integrated Oil Index ($XOI -2.44%) slumped.
PICTURED: The Broker/Dealer Index ($XBD -0.14%) is consolidating just above its 50-day moving average (DMA) line which has acted as support.
| Oil Services |
$OSX |
59.85 |
-0.03 |
-0.06% |
+35.02% |
| Integrated Oil |
$XOI |
1,074.91 |
-26.89 |
-2.44% |
+35.64% |
| Semiconductor |
$SOX |
2,976.17 |
+9.06 |
+0.31% |
+6.46% |
| Networking |
$NWX |
796.63 |
-3.36 |
-0.42% |
+11.09% |
| Broker/Dealer |
$XBD |
460.60 |
-0.66 |
-0.14% |
+21.98% |
| Retail |
$RLX |
3,845.53 |
-19.57 |
-0.51% |
+7.92% |
| Gold & Silver |
$XAU |
157.14 |
+2.42 |
+1.56% |
+8.98% |
| Bank |
$BKX |
130.97 |
-1.49 |
-1.13% |
+33.77% |
| Biotech |
$BTK |
5,463.58 |
+22.83 |
+0.42% |
-4.80% |
|
|
|
 |
Held Ground Following Breakout Gain on Prior Session
Kenneth J. Gruneisen - Passed the CAN SLIM® Master's Exam
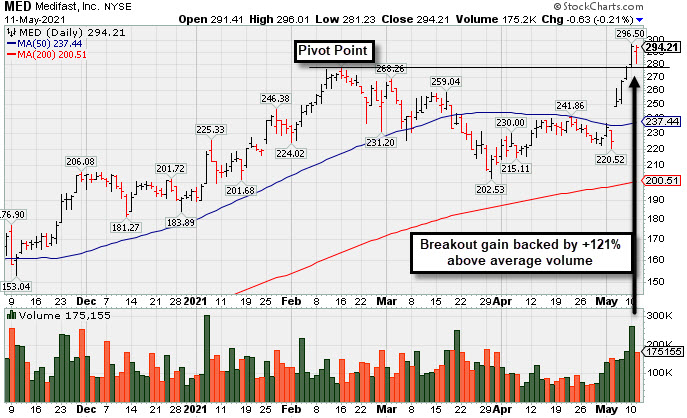
Medifast Inc (MED -$0.63 or -0.21% to $294.21) held its ground today after highlighted in yellow in the earlier mid-day report (read here) with pivot point cited based on its 2/16/21 high plus 10 cents. It just powered to new 52-week highs with 4 consecutive volume-driven gains and faces no resistance due to overhead supply. It triggered a technical buy signal on the prior session with a big gain backed by +121% above average volume.
Recently it reported Mar '21 quarterly earnings +79% on +91% sales revenues versus the year ago period, marking its 3rd consecutive quarterly comparison above the +25% minimum guideline (C criteria), helping it better match with winning models of the fact-based investment system. Annual earnings (A criteria) history has been strong.
The Cosmetics - Personal Care firm has only 11.8 million shares outstanding )S criteria) which can contribute to greater price volatility in the event of institutional buying or selling. The number of top-rated funds owning its shares rose from 425 in Jun '20 to 529 in Mar '21, a reassuring sign concerning the I criteria. Its current Up/Down Volume Ratio of 1.4 is an unbiased indication its shares have been under accumulation over the past 50 days.
|
|
|
Color Codes Explained :
Y - Better candidates highlighted by our
staff of experts.
G - Previously featured
in past reports as yellow but may no longer be buyable under the
guidelines.
***Last / Change / Volume data in this table is the closing quote data***
Symbol/Exchange
Company Name
Industry Group |
PRICE |
CHANGE
(%Change) |
Day High |
Volume
(% DAV)
(% 50 day avg vol) |
52 Wk Hi
% From Hi |
Featured
Date |
Price
Featured |
Pivot Featured |
|
Max Buy |
 SIVB
-
NASDAQ
SIVB
-
NASDAQ
S V B Financial Group
BANKING - Regional - Pacific Banks
|
$583.90
|
+8.00
1.39% |
$586.39
|
584,377
105.10% of 50 DAV
50 DAV is 556,000
|
$592.34
-1.42%
|
4/23/2021
|
$579.70
|
PP = $577.16
|
|
MB = $606.02
|
 Most Recent Note - 5/11/2021 5:14:38 PM
Y - Perched near its high, it posted another gain today with average volume. Confirming volume-driven gains are still needed to help clinch a convincing technical buy signal. Bullish action came after it reported earnings +293% on +64% sales revenues for the Mar '21 quarter versus the year ago period, its 3rd strong comparison. Completed a new Public Offering on 3/24/21.
>>> FEATURED STOCK ARTICLE : Hit New High But Closed Below Pivot Point - 4/23/2021 |
View all notes |
Set NEW NOTE alert |
Company Profile |
SEC
News |
Chart |
Request a new note
C
A
S
I |
CROX
-
NASDAQ
Crocs Inc
CONSUMER NON-DURABLES - Textile - Apparel Footwear
|
$104.17
|
-0.06
-0.06% |
$105.49
|
1,254,468
90.58% of 50 DAV
50 DAV is 1,385,000
|
$109.91
-5.22%
|
4/27/2021
|
$99.81
|
PP = $86.50
|
|
MB = $90.83
|
Most Recent Note - 5/10/2021 2:57:32 PM
G - Reversed into the red today after hitting yet another new all-time high. A spurt of volume-driven gains has it very extended from the latest base. Prior highs in the $86 area define initial support to watch on pullbacks.
>>> FEATURED STOCK ARTICLE : Powerful "Breakaway Gap" for CROX - 4/27/2021 |
View all notes |
Set NEW NOTE alert |
Company Profile |
SEC
News |
Chart |
Request a new note
C
A
S
I |
RCKY
-
NASDAQ
Rocky Brands Inc
CONSUMER NON-DURABLES - Textile - Apparel Footwear
|
$60.36
|
-2.72
-4.31% |
$61.99
|
101,827
115.71% of 50 DAV
50 DAV is 88,000
|
$69.00
-12.52%
|
5/5/2021
|
$61.65
|
PP = $61.55
|
|
MB = $64.63
|
Most Recent Note - 5/10/2021 2:54:39 PM
G - Abruptly pulling back from its all-time high with today's big loss following 3 big volume-driven gains, testing the prior high in the $61 area that defines initial support to watch. Bullish action came after it reported Mar '21 quarterly earnings +341% on +57% sales revenues versus the year ago period, its 3rd strong quarterly comparison. Annual earnings (A criteria) history has been strong since a downturn in FY '16.
>>> FEATURED STOCK ARTICLE : Rocky Brands Powered Higher After Strong Earnings - 5/5/2021 |
View all notes |
Set NEW NOTE alert |
Company Profile |
SEC
News |
Chart |
Request a new note
C
A
S
I |
CRL
-
NYSE
Charles River Labs Intl
DRUGS - Biotechnology
|
$320.50
|
-12.38
-3.72% |
$324.08
|
984,961
305.89% of 50 DAV
50 DAV is 322,000
|
$349.13
-8.20%
|
12/17/2020
|
$247.06
|
PP = $257.98
|
|
MB = $270.88
|
Most Recent Note - 5/11/2021 12:41:44 PM
G - Very extended from any sound base, it gapped down today, retreating from its all-time high with today's 3rd volume-driven loss in the span of 4 sessions. Its 50 DMA line ($305) defines near-term support above the prior high ($303). Reported Mar '21 quarterly earnings +38% on +17%v sales revenues versus the year ago period. Two of the past 3 quarterly comparisons have been above the +25% minimum earnings guideline (C criteria).
>>> FEATURED STOCK ARTICLE : Pulling Back From Record High Following Strong Quarterly Report - 5/6/2021 |
View all notes |
Set NEW NOTE alert |
Company Profile |
SEC
News |
Chart |
Request a new note
C
A
S
I |
CAMT
-
NASDAQ
Camtek Ltd
ELECTRONICS - Scientific and Technical Instrum
|
$28.90
|
-0.73
-2.46% |
$29.30
|
324,931
99.67% of 50 DAV
50 DAV is 326,000
|
$36.14
-20.03%
|
4/28/2021
|
$35.03
|
PP = $35.34
|
|
MB = $37.11
|
Most Recent Note - 5/7/2021 11:58:34 AM
Y - Finding prompt support today near its 50 DMA line ($30.87) after a streak of 6 consecutive losses, action indicative of distributional pressure. Subsequent gains and a strong close above the pivot point backed by at least +40% above average volume are needed to trigger a technical buy signal.
>>> FEATURED STOCK ARTICLE : Earnings Acceleration and Perched at High After Ascending Base - 4/28/2021 |
View all notes |
Set NEW NOTE alert |
Company Profile |
SEC
News |
Chart |
Request a new note
C
A
S
I |
Symbol/Exchange
Company Name
Industry Group |
PRICE |
CHANGE
(%Change) |
Day High |
Volume
(% DAV)
(% 50 day avg vol) |
52 Wk Hi
% From Hi |
Featured
Date |
Price
Featured |
Pivot Featured |
|
Max Buy |
BRKS
-
NASDAQ
Brooks Automation
ELECTRONICS - Semiconductor Equipment and Mate
|
$91.97
|
+2.53
2.83% |
$95.75
|
1,610,582
206.48% of 50 DAV
50 DAV is 780,000
|
$108.72
-15.41%
|
4/5/2021
|
$99.31
|
PP = $91.88
|
|
MB = $96.47
|
Most Recent Note - 5/11/2021 12:37:04 PM
G - Halting its slide with today's gain, finding prompt support after violating prior highs in the $91 area and also undercutting its 50 DMA line ($90.93). More damaging losses would raise greater concerns.
>>> FEATURED STOCK ARTICLE : Extended From Base and Consolidating After Recent Rally - 4/30/2021 |
View all notes |
Set NEW NOTE alert |
Company Profile |
SEC
News |
Chart |
Request a new note
C
A
S
I |
ENTG
-
NASDAQ
Entegris Inc
ELECTRONICS - Semiconductor Equipment and Mate
|
$109.19
|
+0.99
0.91% |
$109.44
|
1,262,042
137.19% of 50 DAV
50 DAV is 919,900
|
$126.41
-13.62%
|
4/1/2021
|
$118.42
|
PP = $110.37
|
|
MB = $115.89
|
Most Recent Note - 5/10/2021 2:46:08 PM
G - Big volume-driven loss today has it again slumping below the prior high in the $110 area and below its 50 DMA line, raising concerns. Only a prompt rebound would help its outlook improve.
>>> FEATURED STOCK ARTICLE : Negated Recent Breakout and Sputtering Near Prior High - 4/22/2021 |
View all notes |
Set NEW NOTE alert |
Company Profile |
SEC
News |
Chart |
Request a new note
C
A
S
I |
OPY
-
NYSE
Oppenheimer Holdings Inc
FINANCIAL SERVICES - Investment Brokerage - Regiona
|
$50.10
|
-0.90
-1.76% |
$51.00
|
129,956
108.30% of 50 DAV
50 DAV is 120,000
|
$52.45
-4.48%
|
2/25/2021
|
$38.95
|
PP = $38.11
|
|
MB = $40.02
|
Most Recent Note - 5/10/2021 6:28:26 PM
G - Hovering near its all-time high, very extended from any sound base. Bullish action came after it reported Mar '21 quarterly earnings +402% on +59% sales revenues versus the year ago period. Prior high in the $44 area defines initial support to watch above its 50 DMA line ($43.69).
>>> FEATURED STOCK ARTICLE : Negative Reversal After 7 Consecutive Gains - 4/20/2021 |
View all notes |
Set NEW NOTE alert |
Company Profile |
SEC
News |
Chart |
Request a new note
C
A
S
I |
LAD
-
NYSE
Lithia Motors Inc Cl A
SPECIALTY RETAIL - Auto Dealerships
|
$365.73
|
-3.35
-0.91% |
$369.43
|
257,717
85.91% of 50 DAV
50 DAV is 300,000
|
$417.98
-12.50%
|
4/21/2021
|
$377.00
|
PP = $418.08
|
|
MB = $438.98
|
Most Recent Note - 5/11/2021 5:13:05 PM
G - Slumped further below its 50 DMA line ($386) with today's 6th consecutive loss. A prompt rebound above its 50 DMA line is needed for its outlook to improve. Subsequent gains above the pivot point backed by at least +40% above average volume are needed to trigger a technical buy signal.
>>> FEATURED STOCK ARTICLE : Building a Base With Rebound Above 50-Day Moving Average - 4/21/2021 |
View all notes |
Set NEW NOTE alert |
Company Profile |
SEC
News |
Chart |
Request a new note
C
A
S
I |
MED
-
NYSE
Medifast Inc
SPECIALTY RETAIL - Specialty Retail, Other
|
$294.21
|
-0.63
-0.21% |
$296.01
|
175,155
145.96% of 50 DAV
50 DAV is 120,000
|
$296.50
-0.77%
|
5/11/2021
|
$285.72
|
PP = $279.56
|
|
MB = $293.54
|
Most Recent Note - 5/11/2021 5:11:36 PM
Y - Held its ground today after highlighted in yellow with pivot point cited based on its 2/16/21 high plus 10 cents. Faces no resistance due to overhead supply after triggering a technical buy signal on the prior session with a big gain backed by +121% above average volume. Reported Mar '21 quarterly earnings +79% on +91% sales revenues versus the year ago period, marking its 3rd consecutive quarterly comparison above the +25% minimum guideline (C criteria). Annual earnings (A criteria) history has been strong. See the latest FSU analysis for more details and a new annotated graph.
>>> FEATURED STOCK ARTICLE : Held Ground Following Breakout Gain on Prior Session - 5/11/2021 |
View all notes |
Set NEW NOTE alert |
Company Profile |
SEC
News |
Chart |
Request a new note
C
A
S
I |
Symbol/Exchange
Company Name
Industry Group |
PRICE |
CHANGE
(%Change) |
Day High |
Volume
(% DAV)
(% 50 day avg vol) |
52 Wk Hi
% From Hi |
Featured
Date |
Price
Featured |
Pivot Featured |
|
Max Buy |
CLFD
-
NASDAQ
Clearfield Inc
TELECOMMUNICATIONS - Cables / Satalite Equipment
|
$35.47
|
-0.13
-0.37% |
$35.86
|
114,208
80.43% of 50 DAV
50 DAV is 142,000
|
$40.26
-11.90%
|
4/26/2021
|
$39.68
|
PP = $38.85
|
|
MB = $40.79
|
Most Recent Note - 5/10/2021 2:43:31 PM
Y - Pulling back abruptly today following 5 consecutive gains. Fundamentals remain strong after it reported Mar '21 quarterly earnings +440% on +45% sales revenues versus the year ago period, continuing its strong earnings track record.
>>> FEATURED STOCK ARTICLE : Rallied Straight Up From Bottom of 10-Week Base - 4/26/2021 |
View all notes |
Set NEW NOTE alert |
Company Profile |
SEC
News |
Chart |
Request a new note
C
A
S
I |
EDUC
-
NASDAQ
Educational Development
WHOLESALE - Basic Materials Wholesale
|
$16.70
|
+0.09
0.54% |
$16.90
|
37,798
151.19% of 50 DAV
50 DAV is 25,000
|
$20.00
-16.50%
|
3/10/2021
|
$17.89
|
PP = $20.10
|
|
MB = $21.11
|
Most Recent Note - 5/10/2021 2:59:32 PM
G - Color code is changed to green after sputtering below its 50 DMA line ($17.43). A rebound above the 50 DMA line is needed for its outlook to improve. Met stubborn resistance in the $19-20 area. Subsequent gains above the pivot point backed by at least +40% above average volume are needed to trigger a proper technical buy signal.
>>> FEATURED STOCK ARTICLE : Finding Support During Consolidation Above 50-Day Moving Average - 4/16/2021 |
View all notes |
Set NEW NOTE alert |
Company Profile |
SEC
News |
Chart |
Request a new note
C
A
S
I |
SMPL
-
NASDAQ
Simply Good Foods Co
Food-Confectionery
|
$34.18
|
-0.27
-0.78% |
$34.66
|
290,889
43.49% of 50 DAV
50 DAV is 668,900
|
$35.34
-3.28%
|
12/28/2020
|
$30.40
|
PP = $31.44
|
|
MB = $33.01
|
Most Recent Note - 5/10/2021 6:27:13 PM
G - Still quietly perched near its all-time high, stubbornly holding its ground with volume totals cooling. Reported Feb '21 quarterly earnings +9% on +2% sales revenues versus the year ago period, below the +25% minimum earnings guideline (C criteria), raising fundamental concerns. Its 50 DMA line ($32.33) defines important near-term support to watch on pullbacks. Its current Relative Strength Rating is 78, below the 80+ minimum guideline for buy candidates. See the latest FSU analysis for more details and a new annotated graph.
>>> FEATURED STOCK ARTICLE : Hovering Near All-Time High Following Lackluster Quarter - 5/10/2021 |
View all notes |
Set NEW NOTE alert |
Company Profile |
SEC
News |
Chart |
Request a new note
C
A
S
I |
IBP
-
NYSE
Installed Building Prod
DIVERSIFIED SERVICES - Business/Management Services
|
$122.25
|
-6.32
-4.92% |
$125.91
|
538,191
230.98% of 50 DAV
50 DAV is 233,000
|
$140.58
-13.04%
|
4/19/2021
|
$131.15
|
PP = $130.21
|
|
MB = $136.72
|
Most Recent Note - 5/10/2021 12:45:28 PM
G - Showing resilience today, rebounding near the prior high in the $130 area after slumping into the prior base. Gapped down on 5/07/21 for a big volume-driven loss, raising technical concerns. Its 50 DMA line ($120) defines the next important near-term support level. Weak action came after it reported Mar '21 quarterly earnings +15% on +10% sales revenues versus the year ago period, below the +25% minimum earnings guideline (C criteria) raising fundamental concerns.
>>> FEATURED STOCK ARTICLE : Steady Streak of Gains Into New High Territory - 4/19/2021 |
View all notes |
Set NEW NOTE alert |
Company Profile |
SEC
News |
Chart |
Request a new note
C
A
S
I |
QRVO
-
NASDAQ
"Qorvo, Inc"
ELECTRONICS - Semiconductor - Integrated Cir
|
$172.01
|
+0.54
0.31% |
$172.18
|
2,326,687
195.26% of 50 DAV
50 DAV is 1,191,600
|
$201.68
-14.71%
|
4/1/2021
|
$190.48
|
PP = $191.92
|
|
MB = $201.52
|
Most Recent Note - 5/10/2021 2:50:08 PM
G - Color code is changed to green after gapping down today violating its 50 DMA line ($183.60) and undercutting the prior low with a damaging volume-driven loss triggering a technical sell signal. Reported Mar '21 quarterly earnings +75% on +36% sales revenues versus the year ago period, its 3rd very strong quarterly comparison. It stalled after recently wedging up to new highs from a 9-week base. Its Relative Strength Rating is 69, below the 80+ minimum for buy candidates.
>>> FEATURED STOCK ARTICLE : Quiet Gain For Best Ever Close - 4/29/2021 |
View all notes |
Set NEW NOTE alert |
Company Profile |
SEC
News |
Chart |
Request a new note
C
A
S
I |
Symbol/Exchange
Company Name
Industry Group |
PRICE |
CHANGE
(%Change) |
Day High |
Volume
(% DAV)
(% 50 day avg vol) |
52 Wk Hi
% From Hi |
Featured
Date |
Price
Featured |
Pivot Featured |
|
Max Buy |
YETI
-
NYSE
Yeti Holdings Inc
Leisure-Products
|
$87.53
|
-0.69
-0.78% |
$88.09
|
1,733,153
139.77% of 50 DAV
50 DAV is 1,240,000
|
$90.65
-3.44%
|
4/6/2021
|
$76.95
|
PP = $79.42
|
|
MB = $83.39
|
Most Recent Note - 5/11/2021 5:16:24 PM
G - Pulling back from its all-time high after getting extended from the latest base. Prior highs in the $80 area define initial support to watch on pullbacks above its 50 DMA line ($78.20).
>>> FEATURED STOCK ARTICLE : Hovering Near Record High Following Volume-Driven Gains - 5/3/2021 |
View all notes |
Set NEW NOTE alert |
Company Profile |
SEC
News |
Chart |
Request a new note
C
A
S
I |
MRBK
-
NASDAQ
Meridian Corp
Banks-Northeast
|
$25.82
|
-0.22
-0.84% |
$26.40
|
32,347
91.12% of 50 DAV
50 DAV is 35,500
|
$27.96
-7.65%
|
2/22/2021
|
$25.58
|
PP = $26.10
|
|
MB = $27.41
|
Most Recent Note - 5/7/2021 5:40:40 PM
Y - Posted a small gain today halting its slide after 5 consecutive small losses. Consolidating near its 50 DMA line ($25.83), still perched only -7.6% off its 52-week high. Reported Mar '21 earnings +323% on +93% sales revenues versus the year ago period, continuing its strong earnings track record. Recent low ($24.01 on 4/21/21) defines important near-term support where any violation may trigger a worrisome technical sell signal. Its Relative Strength Rating is 74, below the 80 minimum guideline. See the latest FSU analysis for more details and a new annotated graph.
>>> FEATURED STOCK ARTICLE : Bank Consolidating Near 50 Day Moving Average Line - 5/7/2021 |
View all notes |
Set NEW NOTE alert |
Company Profile |
SEC
News |
Chart |
Request a new note
C
A
S
I |
|
|
|
THESE ARE NOT BUY RECOMMENDATIONS!
Comments contained in the body of this report are technical
opinions only. The material herein has been obtained
from sources believed to be reliable and accurate, however,
its accuracy and completeness cannot be guaranteed.
This site is not an investment advisor, hence it does
not endorse or recommend any securities or other investments.
Any recommendation contained in this report may not
be suitable for all investors and it is not to be deemed
an offer or solicitation on our part with respect to
the purchase or sale of any securities. All trademarks,
service marks and trade names appearing in this report
are the property of their respective owners, and are
likewise used for identification purposes only.
This report is a service available
only to active Paid Premium Members.
You may opt-out of receiving report notifications
at any time. Questions or comments may be submitted
by writing to Premium Membership Services 665 S.E. 10 Street, Suite 201 Deerfield Beach, FL 33441-5634 or by calling 1-800-965-8307
or 954-785-1121.
|
|
|