You are not logged in.
This means you
CAN ONLY VIEW reports that were published prior to Thursday, March 20, 2025.
You
MUST UPGRADE YOUR MEMBERSHIP if you want to see any current reports.
AFTER MARKET UPDATE - MONDAY, MAY 10TH, 2021
Previous After Market Report Next After Market Report >>>
|
|
|
|
DOW |
-34.94 |
34,742.82 |
-0.10% |
|
Volume |
998,169,327 |
+15% |
|
Volume |
4,761,158,600 |
+9% |
|
NASDAQ |
-345.75 |
13,406.49 |
-2.51% |
|
Advancers |
1,072 |
32% |
|
Advancers |
1,015 |
25% |
|
S&P 500 |
-44.17 |
4,188.43 |
-1.04% |
|
Decliners |
2,235 |
68% |
|
Decliners |
3,104 |
75% |
|
Russell 2000 |
-58.93 |
2,212.70 |
-2.59% |
|
52 Wk Highs |
713 |
|
|
52 Wk Highs |
332 |
|
|
S&P 600 |
-29.80 |
1,344.46 |
-2.17% |
|
52 Wk Lows |
52 |
|
|
52 Wk Lows |
147 |
|
|
 |
Breadth Negative as Major Indices Encounter Distributional Pressure
Kenneth J. Gruneisen - Passed the CAN SLIM® Master's Exam
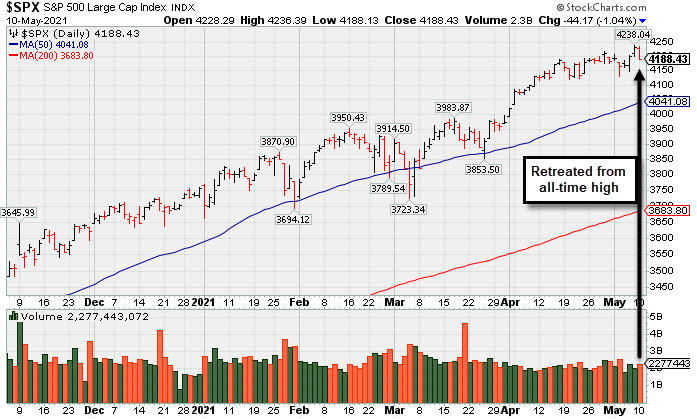
The Dow snapped a five-session winning streak, erasing an early session jump of 300 points to end 34 points lower. The S&P 500 slumped 1%, drifting from Friday’s record closing level. The Nasdaq Composite slid 2.6%, its biggest drop since March 18 amid weakness in tech and growth-oriented shares. The index had capped its third consecutive weekly decline on Friday. The small-cap Russell 2000 declined 2.3%. The volume totals reported were higher than the prior session on the NYSE and on the Nasdaq exchange, indicative of an increase in institutional selling selling pressure. Breadth was negative as decliners led advancers by more than a 2-1 margin on the NYSE and nearly 3-1 on the Nasdaq exchange. There were 171 high-ranked companies from the Leaders List that hit new 52-week highs and were listed on the BreakOuts Page, versus the total of 128 on the prior session. New 52-week highs totals expanded and solidly outnumbered new 52-week lows totals on both the NYSE and the Nasdaq exchange. The major indices (M criteria) are in a confirmed uptrend. Investors are reminded to always make buying and selling decisions on case-by-case basis under the strict criteria and rules of the fact-based investment system.
PICTURED: The S&P 500 Index retreated from its all-time high.
U.S. stocks finished lower on Monday as investors weighed inflationary concerns. Meanwhile, market participants assessed the implications of a cybersecurity attack that shuttered the nation’s largest fuel pipeline over the weekend. Colonial Pipeline, which operates the 5,500-mile system, suggested that service should fully resume by the end of the week, helping gasoline futures close the day up just 0.3%, well off a three-year high touched overnight. There were no economic releases of note today, but Wednesday’s update on consumer prices will likely headline the week. CPI is expected to spike 3.6% year-over-year in April, gathering momentum from March’s 2.6% jump. Treasuries weakened, with the yield on the 10-year note up two basis points to 1.59%.
Six of 11 S&P 500 sectors ended in negative territory, with the Technology, Consumer Discretionary, and Communication Services groups declining the most. In corporate news, Intel (INTC -2.95%), Facebook (FB -4.11%), and Google parent Alphabet (GOOGL -2.58%) each fell on the heels of analyst downgrades. In earnings, beauty company Coty (COTY -12.96%) fell after its profit tally fell short of consensus estimates. |
 Kenneth J. Gruneisen started out as a licensed stockbroker in August 1987, a couple of months prior to the historic stock market crash that took the Dow Jones Industrial Average down -22.6% in a single day. He has published daily fact-based fundamental and technical analysis on high-ranked stocks online for two decades. Through FACTBASEDINVESTING.COM, Kenneth provides educational articles, news, market commentary, and other information regarding proven investment systems that work in good times and bad.
Comments contained in the body of this report are technical opinions only and are not necessarily those of Gruneisen Growth Corp. The material herein has been obtained from sources believed to be reliable and accurate, however, its accuracy and completeness cannot be guaranteed. Our firm, employees, and customers may effect transactions, including transactions contrary to any recommendation herein, or have positions in the securities mentioned herein or options with respect thereto. Any recommendation contained in this report may not be suitable for all investors and it is not to be deemed an offer or solicitation on our part with respect to the purchase or sale of any securities. |
|
 |
Retail, Financial, Tech, and Commodity-Linked Groups Fell
Kenneth J. Gruneisen - Passed the CAN SLIM® Master's Exam
Weakness in the Retail Index ($RLX -1.51%) and financials weighed on the major averages as the Broker/Dealer Index ($XBD -1.18%) outpaced the Bank Index ($BKX -0.23%) to the downside. The Semiconductor Index ($SOX -4.65%) led the tech retreat while the Biotech Index ($BTK -1.71%) and Networking Index ($NWX -1.64%) also fell. The Oil Services Index ($OSX -2.99%) and Integrated Oil Index ($XOI -0.30%) lost ground along with the Gold & Silver Index ($XAU -1.00%).
PICTURED: The Retail Index ($RLX -1.51%) is consolidating well above its 50-day moving average (DMA) line and prior high.
| Oil Services |
$OSX |
59.87 |
-1.84 |
-2.99% |
+35.06% |
| Integrated Oil |
$XOI |
1,101.80 |
-3.29 |
-0.30% |
+39.03% |
| Semiconductor |
$SOX |
2,967.27 |
-144.76 |
-4.65% |
+6.14% |
| Networking |
$NWX |
799.99 |
-13.30 |
-1.64% |
+11.56% |
| Broker/Dealer |
$XBD |
461.26 |
-5.53 |
-1.18% |
+22.16% |
| Retail |
$RLX |
3,865.10 |
-59.33 |
-1.51% |
+8.47% |
| Gold & Silver |
$XAU |
154.72 |
-1.56 |
-1.00% |
+7.30% |
| Bank |
$BKX |
132.46 |
-0.31 |
-0.23% |
+35.29% |
| Biotech |
$BTK |
5,440.75 |
-94.55 |
-1.71% |
-5.20% |
|
|
|
 |
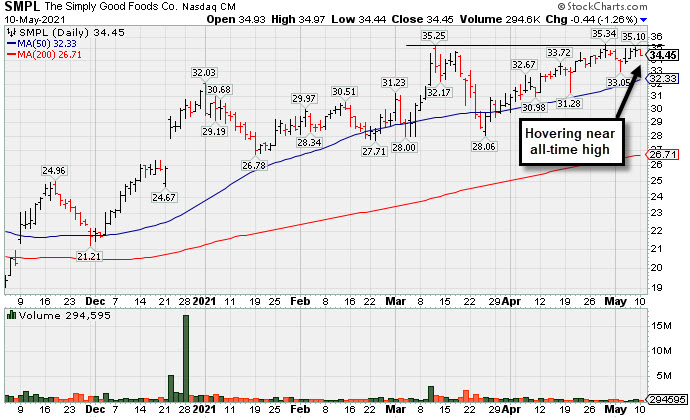
Hovering Near All-Time High Following Lackluster Quarter
Kenneth J. Gruneisen - Passed the CAN SLIM® Master's Exam
Simply Good Foods Co (SMPL -$0.44 or -1.26% to $34.45) is still perched near its all-time high, stubbornly holding its ground with volume totals cooling. A new pivot point has not been cited due to fundamental concerns after it reported Feb '21 quarterly earnings +9% on +2% sales revenues versus the year ago period, raising fundamental concerns. The prior 4 quarterly comparisons were above the +25% minimum earnings guideline (C criteria) and its annual earnings history (A criteria) has been strong. It has an 85 Earnings Per Share Rating.
Its 50-day moving average (DMA) line ($32.33) defines important near-term support to watch on pullbacks. Its current Relative Strength Rating is 78, below the 80+ minimum guideline for buy candidates. SMPL completed a new Pubic Offering on 10/09/19. The company has a Timeliness Rating of C and Sponsorship Rating of C. The number of top-rated funds owning its shares fell from 442 in Dec '19 to 379 in Mar '21. Its current Up/Down Volume Ratio of 1.3 is an unbiased indication its shares have been under slight accumulation over the past 50 days.
SMPL was last shown in this FSU section on 4/14/21 with an annotated graph included under the headline, "Perched Near High But Fundamental Concerns Were Raised". It was first highlighted in yellow with pivot point cited based on its 9/09/19 high plus 10 cents in the 12/28/20 mid-day report (read here).
Some leadership has been provided by other companies in the Food/Beverage Sector, however, the Food-Confectionery industry group has a Group Relative Strength Rating of 22 (D) which is a concern regarding the L criteria. There are only 5 companies listed in the group.
|
|
|
Color Codes Explained :
Y - Better candidates highlighted by our
staff of experts.
G - Previously featured
in past reports as yellow but may no longer be buyable under the
guidelines.
***Last / Change / Volume data in this table is the closing quote data***
Symbol/Exchange
Company Name
Industry Group |
PRICE |
CHANGE
(%Change) |
Day High |
Volume
(% DAV)
(% 50 day avg vol) |
52 Wk Hi
% From Hi |
Featured
Date |
Price
Featured |
Pivot Featured |
|
Max Buy |
 SIVB
-
NASDAQ
SIVB
-
NASDAQ
S V B Financial Group
BANKING - Regional - Pacific Banks
|
$575.90
|
-12.08
-2.05% |
$592.34
|
415,040
74.38% of 50 DAV
50 DAV is 558,000
|
$589.41
-2.29%
|
4/23/2021
|
$579.70
|
PP = $577.16
|
|
MB = $606.02
|
Most Recent Note - 5/5/2021 5:39:19 PM
Y - Posted another gain today with below average volume, wedging higher for a best-ever close. Confirming volume-driven gains are still needed to help clinch a convincing technical buy signal. Bullish action came after it reported earnings +293% on +64% sales revenues for the Mar '21 quarter versus the year ago period, its 3rd strong comparison. Completed a new Public Offering on 3/24/21.
>>> FEATURED STOCK ARTICLE : Hit New High But Closed Below Pivot Point - 4/23/2021 |
View all notes |
Set NEW NOTE alert |
Company Profile |
SEC
News |
Chart |
Request a new note
C
A
S
I |
CROX
-
NASDAQ
Crocs Inc
CONSUMER NON-DURABLES - Textile - Apparel Footwear
|
$104.23
|
-4.69
-4.31% |
$109.91
|
1,924,816
141.12% of 50 DAV
50 DAV is 1,364,000
|
$109.39
-4.72%
|
4/27/2021
|
$99.81
|
PP = $86.50
|
|
MB = $90.83
|
 Most Recent Note - 5/10/2021 2:57:32 PM
G - Reversed into the red today after hitting yet another new all-time high. A spurt of volume-driven gains has it very extended from the latest base. Prior highs in the $86 area define initial support to watch on pullbacks.
>>> FEATURED STOCK ARTICLE : Powerful "Breakaway Gap" for CROX - 4/27/2021 |
View all notes |
Set NEW NOTE alert |
Company Profile |
SEC
News |
Chart |
Request a new note
C
A
S
I |
RCKY
-
NASDAQ
Rocky Brands Inc
CONSUMER NON-DURABLES - Textile - Apparel Footwear
|
$63.08
|
-2.41
-3.68% |
$66.27
|
126,244
145.11% of 50 DAV
50 DAV is 87,000
|
$69.00
-8.58%
|
5/5/2021
|
$61.65
|
PP = $61.55
|
|
MB = $64.63
|
Most Recent Note - 5/10/2021 2:54:39 PM
G - Abruptly pulling back from its all-time high with today's big loss following 3 big volume-driven gains, testing the prior high in the $61 area that defines initial support to watch. Bullish action came after it reported Mar '21 quarterly earnings +341% on +57% sales revenues versus the year ago period, its 3rd strong quarterly comparison. Annual earnings (A criteria) history has been strong since a downturn in FY '16.
>>> FEATURED STOCK ARTICLE : Rocky Brands Powered Higher After Strong Earnings - 5/5/2021 |
View all notes |
Set NEW NOTE alert |
Company Profile |
SEC
News |
Chart |
Request a new note
C
A
S
I |
CRL
-
NYSE
Charles River Labs Intl
DRUGS - Biotechnology
|
$332.88
|
-9.67
-2.82% |
$342.11
|
564,680
178.13% of 50 DAV
50 DAV is 317,000
|
$349.13
-4.65%
|
12/17/2020
|
$247.06
|
PP = $257.98
|
|
MB = $270.88
|
Most Recent Note - 5/6/2021 6:06:23 PM
G - Pulled back from its all-time high with today's loss following 2 consecutive volume-driven gains. Very extended from any sound base. Its 50 DMA line ($302) acted as support throughout its ongoing ascent. Reported Mar '21 quarterly earnings +38% on +17%v sales revenues versus the year ago period. Two of the past 3 quarterly comparisons have been above the +25% minimum earnings guideline (C criteria). See the latest FSU analysis for more details and a new annotated graph.
>>> FEATURED STOCK ARTICLE : Pulling Back From Record High Following Strong Quarterly Report - 5/6/2021 |
View all notes |
Set NEW NOTE alert |
Company Profile |
SEC
News |
Chart |
Request a new note
C
A
S
I |
CAMT
-
NASDAQ
Camtek Ltd
ELECTRONICS - Scientific and Technical Instrum
|
$29.63
|
-1.39
-4.48% |
$31.89
|
369,851
113.80% of 50 DAV
50 DAV is 325,000
|
$36.14
-18.01%
|
4/28/2021
|
$35.03
|
PP = $35.34
|
|
MB = $37.11
|
Most Recent Note - 5/7/2021 11:58:34 AM
Y - Finding prompt support today near its 50 DMA line ($30.87) after a streak of 6 consecutive losses, action indicative of distributional pressure. Subsequent gains and a strong close above the pivot point backed by at least +40% above average volume are needed to trigger a technical buy signal.
>>> FEATURED STOCK ARTICLE : Earnings Acceleration and Perched at High After Ascending Base - 4/28/2021 |
View all notes |
Set NEW NOTE alert |
Company Profile |
SEC
News |
Chart |
Request a new note
C
A
S
I |
Symbol/Exchange
Company Name
Industry Group |
PRICE |
CHANGE
(%Change) |
Day High |
Volume
(% DAV)
(% 50 day avg vol) |
52 Wk Hi
% From Hi |
Featured
Date |
Price
Featured |
Pivot Featured |
|
Max Buy |
BRKS
-
NASDAQ
Brooks Automation
ELECTRONICS - Semiconductor Equipment and Mate
|
$89.44
|
-9.73
-9.81% |
$98.00
|
1,344,751
175.55% of 50 DAV
50 DAV is 766,000
|
$108.72
-17.73%
|
4/5/2021
|
$99.31
|
PP = $91.88
|
|
MB = $96.47
|
Most Recent Note - 5/10/2021 2:42:14 PM
G - Violating prior highs in the $91 area and undercutting its 50 DMA line ($90.84) with today's damaging loss raising concerns and triggering technical sell signals. Only a prompt rebound would help its outlook improve.
>>> FEATURED STOCK ARTICLE : Extended From Base and Consolidating After Recent Rally - 4/30/2021 |
View all notes |
Set NEW NOTE alert |
Company Profile |
SEC
News |
Chart |
Request a new note
C
A
S
I |
ENTG
-
NASDAQ
Entegris Inc
ELECTRONICS - Semiconductor Equipment and Mate
|
$108.20
|
-6.51
-5.68% |
$113.76
|
1,657,499
182.95% of 50 DAV
50 DAV is 906,000
|
$126.41
-14.41%
|
4/1/2021
|
$118.42
|
PP = $110.37
|
|
MB = $115.89
|
Most Recent Note - 5/10/2021 2:46:08 PM
G - Big volume-driven loss today has it again slumping below the prior high in the $110 area and below its 50 DMA line, raising concerns. Only a prompt rebound would help its outlook improve.
>>> FEATURED STOCK ARTICLE : Negated Recent Breakout and Sputtering Near Prior High - 4/22/2021 |
View all notes |
Set NEW NOTE alert |
Company Profile |
SEC
News |
Chart |
Request a new note
C
A
S
I |
OPY
-
NYSE
Oppenheimer Holdings Inc
FINANCIAL SERVICES - Investment Brokerage - Regiona
|
$51.00
|
+0.05
0.10% |
$52.37
|
97,096
80.24% of 50 DAV
50 DAV is 121,000
|
$52.45
-2.76%
|
2/25/2021
|
$38.95
|
PP = $38.11
|
|
MB = $40.02
|
Most Recent Note - 5/10/2021 6:28:26 PM
G - Hovering near its all-time high, very extended from any sound base. Bullish action came after it reported Mar '21 quarterly earnings +402% on +59% sales revenues versus the year ago period. Prior high in the $44 area defines initial support to watch above its 50 DMA line ($43.69).
>>> FEATURED STOCK ARTICLE : Negative Reversal After 7 Consecutive Gains - 4/20/2021 |
View all notes |
Set NEW NOTE alert |
Company Profile |
SEC
News |
Chart |
Request a new note
C
A
S
I |
LAD
-
NYSE
Lithia Motors Inc Cl A
SPECIALTY RETAIL - Auto Dealerships
|
$369.08
|
-10.85
-2.86% |
$380.57
|
207,148
68.59% of 50 DAV
50 DAV is 302,000
|
$417.98
-11.70%
|
4/21/2021
|
$377.00
|
PP = $418.08
|
|
MB = $438.98
|
Most Recent Note - 5/5/2021 5:44:36 PM
G - Volume was higher (near average ) as it sputtered to a close below its 50 DMA line ($386) and its color code is changed to green. A prompt rebound above its 50 DMA line is needed for its outlook to improve. Subsequent gains above the pivot point backed by at least +40% above average volume are needed to trigger a technical buy signal.
>>> FEATURED STOCK ARTICLE : Building a Base With Rebound Above 50-Day Moving Average - 4/21/2021 |
View all notes |
Set NEW NOTE alert |
Company Profile |
SEC
News |
Chart |
Request a new note
C
A
S
I |
CLFD
-
NASDAQ
Clearfield Inc
TELECOMMUNICATIONS - Cables / Satalite Equipment
|
$35.60
|
-3.49
-8.93% |
$39.12
|
124,074
88.00% of 50 DAV
50 DAV is 141,000
|
$40.26
-11.57%
|
4/26/2021
|
$39.68
|
PP = $38.85
|
|
MB = $40.79
|
Most Recent Note - 5/10/2021 2:43:31 PM
Y - Pulling back abruptly today following 5 consecutive gains. Fundamentals remain strong after it reported Mar '21 quarterly earnings +440% on +45% sales revenues versus the year ago period, continuing its strong earnings track record.
>>> FEATURED STOCK ARTICLE : Rallied Straight Up From Bottom of 10-Week Base - 4/26/2021 |
View all notes |
Set NEW NOTE alert |
Company Profile |
SEC
News |
Chart |
Request a new note
C
A
S
I |
Symbol/Exchange
Company Name
Industry Group |
PRICE |
CHANGE
(%Change) |
Day High |
Volume
(% DAV)
(% 50 day avg vol) |
52 Wk Hi
% From Hi |
Featured
Date |
Price
Featured |
Pivot Featured |
|
Max Buy |
EDUC
-
NASDAQ
Educational Development
WHOLESALE - Basic Materials Wholesale
|
$16.61
|
-0.84
-4.81% |
$17.40
|
9,965
39.86% of 50 DAV
50 DAV is 25,000
|
$20.00
-16.95%
|
3/10/2021
|
$17.89
|
PP = $20.10
|
|
MB = $21.11
|
Most Recent Note - 5/10/2021 2:59:32 PM
G - Color code is changed to green after sputtering below its 50 DMA line ($17.43). A rebound above the 50 DMA line is needed for its outlook to improve. Met stubborn resistance in the $19-20 area. Subsequent gains above the pivot point backed by at least +40% above average volume are needed to trigger a proper technical buy signal.
>>> FEATURED STOCK ARTICLE : Finding Support During Consolidation Above 50-Day Moving Average - 4/16/2021 |
View all notes |
Set NEW NOTE alert |
Company Profile |
SEC
News |
Chart |
Request a new note
C
A
S
I |
SMPL
-
NASDAQ
Simply Good Foods Co
Food-Confectionery
|
$34.45
|
-0.44
-1.26% |
$34.97
|
292,497
43.14% of 50 DAV
50 DAV is 678,000
|
$35.34
-2.52%
|
12/28/2020
|
$30.40
|
PP = $31.44
|
|
MB = $33.01
|
Most Recent Note - 5/10/2021 6:27:13 PM
G - Still quietly perched near its all-time high, stubbornly holding its ground with volume totals cooling. Reported Feb '21 quarterly earnings +9% on +2% sales revenues versus the year ago period, below the +25% minimum earnings guideline (C criteria), raising fundamental concerns. Its 50 DMA line ($32.33) defines important near-term support to watch on pullbacks. Its current Relative Strength Rating is 78, below the 80+ minimum guideline for buy candidates. See the latest FSU analysis for more details and a new annotated graph.
>>> FEATURED STOCK ARTICLE : Hovering Near All-Time High Following Lackluster Quarter - 5/10/2021 |
View all notes |
Set NEW NOTE alert |
Company Profile |
SEC
News |
Chart |
Request a new note
C
A
S
I |
IBP
-
NYSE
Installed Building Prod
DIVERSIFIED SERVICES - Business/Management Services
|
$128.57
|
+1.00
0.78% |
$130.77
|
466,026
203.50% of 50 DAV
50 DAV is 229,000
|
$140.58
-8.54%
|
4/19/2021
|
$131.15
|
PP = $130.21
|
|
MB = $136.72
|
Most Recent Note - 5/10/2021 12:45:28 PM
G - Showing resilience today, rebounding near the prior high in the $130 area after slumping into the prior base. Gapped down on 5/07/21 for a big volume-driven loss, raising technical concerns. Its 50 DMA line ($120) defines the next important near-term support level. Weak action came after it reported Mar '21 quarterly earnings +15% on +10% sales revenues versus the year ago period, below the +25% minimum earnings guideline (C criteria) raising fundamental concerns.
>>> FEATURED STOCK ARTICLE : Steady Streak of Gains Into New High Territory - 4/19/2021 |
View all notes |
Set NEW NOTE alert |
Company Profile |
SEC
News |
Chart |
Request a new note
C
A
S
I |
QRVO
-
NASDAQ
"Qorvo, Inc"
ELECTRONICS - Semiconductor - Integrated Cir
|
$171.47
|
-12.71
-6.90% |
$180.39
|
4,372,548
386.13% of 50 DAV
50 DAV is 1,132,400
|
$201.68
-14.98%
|
4/1/2021
|
$190.48
|
PP = $191.92
|
|
MB = $201.52
|
Most Recent Note - 5/10/2021 2:50:08 PM
G - Color code is changed to green after gapping down today violating its 50 DMA line ($183.60) and undercutting the prior low with a damaging volume-driven loss triggering a technical sell signal. Reported Mar '21 quarterly earnings +75% on +36% sales revenues versus the year ago period, its 3rd very strong quarterly comparison. It stalled after recently wedging up to new highs from a 9-week base. Its Relative Strength Rating is 69, below the 80+ minimum for buy candidates.
>>> FEATURED STOCK ARTICLE : Quiet Gain For Best Ever Close - 4/29/2021 |
View all notes |
Set NEW NOTE alert |
Company Profile |
SEC
News |
Chart |
Request a new note
C
A
S
I |
YETI
-
NYSE
Yeti Holdings Inc
Leisure-Products
|
$88.22
|
-1.56
-1.74% |
$90.65
|
1,301,033
104.84% of 50 DAV
50 DAV is 1,241,000
|
$90.54
-2.56%
|
4/6/2021
|
$76.95
|
PP = $79.42
|
|
MB = $83.39
|
Most Recent Note - 5/6/2021 6:11:00 PM
G - Stubbornly holding its ground in a tight range near its all-time high, extended from the latest base. Prior highs in the $80 area define initial support to watch on pullbacks.
>>> FEATURED STOCK ARTICLE : Hovering Near Record High Following Volume-Driven Gains - 5/3/2021 |
View all notes |
Set NEW NOTE alert |
Company Profile |
SEC
News |
Chart |
Request a new note
C
A
S
I |
Symbol/Exchange
Company Name
Industry Group |
PRICE |
CHANGE
(%Change) |
Day High |
Volume
(% DAV)
(% 50 day avg vol) |
52 Wk Hi
% From Hi |
Featured
Date |
Price
Featured |
Pivot Featured |
|
Max Buy |
MRBK
-
NASDAQ
Meridian Corp
Banks-Northeast
|
$26.04
|
+0.21
0.81% |
$26.22
|
42,056
116.50% of 50 DAV
50 DAV is 36,100
|
$27.96
-6.87%
|
2/22/2021
|
$25.58
|
PP = $26.10
|
|
MB = $27.41
|
Most Recent Note - 5/7/2021 5:40:40 PM
Y - Posted a small gain today halting its slide after 5 consecutive small losses. Consolidating near its 50 DMA line ($25.83), still perched only -7.6% off its 52-week high. Reported Mar '21 earnings +323% on +93% sales revenues versus the year ago period, continuing its strong earnings track record. Recent low ($24.01 on 4/21/21) defines important near-term support where any violation may trigger a worrisome technical sell signal. Its Relative Strength Rating is 74, below the 80 minimum guideline. See the latest FSU analysis for more details and a new annotated graph.
>>> FEATURED STOCK ARTICLE : Bank Consolidating Near 50 Day Moving Average Line - 5/7/2021 |
View all notes |
Set NEW NOTE alert |
Company Profile |
SEC
News |
Chart |
Request a new note
C
A
S
I |
|
|
|
THESE ARE NOT BUY RECOMMENDATIONS!
Comments contained in the body of this report are technical
opinions only. The material herein has been obtained
from sources believed to be reliable and accurate, however,
its accuracy and completeness cannot be guaranteed.
This site is not an investment advisor, hence it does
not endorse or recommend any securities or other investments.
Any recommendation contained in this report may not
be suitable for all investors and it is not to be deemed
an offer or solicitation on our part with respect to
the purchase or sale of any securities. All trademarks,
service marks and trade names appearing in this report
are the property of their respective owners, and are
likewise used for identification purposes only.
This report is a service available
only to active Paid Premium Members.
You may opt-out of receiving report notifications
at any time. Questions or comments may be submitted
by writing to Premium Membership Services 665 S.E. 10 Street, Suite 201 Deerfield Beach, FL 33441-5634 or by calling 1-800-965-8307
or 954-785-1121.
|
|
|