You are not logged in.
This means you
CAN ONLY VIEW reports that were published prior to Thursday, March 20, 2025.
You
MUST UPGRADE YOUR MEMBERSHIP if you want to see any current reports.
AFTER MARKET UPDATE - WEDNESDAY, APRIL 21ST, 2021
Previous After Market Report Next After Market Report >>>
|
|
|
|
DOW |
+316.01 |
34,137.31 |
+0.93% |
|
Volume |
826,213,650 |
-6% |
|
Volume |
3,958,883,400 |
-6% |
|
NASDAQ |
+162.64 |
13,948.91 |
+1.18% |
|
Advancers |
2,569 |
78% |
|
Advancers |
3,229 |
77% |
|
S&P 500 |
+38.48 |
4,173.42 |
+0.93% |
|
Decliners |
717 |
22% |
|
Decliners |
947 |
23% |
|
Russell 2000 |
+51.42 |
2,239.63 |
+2.35% |
|
52 Wk Highs |
228 |
|
|
52 Wk Highs |
101 |
|
|
S&P 600 |
+28.57 |
1,332.27 |
+2.19% |
|
52 Wk Lows |
41 |
|
|
52 Wk Lows |
89 |
|
|
 |
Breadth Positive But Volume Totals Were Lighter as Indices Bounced
Kenneth J. Gruneisen - Passed the CAN SLIM® Master's Exam
The Dow climbed 316 points, and the S&P 500 advanced 0.9%. The Nasdaq Composite was up 1.2%, while the small-cap Russell 2000 surged 2.2%. The volume totals reported were lighter than the prior session on the NYSE and on the Nasdaq exchange. Breadth was positive as advancers led decliners by more than a 3-1 margin on the NYSE and on the Nasdaq exchange. There were 19 high-ranked companies from the Leaders List that hit new 52-week highs and were listed on the BreakOuts Page, versus the total of 20 on the prior session. New 52-week highs totals expanded and outnumbered new 52-week lows on both the NYSE and the Nasdaq exchange. The major indices (M criteria) are in a confirmed uptrend. Investors are reminded to always make buying and selling decisions on case-by-case basis under the strict criteria and rules of the fact-based investment system.
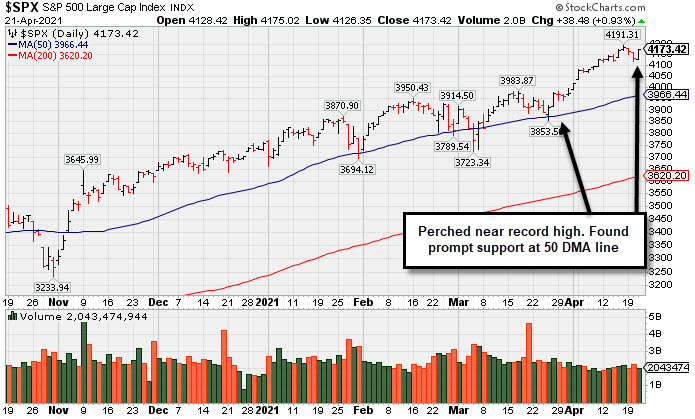
PICTURED: The S&P 500 Index is quietly perched near its record high. It found prompt support at its 50-day moving average (DMA) during the recent consolidation.
U.S. stocks finished higher on Wednesday, bouncing back from a two-day sell-off. Investors appeared to “buy the dip,” digesting another round of corporate earnings reports. Rising global COVID-19 infections lingered, however, with renewed lockdown measures in India and Japan dragging down oil prices.
Nine of 11 S&P 500 sectors closed in positive territory, with the more value and cyclical-oriented groups outperforming. Communication Services lagged amid disappointing earnings. Netflix (NFLX -7.4%) fell after missing consensus estimates for subscriber growth in the first quarter and providing weak current-quarter guidance. Verizon (VZ -0.43%) edged lower following a larger-than-expected drop in wireless subscribers. Meanwhile, shares of Anthem (ANTM +0.78%) rose on a better-than-expected profit tally and improved full-year outlook. In Health Care, Intuitive Surgical (ISRG +9.9%) blasted to new highs with 4 times average volume following upbeat quarterly figures. Elsewhere, rail operator CSX Corp. (CSX +4.31%) rose to a new all-time high after offering a strong revenue forecast. In other corporate news, Norwegian Cruise Line Holdings (NCLH +10.32%) rose on the heels of an analyst upgrade.
Treasuries were little changed despite a strong 20-year bond auction. The yield on the 10-year note was down one basis point to 1.55%. In commodities, WTI crude fell 2.6% to $61.04/barrel, pressured by a surprise buildup in weekly U.S. crude stockpiles and spiking COVID-19 cases in Asia. In FOREX trading, the Canadian dollar soared to its strongest level since January after the country’s central bank announced plans to taper asset purchases, the biggest move toward post-pandemic tightening of any major economy. |
 Kenneth J. Gruneisen started out as a licensed stockbroker in August 1987, a couple of months prior to the historic stock market crash that took the Dow Jones Industrial Average down -22.6% in a single day. He has published daily fact-based fundamental and technical analysis on high-ranked stocks online for two decades. Through FACTBASEDINVESTING.COM, Kenneth provides educational articles, news, market commentary, and other information regarding proven investment systems that work in good times and bad.
Comments contained in the body of this report are technical opinions only and are not necessarily those of Gruneisen Growth Corp. The material herein has been obtained from sources believed to be reliable and accurate, however, its accuracy and completeness cannot be guaranteed. Our firm, employees, and customers may effect transactions, including transactions contrary to any recommendation herein, or have positions in the securities mentioned herein or options with respect thereto. Any recommendation contained in this report may not be suitable for all investors and it is not to be deemed an offer or solicitation on our part with respect to the purchase or sale of any securities. |
|
 |
Financial, Tech, Retail, and Commodity-Linked Groups Rose
Kenneth J. Gruneisen - Passed the CAN SLIM® Master's Exam
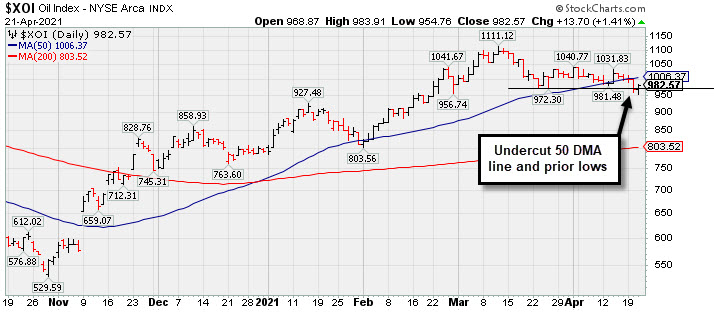
The tech sector had a positive bias as the Semiconductor Index ($SOX +2.81%), Biotech Index ($BTK +1.35%), and Networking Index ($NWX +1.30%) posted unanimous gains. The Broker/Dealer Index ($XBD +1.27%) and Bank Index ($BKX +1.97%) both posted gains that outpaced the Retail Index ($RLX +0.68%). Commodity-linked groups also had a positive bias as the Gold & Silver Index ($XAU +2.26%) outpaced the Oil Services Index ($OSX +1.28%) and the Integrated Oil Index ($XOI +1.41%). PICTURED: The Integrated Oil Index ($XOI +1.41%) recently undercut its 50-day moving average (DMA) line and prior lows.
| Oil Services |
$OSX |
50.08 |
+0.63 |
+1.28% |
+12.98% |
| Integrated Oil |
$XOI |
982.57 |
+13.70 |
+1.41% |
+23.99% |
| Semiconductor |
$SOX |
3,209.16 |
+87.72 |
+2.81% |
+14.80% |
| Networking |
$NWX |
800.76 |
+10.28 |
+1.30% |
+11.66% |
| Broker/Dealer |
$XBD |
455.83 |
+5.73 |
+1.27% |
+20.72% |
| Retail |
$RLX |
3,915.87 |
+26.44 |
+0.68% |
+9.90% |
| Gold & Silver |
$XAU |
151.76 |
+3.36 |
+2.26% |
+5.25% |
| Bank |
$BKX |
121.40 |
+2.35 |
+1.97% |
+23.99% |
| Biotech |
$BTK |
5,614.78 |
+74.76 |
+1.35% |
-2.16% |
|
|
|
 |
Building a Base With Rebound Above 50-Day Moving Average
Kenneth J. Gruneisen - Passed the CAN SLIM® Master's Exam
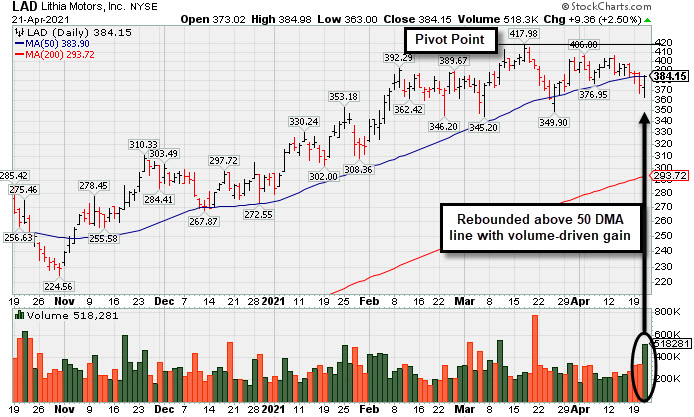
Lithia Motors Inc Cl A (LAD +$9.36 or +2.50% to $384.15) finished strong after highlighted in yellow in the earlier mid-day report (read here) with a pivot point cited based on its 3/17/21 high plus 10 cents. Today's volume-driven gain helped it rebound above its 50-day moving average (DMA) line ($384) which has acted as support during its ongoing ascent. Subsequent gains above the pivot point backed by at least +40% above average volume may trigger a technical buy signal.
It has an Earnings Per Share Rating of 97. LAD reported earnings +193% on +55% sales revenues for the Mar '21 quarter versus the year ago period, its 3rd consecutive quarterly earnings increases above the +25% minimum (C criteria) guideline with sequential quarters showing acceleration in its sales revenues growth rate. This Medford, Oregon-based Retail/Wholesale - Automobile firm's annual earnings history (A criteria) has been strong and steady after a dramatic downturn in FY '07 and '08 earnings.
LAD completed a new Public Offering on 9/30/20. There are 26.6 million shares outstanding (S criteria) which can contribute to greater volatility in the event of institutional buying or selling. The number of top-rated funds owning its shares rose from 567 in Jun '20 to 766 in Mar '21, a reassuring sign concerning the I criteria. Its Timeliness Rating is A and Sponsorship Rating is B.
|
|
|
Color Codes Explained :
Y - Better candidates highlighted by our
staff of experts.
G - Previously featured
in past reports as yellow but may no longer be buyable under the
guidelines.
***Last / Change / Volume data in this table is the closing quote data***
Symbol/Exchange
Company Name
Industry Group |
PRICE |
CHANGE
(%Change) |
Day High |
Volume
(% DAV)
(% 50 day avg vol) |
52 Wk Hi
% From Hi |
Featured
Date |
Price
Featured |
Pivot Featured |
|
Max Buy |
 CRL
-
NYSE
CRL
-
NYSE
Charles River Labs Intl
DRUGS - Biotechnology
|
$324.02
|
+1.65
0.51% |
$325.61
|
282,423
87.17% of 50 DAV
50 DAV is 324,000
|
$327.72
-1.13%
|
12/17/2020
|
$247.06
|
PP = $257.98
|
|
MB = $270.88
|
Most Recent Note - 4/20/2021 5:32:31 PM
G - There was a "negative reversal" today after hitting new all-time highs with 3 consecutive gains. Its 50 DMA line ($290) acted as support throughout its ongoing ascent. Its Relative Strength Rating is 83, above the 80+ minimum guideline for buy candidates. Dec '20 quarterly earnings rose +19% on +14% sales revenues versus the year ago period, below the +25% minimum earnings guideline (C criteria), raising fundamental concerns.
>>> FEATURED STOCK ARTICLE : Perched at Record High After Rally From 50-Day Moving Average - 4/9/2021 |
View all notes |
Set NEW NOTE alert |
Company Profile |
SEC
News |
Chart |
Request a new note
C
A
S
I |
BRKS
-
NASDAQ
Brooks Automation
ELECTRONICS - Semiconductor Equipment and Mate
|
$97.39
|
+3.73
3.98% |
$97.63
|
752,266
105.95% of 50 DAV
50 DAV is 710,000
|
$104.40
-6.71%
|
4/5/2021
|
$99.31
|
PP = $91.88
|
|
MB = $96.47
|
 Most Recent Note - 4/21/2021 6:00:34 PM
G - Color code is changed to green after today's gain and rebound back above its "max buy" level. Prior highs in the $91 area define initial support to watch above its 50 DMA line ($87).
>>> FEATURED STOCK ARTICLE : High Ranked Semiconductor Equipment Firm Powered Higher - 4/7/2021 |
View all notes |
Set NEW NOTE alert |
Company Profile |
SEC
News |
Chart |
Request a new note
C
A
S
I |
ENTG
-
NASDAQ
Entegris Inc
ELECTRONICS - Semiconductor Equipment and Mate
|
$113.21
|
+2.49
2.25% |
$113.30
|
975,301
102.45% of 50 DAV
50 DAV is 952,000
|
$126.41
-10.44%
|
4/1/2021
|
$118.42
|
PP = $110.37
|
|
MB = $115.89
|
Most Recent Note - 4/21/2021 6:08:09 PM
Y - Posted a small gain today following 3 consecutive losses. Prior high in the $110 area defines the next near-term support to watch above its 50 DMA line ($107.56).
>>> FEATURED STOCK ARTICLE : Strong Breakout Action With +67% Above Average Volume - 4/1/2021 |
View all notes |
Set NEW NOTE alert |
Company Profile |
SEC
News |
Chart |
Request a new note
C
A
S
I |
OPY
-
NYSE
Oppenheimer Holdings Inc
FINANCIAL SERVICES - Investment Brokerage - Regiona
|
$45.44
|
+1.15
2.60% |
$45.59
|
80,167
66.25% of 50 DAV
50 DAV is 121,000
|
$45.80
-0.79%
|
2/25/2021
|
$38.95
|
PP = $38.11
|
|
MB = $40.02
|
Most Recent Note - 4/20/2021 5:30:52 PM
G - There was a "negative reversal" for a loss today after 7 consecutive small gains into new new 52-week high territory. It is extended from any sound base. Its 50 DMA line ($40.55) and prior low define near-term support to watch on pullbacks. See the latest FSU analysis for more details and a new annotated graph.
>>> FEATURED STOCK ARTICLE : Negative Reversal After 7 Consecutive Gains - 4/20/2021 |
View all notes |
Set NEW NOTE alert |
Company Profile |
SEC
News |
Chart |
Request a new note
C
A
S
I |
LAD
-
NYSE
Lithia Motors Inc Cl A
SPECIALTY RETAIL - Auto Dealerships
|
$384.15
|
+9.36
2.50% |
$384.98
|
518,281
176.29% of 50 DAV
50 DAV is 294,000
|
$417.98
-8.09%
|
4/21/2021
|
$377.00
|
PP = $418.08
|
|
MB = $438.98
|
Most Recent Note - 4/21/2021 5:55:20 PM
Y - Finished strong today after highlighted in yellow in the earlier mid-day report with a pivot point cited based on its 3/17/21 high plus 10 cents. Today's volume-driven gain helped it close back above its 50 DMA line ($384) which has acted as support during its ongoing ascent. Subsequent gains above the pivot point backed by at least +40% above average volume may trigger a technical buy signal. Completed a new Public Offering on 9/30/20. Reported earnings +193% on +55% sales revenues for the Mar '21 quarter versus the year ago period, its 3rd consecutive quarterly earnings increases above the +25% minimum (C criteria) guideline with sequential quarters showing acceleration in its sales revenues growth rate. This Medford, Oregon-based Retail/Wholesale - Automobile firm's annual earnings history (A criteria) has been strong and steady after a dramatic downturn in FY '07 and '08 earnings. See the latest FSU analysis for more details and a new annotated graph.
>>> FEATURED STOCK ARTICLE : Building a Base With Rebound Above 50-Day Moving Average - 4/21/2021 |
View all notes |
Set NEW NOTE alert |
Company Profile |
SEC
News |
Chart |
Request a new note
C
A
S
I |
Symbol/Exchange
Company Name
Industry Group |
PRICE |
CHANGE
(%Change) |
Day High |
Volume
(% DAV)
(% 50 day avg vol) |
52 Wk Hi
% From Hi |
Featured
Date |
Price
Featured |
Pivot Featured |
|
Max Buy |
EDUC
-
NASDAQ
Educational Development
WHOLESALE - Basic Materials Wholesale
|
$17.23
|
-0.24
-1.37% |
$17.54
|
9,750
32.50% of 50 DAV
50 DAV is 30,000
|
$20.00
-13.85%
|
3/10/2021
|
$17.89
|
PP = $20.10
|
|
MB = $21.11
|
Most Recent Note - 4/21/2021 5:56:20 PM
Y - Volume totals are cooling while still consolidating above its 50 DMA line ($17.02) which defines important near-term support. Met stubborn resistance in the $19-20 area. Subsequent gains above the pivot point backed by at least +40% above average volume are needed to trigger a proper technical buy signal.
>>> FEATURED STOCK ARTICLE : Finding Support During Consolidation Above 50-Day Moving Average - 4/16/2021 |
View all notes |
Set NEW NOTE alert |
Company Profile |
SEC
News |
Chart |
Request a new note
C
A
S
I |
SMPL
-
NASDAQ
Simply Good Foods Co
Food-Confectionery
|
$33.85
|
+0.86
2.61% |
$33.90
|
363,377
52.06% of 50 DAV
50 DAV is 698,000
|
$35.25
-3.97%
|
12/28/2020
|
$30.40
|
PP = $31.44
|
|
MB = $33.01
|
Most Recent Note - 4/21/2021 6:05:43 PM
G - Posted a quiet gain today, still perched within close striking distance of its 52-week and all-time high with volume totals cooling. Reported Feb '21 quarterly earnings +9% on +2% sales revenues versus the year ago period, below the +25% minimum earnings guideline (C criteria), raising fundamental concerns. Found prompt support near its 50 DMA line ($31) but its current Relative Strength Rating is 78, below the 80+ minimum guideline for buy candidates.
>>> FEATURED STOCK ARTICLE : Perched Near High But Fundamental Concerns Were Raised - 4/14/2021 |
View all notes |
Set NEW NOTE alert |
Company Profile |
SEC
News |
Chart |
Request a new note
C
A
S
I |
IBP
-
NYSE
Installed Building Prod
DIVERSIFIED SERVICES - Business/Management Services
|
$129.99
|
+1.84
1.44% |
$131.34
|
224,866
104.59% of 50 DAV
50 DAV is 215,000
|
$133.23
-2.43%
|
4/19/2021
|
$131.15
|
PP = $130.21
|
|
MB = $136.72
|
Most Recent Note - 4/20/2021 5:41:46 PM
Y - Pulled back with above average volume today breaking a streak of 8 consecutive gains. Highlighted in yellow in the 4/19/21 mid-day report with new pivot point cited based on its 2/12/21 high plus 10 cents. Subsequent gains and a strong close above its pivot point backed by at least +40% above average volume may trigger a proper technical buy signal. Reported earnings +34% on +10% sales revenues for the Dec '20 quarter versus the year-ago period. Three of the past 4 consecutive quarterly comparisons were above the +25% minimum earnings guideline (C criteria). Annual earnings (A criteria) history has been strong. See the latest FSU analysis for more details and an annotated graph.
>>> FEATURED STOCK ARTICLE : Steady Streak of Gains Into New High Territory - 4/19/2021 |
View all notes |
Set NEW NOTE alert |
Company Profile |
SEC
News |
Chart |
Request a new note
C
A
S
I |
QRVO
-
NASDAQ
Qorvo Inc
ELECTRONICS - Semiconductor - Integrated Cir
|
$189.21
|
+5.26
2.86% |
$189.30
|
1,033,784
84.05% of 50 DAV
50 DAV is 1,230,000
|
$199.94
-5.37%
|
4/1/2021
|
$190.48
|
PP = $191.92
|
|
MB = $201.52
|
Most Recent Note - 4/21/2021 6:03:57 PM
Y - Managed a "positive reversal" today with higher (but below average) volume after undercutting the prior high ($191) and nearly testing its 50 DMA line ($179.67). Stalled after recently wedging up to new highs from a noted 9-week base.
>>> FEATURED STOCK ARTICLE : Hit Another New High With Even Less Volume Conviction - 4/5/2021 |
View all notes |
Set NEW NOTE alert |
Company Profile |
SEC
News |
Chart |
Request a new note
C
A
S
I |
YETI
-
NYSE
Yeti Holdings Inc
Leisure-Products
|
$85.85
|
+2.62
3.15% |
$86.64
|
1,127,009
79.70% of 50 DAV
50 DAV is 1,414,000
|
$87.72
-2.13%
|
4/6/2021
|
$76.95
|
PP = $79.42
|
|
MB = $83.39
|
Most Recent Note - 4/21/2021 5:58:37 PM
G - Posted a solid gain on lighter volume today. Perched near its all-time high and slightly extended from the latest base. Prior highs in the $80 area define initial support to watch on pullbacks.
>>> FEATURED STOCK ARTICLE : YETI Perched Within Striking Distance of High - 4/7/2021 |
View all notes |
Set NEW NOTE alert |
Company Profile |
SEC
News |
Chart |
Request a new note
C
A
S
I |
Symbol/Exchange
Company Name
Industry Group |
PRICE |
CHANGE
(%Change) |
Day High |
Volume
(% DAV)
(% 50 day avg vol) |
52 Wk Hi
% From Hi |
Featured
Date |
Price
Featured |
Pivot Featured |
|
Max Buy |
DT
-
NYSE
Dynatrace Inc
Computer Sftwr-Enterprse
|
$50.80
|
+0.84
1.68% |
$51.10
|
967,183
44.87% of 50 DAV
50 DAV is 2,155,500
|
$56.94
-10.78%
|
2/4/2021
|
$51.39
|
PP = $48.95
|
|
MB = $51.40
|
Most Recent Note - 4/20/2021 5:36:57 PM
G - Violated its 50 DMA line ($51.52) with today's 3rd consecutive loss on light volume, retreating from near its 52-week high. Only a prompt rebound would help its outlook improve. Recent lows in the $45 area define important near-term support to watch on pullbacks. Its Relative Strength Rating is 66, below the 80+ minimum guideline for buy candidates. Fundamentals remain strong after it reported Dec '20 earnings +70% on +28% sales revenues versus the year ago period.
>>> FEATURED STOCK ARTICLE : Gap Up Rebounding Further Above 50-Day Moving Average - 4/8/2021 |
View all notes |
Set NEW NOTE alert |
Company Profile |
SEC
News |
Chart |
Request a new note
C
A
S
I |
MRBK
-
NASDAQ
Meridian Corp
Banks-Northeast
|
$24.59
|
-0.38
-1.52% |
$25.39
|
14,014
37.88% of 50 DAV
50 DAV is 37,000
|
$27.96
-12.05%
|
2/22/2021
|
$25.58
|
PP = $26.10
|
|
MB = $27.41
|
Most Recent Note - 4/20/2021 5:44:59 PM
G - Color code is changed to green after slumping below its 50 DMA line ($25.38) encountering distributional pressure. Undercut the prior low ($24.13 on 3/25/21) by one cent yet recovered from the session low. More damaging losses may trigger technical sell signals. Its Relative Strength Rating is 81, just above the 80+ minimum guideline.
>>> FEATURED STOCK ARTICLE : Encountering Distributional Pressure - 4/12/2021 |
View all notes |
Set NEW NOTE alert |
Company Profile |
SEC
News |
Chart |
Request a new note
C
A
S
I |
|
|
|
THESE ARE NOT BUY RECOMMENDATIONS!
Comments contained in the body of this report are technical
opinions only. The material herein has been obtained
from sources believed to be reliable and accurate, however,
its accuracy and completeness cannot be guaranteed.
This site is not an investment advisor, hence it does
not endorse or recommend any securities or other investments.
Any recommendation contained in this report may not
be suitable for all investors and it is not to be deemed
an offer or solicitation on our part with respect to
the purchase or sale of any securities. All trademarks,
service marks and trade names appearing in this report
are the property of their respective owners, and are
likewise used for identification purposes only.
This report is a service available
only to active Paid Premium Members.
You may opt-out of receiving report notifications
at any time. Questions or comments may be submitted
by writing to Premium Membership Services 665 S.E. 10 Street, Suite 201 Deerfield Beach, FL 33441-5634 or by calling 1-800-965-8307
or 954-785-1121.
|
|
|