You are not logged in.
This means you
CAN ONLY VIEW reports that were published prior to Thursday, March 20, 2025.
You
MUST UPGRADE YOUR MEMBERSHIP if you want to see any current reports.
AFTER MARKET UPDATE - WEDNESDAY, MAY 5TH, 2021
Previous After Market Report Next After Market Report >>>
|
|
|
|
DOW |
+97.31 |
34,230.34 |
+0.29% |
|
Volume |
928,840,601 |
-2% |
|
Volume |
4,499,425,900 |
-23% |
|
NASDAQ |
-52.58 |
13,580.93 |
-0.39% |
|
Advancers |
1,726 |
53% |
|
Advancers |
1,858 |
45% |
|
S&P 500 |
+2.93 |
4,167.59 |
+0.07% |
|
Decliners |
1,537 |
47% |
|
Decliners |
2,279 |
55% |
|
Russell 2000 |
-6.92 |
2,241.37 |
-0.31% |
|
52 Wk Highs |
361 |
|
|
52 Wk Highs |
182 |
|
|
S&P 600 |
-0.60 |
1,353.81 |
-0.04% |
|
52 Wk Lows |
16 |
|
|
52 Wk Lows |
82 |
|
|
 |
Leadership Improved But Major Average Ended Mixed
Kenneth J. Gruneisen - Passed the CAN SLIM® Master's Exam
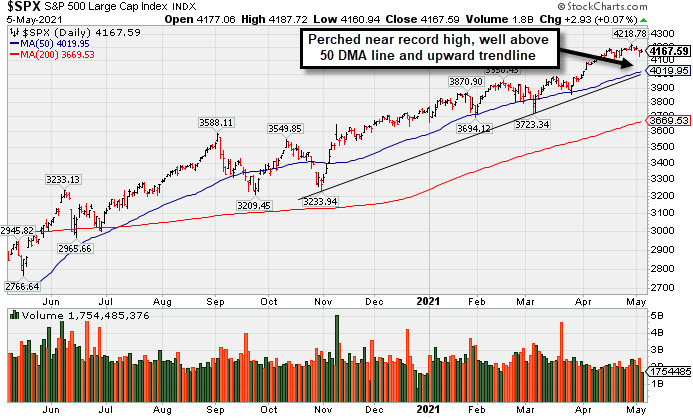
The Dow closed at a fresh all-time high, rising 97 points to 34,230, while the S&P 500 added 0.1%. The Nasdaq Composite fell 0.4% after toggling between gains and losses, and follows a 1.9% decline on Tuesday that had been its biggest drop since mid-March. The volume totals reported were lighter than the prior session on the NYSE and on the Nasdaq exchange. Breadth was mixed as decliners led advancers by an 11-9 margin on the Nasdaq exchange while advancers led decliners by an 8-7 margin on the NYSE. There were 98 high-ranked companies from the Leaders List that hit new 52-week highs and were listed on the BreakOuts Page, versus the total of 72 on the prior session. New 52-week highs totals expanded and outnumbered shrinking new 52-week lows totals on both the NYSE and the Nasdaq exchange. The major indices (M criteria) are in a confirmed uptrend. Investors are reminded to always make buying and selling decisions on case-by-case basis under the strict criteria and rules of the fact-based investment system.
PICTURED: The S&P 500 Index is perched within close striking distance of its record high. It is consolidating well above its 50-day moving average (DMA) line and upward trendline.
U.S. stocks fluctuated on Wednesday as investors assessed another round of economic updates and corporate earnings reports. On the data front, the Institute for Supply Management (ISM) revealed the pace of U.S. services sector expansion unexpectedly slowed in April, though the PMI print still represented the second-strongest reading on record. Separately, a report from ADP showed private payrolls increased by the most in seven months in April with a 742,000 addition. Treasuries strengthened, with the yield on the 10-year note down two basis points to 1.57%. In commodities, WTI crude slipped 0.6% to $65.30/barrel as market participants weighed a larger-than-anticipated drawdown in weekly crude stockpiles against a surprise build in gasoline inventories.
Six of 11 S&P 500 are ended in negative territory. In corporate news, shares of Moderna (MRNA -6.19%) fell after the Biden administration voiced support for waiving intellectual property protections for COVID-19 vaccines. Boeing (BA -2.33%) fell following a request by the FAA to provide updated proof that its 737-MAX aircrafts would not be impacted by electrical grounding problems. Elsewhere, Under Armour (UA +7.15%) rose following a trio of analyst upgrades. Peloton Interactive (PTON -14.56%) fell after the company recalled its treadmill due to safety concerns. In earnings, General Motors (GM +4.05%.) and Activision Blizzard (ATVI +1.57%) both rose following upbeat quarterly results. |
 Kenneth J. Gruneisen started out as a licensed stockbroker in August 1987, a couple of months prior to the historic stock market crash that took the Dow Jones Industrial Average down -22.6% in a single day. He has published daily fact-based fundamental and technical analysis on high-ranked stocks online for two decades. Through FACTBASEDINVESTING.COM, Kenneth provides educational articles, news, market commentary, and other information regarding proven investment systems that work in good times and bad.
Comments contained in the body of this report are technical opinions only and are not necessarily those of Gruneisen Growth Corp. The material herein has been obtained from sources believed to be reliable and accurate, however, its accuracy and completeness cannot be guaranteed. Our firm, employees, and customers may effect transactions, including transactions contrary to any recommendation herein, or have positions in the securities mentioned herein or options with respect thereto. Any recommendation contained in this report may not be suitable for all investors and it is not to be deemed an offer or solicitation on our part with respect to the purchase or sale of any securities. |
|
 |
Energy Groups Outpaced Financial and Semiconductor Index Gains
Kenneth J. Gruneisen - Passed the CAN SLIM® Master's Exam
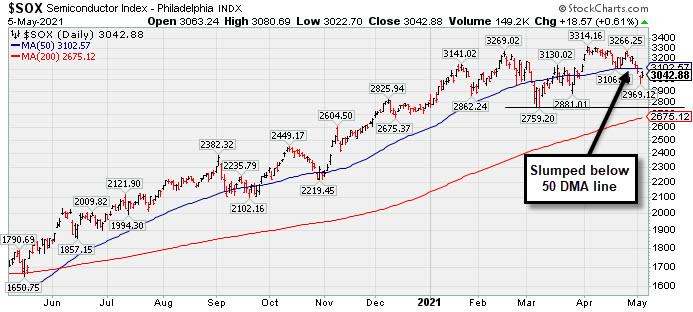
The Broker/Dealer Index ($XBD +1.63%) and Bank Index ($BKX +1.07%) posted gains while the Retail Index ($RLX -0.76%) edged lower. The Semiconductor Index ($SOX +0.55%) outpaced the Networking Index ($NWX +0.14%) while the Biotech Index ($BTK -0.41%) edged lower. The Oil Services Index ($OSX +5.42%) and Integrated Oil Index ($XOI +3.47%) both posted standout gains while the Gold & Silver Index ($XAU +1.03%) also rose. PICTURED: The Semiconductor Index ($SOX +0.55%) has recently slumped back below its 50-day moving average (DMA) line.
| Oil Services |
$OSX |
58.01 |
+2.98 |
+5.42% |
+30.87% |
| Integrated Oil |
$XOI |
1,079.40 |
+36.16 |
+3.47% |
+36.21% |
| Semiconductor |
$SOX |
3,040.80 |
+16.50 |
+0.55% |
+8.77% |
| Networking |
$NWX |
786.68 |
+1.07 |
+0.14% |
+9.70% |
| Broker/Dealer |
$XBD |
464.47 |
+7.45 |
+1.63% |
+23.01% |
| Retail |
$RLX |
3,875.99 |
-29.74 |
-0.76% |
+8.78% |
| Gold & Silver |
$XAU |
148.09 |
+1.51 |
+1.03% |
+2.71% |
| Bank |
$BKX |
130.66 |
+1.38 |
+1.07% |
+33.45% |
| Biotech |
$BTK |
5,468.85 |
-22.33 |
-0.41% |
-4.71% |
|
|
|
 |
Rocky Brands Powered Higher After Strong Earnings
Kenneth J. Gruneisen - Passed the CAN SLIM® Master's Exam
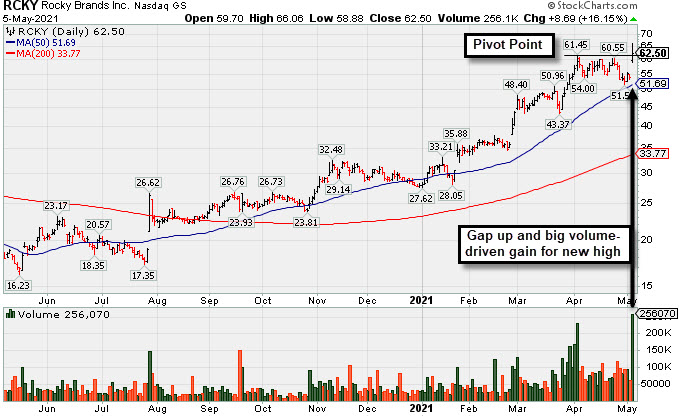
Rocky Brands Inc (RCKY +$8.69 or +16.15% to $62.50) finished in the middle of its intra-day range and above the pivot point after highlighted in yellow with pivot point cited based on its 4/05/21 high following a 4-week square box base in the earlier mid-day report (read here). It gapped up today hitting a new all-time high with a big volume-driven gain triggering a technical buy signal.
Bullish action came after it reported Mar '21 quarterly earnings +341% on +57% sales revenues versus the year ago period, its 3rd strong quarterly comparison. Annual earnings (A criteria) history has been strong since a downturn in FY '16. It has the highest possible Earnings Per Share Rating of 99.
The number of top-rated funds owning its shares reportedly only rose from 209 in Sep '20 to 212 in Mar '21, however its current Up/Down Volume Ratio of 1.9 is an unbiased indication its shares have been under accumulation over then past 50 days. It has only 7.3 million shares outstanding (S criteria) which can contribute to greater price volatility in the event of institutional buying or selling. |
|
|
Color Codes Explained :
Y - Better candidates highlighted by our
staff of experts.
G - Previously featured
in past reports as yellow but may no longer be buyable under the
guidelines.
***Last / Change / Volume data in this table is the closing quote data***
Symbol/Exchange
Company Name
Industry Group |
PRICE |
CHANGE
(%Change) |
Day High |
Volume
(% DAV)
(% 50 day avg vol) |
52 Wk Hi
% From Hi |
Featured
Date |
Price
Featured |
Pivot Featured |
|
Max Buy |
 SIVB
-
NASDAQ
SIVB
-
NASDAQ
S V B Financial Group
BANKING - Regional - Pacific Banks
|
$581.59
|
+8.66
1.51% |
$585.34
|
298,816
53.08% of 50 DAV
50 DAV is 563,000
|
$586.78
-0.88%
|
4/23/2021
|
$579.70
|
PP = $577.16
|
|
MB = $606.02
|
 Most Recent Note - 5/5/2021 5:39:19 PM
Y - Posted another gain today with below average volume, wedging higher for a best-ever close. Confirming volume-driven gains are still needed to help clinch a convincing technical buy signal. Bullish action came after it reported earnings +293% on +64% sales revenues for the Mar '21 quarter versus the year ago period, its 3rd strong comparison. Completed a new Public Offering on 3/24/21.
>>> FEATURED STOCK ARTICLE : Hit New High But Closed Below Pivot Point - 4/23/2021 |
View all notes |
Set NEW NOTE alert |
Company Profile |
SEC
News |
Chart |
Request a new note
C
A
S
I |
CROX
-
NASDAQ
Crocs Inc
CONSUMER NON-DURABLES - Textile - Apparel Footwear
|
$106.36
|
+2.66
2.57% |
$107.75
|
1,577,462
115.48% of 50 DAV
50 DAV is 1,366,000
|
$104.00
2.27%
|
4/27/2021
|
$99.81
|
PP = $86.50
|
|
MB = $90.83
|
Most Recent Note - 5/4/2021 5:46:16 PM
G - Hit another new all-time high with today's volume-driven gain, getting very extended from the latest base. Prior highs in the $86 area define initial support to watch on pullbacks.
>>> FEATURED STOCK ARTICLE : Powerful "Breakaway Gap" for CROX - 4/27/2021 |
View all notes |
Set NEW NOTE alert |
Company Profile |
SEC
News |
Chart |
Request a new note
C
A
S
I |
RCKY
-
NASDAQ
Rocky Brands Inc
CONSUMER NON-DURABLES - Textile - Apparel Footwear
|
$62.50
|
+8.69
16.15% |
$66.06
|
256,070
324.14% of 50 DAV
50 DAV is 79,000
|
$61.45
1.71%
|
5/5/2021
|
$61.65
|
PP = $61.55
|
|
MB = $64.63
|
Most Recent Note - 5/5/2021 5:37:35 PM
Y - Finished in the middle of its intra-day range after highlighted in yellow in the earlier mid-day report with a pivot point cited based on its 4/05/21 high following a 4-week square box base. Gapped up hitting a new all-time high and triggering a technical buy signal with a big volume-driven gain. Bullish action came after it reported Mar '21 quarterly earnings +341% on +57% sales revenues versus the year ago period, its 3rd strong quarterly comparison. Annual earnings (A criteria) history has been strong since a downturn in FY '16. See the latest FSU analysis for more details and a new annotated graph.
There are no Featured Stock Updates™ available for this stock at this time. You may request one by clicking the Request a New Note link below |
View all notes |
Set NEW NOTE alert |
Company Profile |
SEC
News |
Chart |
Request a new note
C
A
S
I |
CRL
-
NYSE
Charles River Labs Intl
DRUGS - Biotechnology
|
$345.21
|
+6.25
1.84% |
$349.13
|
669,045
217.93% of 50 DAV
50 DAV is 307,000
|
$343.47
0.51%
|
12/17/2020
|
$247.06
|
PP = $257.98
|
|
MB = $270.88
|
Most Recent Note - 5/5/2021 5:48:23 PM
G - Hit yet another new all-time high with today's 2nd consecutive volume-driven gain, getting more extended from any sound base. Its 50 DMA line ($301) acted as support throughout its ongoing ascent. Reported Mar '21 quarterly earnings +38% on +17%v sales revenues versus the year ago period. Two of the past 3 quarterly comparisons have been above the +25% minimum earnings guideline (C criteria).
>>> FEATURED STOCK ARTICLE : Perched at Record High After Rally From 50-Day Moving Average - 4/9/2021 |
View all notes |
Set NEW NOTE alert |
Company Profile |
SEC
News |
Chart |
Request a new note
C
A
S
I |
CAMT
-
NASDAQ
Camtek Ltd
ELECTRONICS - Scientific and Technical Instrum
|
$31.50
|
-0.28
-0.88% |
$33.02
|
459,834
146.91% of 50 DAV
50 DAV is 313,000
|
$36.14
-12.84%
|
4/28/2021
|
$35.03
|
PP = $35.34
|
|
MB = $37.11
|
Most Recent Note - 5/5/2021 12:21:59 PM
Y - Holding its ground today. Volume was higher on the prior session behind a 4th consecutive loss, action indicative of distributional pressure. Subsequent gains and a strong close above the pivot point backed by at least +40% above average volume are needed to trigger a technical buy signal. Completed a new Public Offering on 11/19/20. Found prompt support near its 50 DMA line ($30.75) during recent consolidations. Reported earnings +267% on +90% sales revenues for the Mar '21 quarter versus the year ago period, its 3rd strong quarterly comparison well above the +25% minimum guideline and showing impressive sequential acceleration. This Israeli Electronics firm has a strong annual earnings (A criteria) history.
>>> FEATURED STOCK ARTICLE : Earnings Acceleration and Perched at High After Ascending Base - 4/28/2021 |
View all notes |
Set NEW NOTE alert |
Company Profile |
SEC
News |
Chart |
Request a new note
C
A
S
I |
Symbol/Exchange
Company Name
Industry Group |
PRICE |
CHANGE
(%Change) |
Day High |
Volume
(% DAV)
(% 50 day avg vol) |
52 Wk Hi
% From Hi |
Featured
Date |
Price
Featured |
Pivot Featured |
|
Max Buy |
BRKS
-
NASDAQ
Brooks Automation
ELECTRONICS - Semiconductor Equipment and Mate
|
$94.70
|
+2.19
2.37% |
$95.72
|
615,409
80.55% of 50 DAV
50 DAV is 764,000
|
$108.72
-12.90%
|
4/5/2021
|
$99.31
|
PP = $91.88
|
|
MB = $96.47
|
Most Recent Note - 5/4/2021 5:41:59 PM
Y - Volume was above average behind today's 4th consecutive loss. Color code is changed to yellow while testing support near prior highs in the $91 area and its 50 DMA line ($89.92). More damaging losses would raise concerns and trigger technical sell signals.
>>> FEATURED STOCK ARTICLE : Extended From Base and Consolidating After Recent Rally - 4/30/2021 |
View all notes |
Set NEW NOTE alert |
Company Profile |
SEC
News |
Chart |
Request a new note
C
A
S
I |
ENTG
-
NASDAQ
Entegris Inc
ELECTRONICS - Semiconductor Equipment and Mate
|
$110.70
|
+1.81
1.66% |
$112.08
|
661,273
71.65% of 50 DAV
50 DAV is 922,900
|
$126.41
-12.43%
|
4/1/2021
|
$118.42
|
PP = $110.37
|
|
MB = $115.89
|
Most Recent Note - 5/4/2021 5:50:12 PM
G - Color code is changed to green after a volume-driven loss today, slumping below the prior high in the $110 area and closing below its 50 DMA line ($109.54). Only a prompt rebound would help its outlook improve.
>>> FEATURED STOCK ARTICLE : Negated Recent Breakout and Sputtering Near Prior High - 4/22/2021 |
View all notes |
Set NEW NOTE alert |
Company Profile |
SEC
News |
Chart |
Request a new note
C
A
S
I |
OPY
-
NYSE
Oppenheimer Holdings Inc
FINANCIAL SERVICES - Investment Brokerage - Regiona
|
$50.34
|
+1.35
2.76% |
$50.48
|
96,370
75.29% of 50 DAV
50 DAV is 128,000
|
$52.45
-4.02%
|
2/25/2021
|
$38.95
|
PP = $38.11
|
|
MB = $40.02
|
Most Recent Note - 5/4/2021 12:40:38 PM
G - Powered higher in recent weeks and it is very extended from any sound base. Bullish action came after it reported Mar '21 quarterly earnings +402% on +59% sales revenues versus the year ago period. Prior high in the $44 area defines initial support to watch above its 50 DMA line ($42.67).
>>> FEATURED STOCK ARTICLE : Negative Reversal After 7 Consecutive Gains - 4/20/2021 |
View all notes |
Set NEW NOTE alert |
Company Profile |
SEC
News |
Chart |
Request a new note
C
A
S
I |
LAD
-
NYSE
Lithia Motors Inc Cl A
SPECIALTY RETAIL - Auto Dealerships
|
$381.20
|
-8.84
-2.27% |
$394.45
|
276,696
91.32% of 50 DAV
50 DAV is 303,000
|
$417.98
-8.80%
|
4/21/2021
|
$377.00
|
PP = $418.08
|
|
MB = $438.98
|
Most Recent Note - 5/5/2021 5:44:36 PM
G - Volume was higher (near average ) as it sputtered to a close below its 50 DMA line ($386) and its color code is changed to green. A prompt rebound above its 50 DMA line is needed for its outlook to improve. Subsequent gains above the pivot point backed by at least +40% above average volume are needed to trigger a technical buy signal.
>>> FEATURED STOCK ARTICLE : Building a Base With Rebound Above 50-Day Moving Average - 4/21/2021 |
View all notes |
Set NEW NOTE alert |
Company Profile |
SEC
News |
Chart |
Request a new note
C
A
S
I |
CLFD
-
NASDAQ
Clearfield Inc
TELECOMMUNICATIONS - Cables / Satalite Equipment
|
$37.39
|
+1.30
3.60% |
$37.46
|
119,123
83.30% of 50 DAV
50 DAV is 143,000
|
$40.26
-7.13%
|
4/26/2021
|
$39.68
|
PP = $38.85
|
|
MB = $40.79
|
Most Recent Note - 5/3/2021 6:17:41 PM
Y - Posted a gain today, halting a streak of 4 consecutive losses. More damaging losses would raise greater concerns while it is sputtering back below the prior high. Fundamentals remain strong after it reported Mar '21 quarterly earnings +440% on +45% sales revenues versus the year ago period, continuing its strong earnings track record.
>>> FEATURED STOCK ARTICLE : Rallied Straight Up From Bottom of 10-Week Base - 4/26/2021 |
View all notes |
Set NEW NOTE alert |
Company Profile |
SEC
News |
Chart |
Request a new note
C
A
S
I |
Symbol/Exchange
Company Name
Industry Group |
PRICE |
CHANGE
(%Change) |
Day High |
Volume
(% DAV)
(% 50 day avg vol) |
52 Wk Hi
% From Hi |
Featured
Date |
Price
Featured |
Pivot Featured |
|
Max Buy |
EDUC
-
NASDAQ
Educational Development
WHOLESALE - Basic Materials Wholesale
|
$17.54
|
-0.21
-1.18% |
$17.65
|
15,584
62.34% of 50 DAV
50 DAV is 25,000
|
$20.00
-12.30%
|
3/10/2021
|
$17.89
|
PP = $20.10
|
|
MB = $21.11
|
Most Recent Note - 5/4/2021 5:47:42 PM
Y - Volume totals have been cooling while consolidating above its 50 DMA line ($17.32) which defines important near-term support. Met stubborn resistance in the $19-20 area. Subsequent gains above the pivot point backed by at least +40% above average volume are needed to trigger a proper technical buy signal.
>>> FEATURED STOCK ARTICLE : Finding Support During Consolidation Above 50-Day Moving Average - 4/16/2021 |
View all notes |
Set NEW NOTE alert |
Company Profile |
SEC
News |
Chart |
Request a new note
C
A
S
I |
SMPL
-
NASDAQ
Simply Good Foods Co
Food-Confectionery
|
$33.92
|
+0.06
0.18% |
$34.99
|
184,579
26.52% of 50 DAV
50 DAV is 696,000
|
$35.34
-4.02%
|
12/28/2020
|
$30.40
|
PP = $31.44
|
|
MB = $33.01
|
Most Recent Note - 4/30/2021 5:41:18 PM
G - Perched at its all-time high with volume totals cooling. Reported Feb '21 quarterly earnings +9% on +2% sales revenues versus the year ago period, below the +25% minimum earnings guideline (C criteria), raising fundamental concerns. Found prompt support near its 50 DMA line ($31.66) but its current Relative Strength Rating is 79, one notch below the 80+ minimum guideline for buy candidates.
>>> FEATURED STOCK ARTICLE : Perched Near High But Fundamental Concerns Were Raised - 4/14/2021 |
View all notes |
Set NEW NOTE alert |
Company Profile |
SEC
News |
Chart |
Request a new note
C
A
S
I |
IBP
-
NYSE
Installed Building Prod
DIVERSIFIED SERVICES - Business/Management Services
|
$138.79
|
-0.80
-0.57% |
$140.58
|
299,895
136.32% of 50 DAV
50 DAV is 220,000
|
$139.82
-0.74%
|
4/19/2021
|
$131.15
|
PP = $130.21
|
|
MB = $136.72
|
Most Recent Note - 5/5/2021 5:42:12 PM
G - Color code is changed to green as it touched another new all-time high above is "max buy" level today but reversed into the red for a loss backed by higher (above average) volume. Prior high in the $130 area defines initial support to watch on pullbacks.
>>> FEATURED STOCK ARTICLE : Steady Streak of Gains Into New High Territory - 4/19/2021 |
View all notes |
Set NEW NOTE alert |
Company Profile |
SEC
News |
Chart |
Request a new note
C
A
S
I |
QRVO
-
NASDAQ
"Qorvo, Inc"
ELECTRONICS - Semiconductor - Integrated Cir
|
$182.56
|
+0.15
0.08% |
$186.90
|
1,465,307
130.21% of 50 DAV
50 DAV is 1,125,300
|
$201.68
-9.48%
|
4/1/2021
|
$190.48
|
PP = $191.92
|
|
MB = $201.52
|
Most Recent Note - 4/30/2021 5:34:24 PM
Y - Gapped down today for a big volume-driven loss after again edging higher with gains backed by lighter than average volume. Its 50 DMA line ($182.72) acted as support when it stalled after recently wedging up to new highs from a 9-week base. Its Relative Strength Rating is 73, below the 80+ minimum for buy candidates. See the latest FSU analysis for more details and an annotated graph.
>>> FEATURED STOCK ARTICLE : Quiet Gain For Best Ever Close - 4/29/2021 |
View all notes |
Set NEW NOTE alert |
Company Profile |
SEC
News |
Chart |
Request a new note
C
A
S
I |
YETI
-
NYSE
Yeti Holdings Inc
Leisure-Products
|
$86.70
|
-0.87
-0.99% |
$87.67
|
718,955
56.97% of 50 DAV
50 DAV is 1,262,000
|
$89.70
-3.34%
|
4/6/2021
|
$76.95
|
PP = $79.42
|
|
MB = $83.39
|
Most Recent Note - 4/30/2021 5:42:45 PM
G - Pulled back today with higher volume after quietly hovering near its all-time high this week, extended from the latest base. Prior highs in the $80 area define initial support to watch on pullbacks.
>>> FEATURED STOCK ARTICLE : Hovering Near Record High Following Volume-Driven Gains - 5/3/2021 |
View all notes |
Set NEW NOTE alert |
Company Profile |
SEC
News |
Chart |
Request a new note
C
A
S
I |
Symbol/Exchange
Company Name
Industry Group |
PRICE |
CHANGE
(%Change) |
Day High |
Volume
(% DAV)
(% 50 day avg vol) |
52 Wk Hi
% From Hi |
Featured
Date |
Price
Featured |
Pivot Featured |
|
Max Buy |
MRBK
-
NASDAQ
Meridian Corp
Banks-Northeast
|
$26.11
|
-0.07
-0.27% |
$26.58
|
37,207
100.56% of 50 DAV
50 DAV is 37,000
|
$27.96
-6.62%
|
2/22/2021
|
$25.58
|
PP = $26.10
|
|
MB = $27.41
|
Most Recent Note - 5/5/2021 5:46:35 PM
Y - Suffered a 4th consecutive small loss today, still consolidating above its 50 DMA line ($25.83) and perched within striking distance of its 52-week high. Reported Mar '21 earnings +323% on +93% sales revenues versus the year ago period, continuing its strong earnings track record. Recent low ($24.01 on 4/21/21) defines important near-term support where any violation may trigger a worrisome technical sell signal. Its Relative Strength Rating is 76, below the 80 minimum guideline, however it is perched only -6.6% off its high..
>>> FEATURED STOCK ARTICLE : Encountering Distributional Pressure - 4/12/2021 |
View all notes |
Set NEW NOTE alert |
Company Profile |
SEC
News |
Chart |
Request a new note
C
A
S
I |
|
|
|
THESE ARE NOT BUY RECOMMENDATIONS!
Comments contained in the body of this report are technical
opinions only. The material herein has been obtained
from sources believed to be reliable and accurate, however,
its accuracy and completeness cannot be guaranteed.
This site is not an investment advisor, hence it does
not endorse or recommend any securities or other investments.
Any recommendation contained in this report may not
be suitable for all investors and it is not to be deemed
an offer or solicitation on our part with respect to
the purchase or sale of any securities. All trademarks,
service marks and trade names appearing in this report
are the property of their respective owners, and are
likewise used for identification purposes only.
This report is a service available
only to active Paid Premium Members.
You may opt-out of receiving report notifications
at any time. Questions or comments may be submitted
by writing to Premium Membership Services 665 S.E. 10 Street, Suite 201 Deerfield Beach, FL 33441-5634 or by calling 1-800-965-8307
or 954-785-1121.
|
|
|