You are not logged in.
This means you
CAN ONLY VIEW reports that were published prior to Thursday, March 20, 2025.
You
MUST UPGRADE YOUR MEMBERSHIP if you want to see any current reports.
AFTER MARKET UPDATE - MONDAY, MAY 17TH, 2021
Previous After Market Report Next After Market Report >>>
|
|
|
|
DOW |
-54.34 |
34,327.79 |
-0.16% |
|
Volume |
880,387,416 |
+3% |
|
Volume |
3,965,349,000 |
-1% |
|
NASDAQ |
-52.90 |
13,377.08 |
-0.39% |
|
Advancers |
1,741 |
53% |
|
Advancers |
2,193 |
52% |
|
S&P 500 |
-10.56 |
4,163.29 |
-0.25% |
|
Decliners |
1,526 |
47% |
|
Decliners |
2,007 |
48% |
|
Russell 2000 |
+2.49 |
2,227.12 |
+0.11% |
|
52 Wk Highs |
179 |
|
|
52 Wk Highs |
128 |
|
|
S&P 600 |
+2.01 |
1,356.83 |
+0.15% |
|
52 Wk Lows |
41 |
|
|
52 Wk Lows |
79 |
|
|
 |
Major Indices Fell While Advancers Narrowly Led Decliners
Kenneth J. Gruneisen - Passed the CAN SLIM® Master's Exam
The Dow fell 54 points, while the S&P 500 was down 0.3%. The Nasdaq Composite lost 0.4%, with the benchmark capping its fourth straight weekly drop on Friday - its longest such losing streak since August 2019. The volume totals reported were mixed, higher than the prior session on the NYSE and slightly lighter on the Nasdaq exchange. Breadth was slightly positive as advancers led decliners by a narrow margin on the NYSE and on the Nasdaq exchange. There were 42 high-ranked companies from the Leaders List that hit new 52-week highs and were listed on the BreakOuts Page, versus 44 on the prior session, still down considerably from the total of 171 on last Monday's session. New 52-week highs outnumbered new 52-week lows on both the NYSE and the Nasdaq exchange. The major indices (M criteria) are in a confirmed uptrend. Investors are reminded to always make buying and selling decisions on case-by-case basis under the strict criteria and rules of the fact-based investment system.
PICTURED: The Dow Jones Industrial Average recently found support above its 50-day moving average (DMA) line.
U.S. stocks finished lower on Monday, resuming a downturn as inflationary concerns remained front of mind. Last week, the major averages weathered their steepest weekly slide since February as consumer price inflation (CPI) jumped the most since the onset of the Financial Crisis. Still, Fed leaders have continued to reiterate that inflation should prove to be “transitory.” Fed Vice Chair Richard Clarida was the latest official to echo this sentiment on Monday, also noting that the U.S. economy had not yet achieved the “substantial further progress” needed for the central bank to start dialing back asset purchases.
Treasuries weakened modestly, with the yield on the 10-year note up one basis point to 1.64%. In commodities, WTI crude rose 1.4% to $66.31/barrel as optimism over U.S. and European reopenings appeared to overshadow a flare-up in COVID-19 cases in much of Asia. COMEX gold climbed 1.6% to $1,866.80/ounce, its highest level since early February.
Seven of 11 S&P 500 sectors closed in negative territory, with Communication Services, Utilities, and Technology leading the decline. Meanwhile, the more cyclical and value-oriented groups outperformed, with Energy and Materials among the standouts. In M&A news, Discovery, Inc. (DISCA -5.05%) and AT&T (T -2.67%) both dipped despite confirmation the two companies would combine their media content assets to form a new entertainment and media business. |
 Kenneth J. Gruneisen started out as a licensed stockbroker in August 1987, a couple of months prior to the historic stock market crash that took the Dow Jones Industrial Average down -22.6% in a single day. He has published daily fact-based fundamental and technical analysis on high-ranked stocks online for two decades. Through FACTBASEDINVESTING.COM, Kenneth provides educational articles, news, market commentary, and other information regarding proven investment systems that work in good times and bad.
Comments contained in the body of this report are technical opinions only and are not necessarily those of Gruneisen Growth Corp. The material herein has been obtained from sources believed to be reliable and accurate, however, its accuracy and completeness cannot be guaranteed. Our firm, employees, and customers may effect transactions, including transactions contrary to any recommendation herein, or have positions in the securities mentioned herein or options with respect thereto. Any recommendation contained in this report may not be suitable for all investors and it is not to be deemed an offer or solicitation on our part with respect to the purchase or sale of any securities. |
|
 |
Commodity-Linked Groups Outpaced Retail and Bank Index
Kenneth J. Gruneisen - Passed the CAN SLIM® Master's Exam
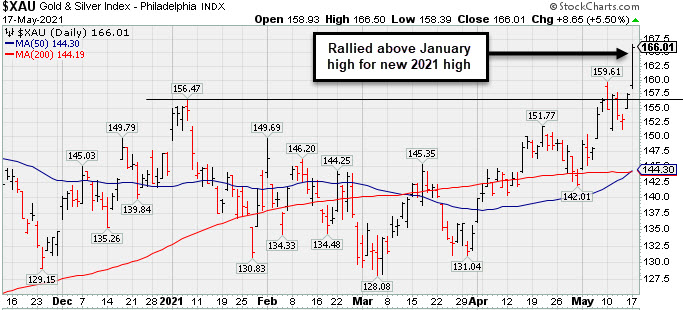
The Gold & Silver Index ($XAU +5.50%) posted a standout gain while the Oil Services Index ($OSX +3.09%) and Integrated Oil Index ($XOI +1.90%) also rallied for solid gains. The Retail Index ($RLX +0.47%) and Bank Index ($BKX +0.64%) both posted modest gains while the Broker/Dealer Index ($XBD -0.27%) edged lower. The tech sector had a negative bias as the Biotech Index ($BTK -0.91%) and Semiconductor Index ($SOX -0.90%) both ended with small losses while the Networking Index ($NWX -0.07%) finished flat.
PICTURED: The Gold & Silver Index ($XAU +5.50%) rallied above its January high for new 2021 high.
| Oil Services |
$OSX |
63.86 |
+1.92 |
+3.09% |
+44.05% |
| Integrated Oil |
$XOI |
1,120.31 |
+20.86 |
+1.90% |
+41.37% |
| Semiconductor |
$SOX |
2,954.51 |
-26.91 |
-0.90% |
+5.69% |
| Networking |
$NWX |
794.73 |
-0.57 |
-0.07% |
+10.82% |
| Broker/Dealer |
$XBD |
467.47 |
-1.25 |
-0.27% |
+23.80% |
| Retail |
$RLX |
3,844.80 |
+18.02 |
+0.47% |
+7.90% |
| Gold & Silver |
$XAU |
166.01 |
+8.65 |
+5.50% |
+15.13% |
| Bank |
$BKX |
134.54 |
+0.85 |
+0.64% |
+37.41% |
| Biotech |
$BTK |
5,514.20 |
-50.37 |
-0.91% |
-3.92% |
|
|
|
 |
Extended From Any Sound Base After Decent Rally
Kenneth J. Gruneisen - Passed the CAN SLIM® Master's Exam
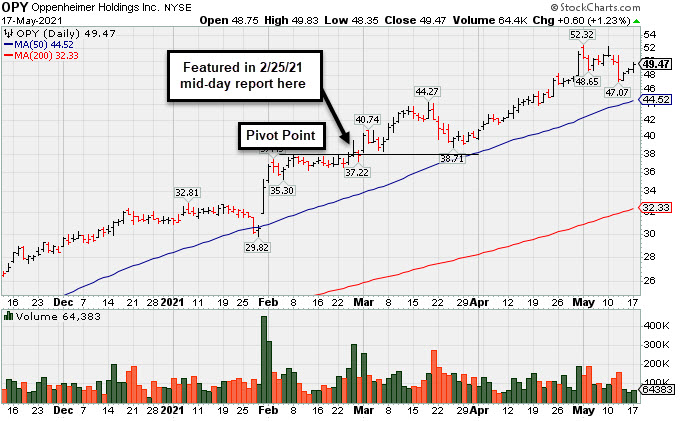
Oppenheimer Holdings Inc (OPY +$0.60 or +1.23% to $49.47) posted a 3rd consecutive quiet gain today, hovering near its all-time high, very extended from any sound base. Bullish action came after it reported Mar '21 quarterly earnings +402% on +59% sales revenues versus the year ago period. The prior high in the $44 area defines initial support to watch coinciding with its 50-day moving average (DMA) line ($44.62).
OPY traded up as much as +34.7% since first highlighted in yellow with pivot point cited based on its 2/05/21 high plus 10 cents in the 2/25/21 mid-day report (read here). It was shown in the FSU section on 4/20/21 with an annotated graph under the headline, "Negative Reversal After 7 Consecutive Gains" .
OPY made progress since noted in the 2/05/21 mid-day report - "Reported Dec '20 quarterly earnings +235% on +43% sales revenues versus the year ago period. Showed strong earnings increases over the year ago period in the past 3 quarterly comparisons. Annual earnings (A criteria) growth has been strong after a downturn and losses in FY '15 & '16." It has the highest possible Earnings Per Share Rating of 99.
The company hails from the FINANCIAL SERVICES - Investment Brokerage - Regional industry group which is now ranked 33rd on the 197 Industry Groups list (L criteria). There is a small supply of only 9.2 million shares in the publicly traded float (S criteria) which can contribute to greater price volatility in the event of institutional buying or selling. The number of top-rated funds owning its shares reportedly fell from 212 in Jun '20 to 212 in Mar '21, however, its current Up/Down Volume Ratio of 1.3 is an unbiased indication its shares have been under slight accumulation over the past 50 days (I criteria).
|
|
|
Color Codes Explained :
Y - Better candidates highlighted by our
staff of experts.
G - Previously featured
in past reports as yellow but may no longer be buyable under the
guidelines.
***Last / Change / Volume data in this table is the closing quote data***
Symbol/Exchange
Company Name
Industry Group |
PRICE |
CHANGE
(%Change) |
Day High |
Volume
(% DAV)
(% 50 day avg vol) |
52 Wk Hi
% From Hi |
Featured
Date |
Price
Featured |
Pivot Featured |
|
Max Buy |
 SIVB
-
NASDAQ
SIVB
-
NASDAQ
S V B Financial Group
BANKING - Regional - Pacific Banks
|
$577.54
|
-0.88
-0.15% |
$580.67
|
143,960
25.52% of 50 DAV
50 DAV is 564,000
|
$595.90
-3.08%
|
4/23/2021
|
$579.70
|
PP = $577.16
|
|
MB = $606.02
|
Most Recent Note - 5/14/2021 5:24:06 PM
Y - Posted a second consecutive gain with light volume, hovering near its high. Confirming volume-driven gains are still needed to help clinch a convincing technical buy signal. Bullish action came after it reported earnings +293% on +64% sales revenues for the Mar '21 quarter versus the year ago period, its 3rd strong comparison. Completed a new Public Offering on 3/24/21.
>>> FEATURED STOCK ARTICLE : Hit New High But Closed Below Pivot Point - 4/23/2021 |
View all notes |
Set NEW NOTE alert |
Company Profile |
SEC
News |
Chart |
Request a new note
C
A
S
I |
CROX
-
NASDAQ
Crocs Inc
CONSUMER NON-DURABLES - Textile - Apparel Footwear
|
$103.88
|
+1.90
1.86% |
$103.99
|
1,097,297
78.10% of 50 DAV
50 DAV is 1,405,000
|
$109.91
-5.49%
|
4/27/2021
|
$99.81
|
PP = $86.50
|
|
MB = $90.83
|
Most Recent Note - 5/13/2021 6:03:53 PM
G - Posted a gain today with lighter volume following 3 consecutive losses from its all-time high. It is very extended from the latest base. Prior highs in the $86 area define initial support to watch on pullbacks.
>>> FEATURED STOCK ARTICLE : Powerful "Breakaway Gap" for CROX - 4/27/2021 |
View all notes |
Set NEW NOTE alert |
Company Profile |
SEC
News |
Chart |
Request a new note
C
A
S
I |
RCKY
-
NASDAQ
Rocky Brands Inc
CONSUMER NON-DURABLES - Textile - Apparel Footwear
|
$56.88
|
+1.09
1.95% |
$57.23
|
119,730
134.53% of 50 DAV
50 DAV is 89,000
|
$69.00
-17.57%
|
5/5/2021
|
$61.65
|
PP = $61.55
|
|
MB = $64.63
|
 Most Recent Note - 5/17/2021 5:51:59 PM
G - Halted its slide above its 50 DMA line ($54.30) after undercutting the prior high ($61) area raised concerns. Fundamentals remain strong. More damaging losses would raise serious concerns and trigger a technical sell signal.
>>> FEATURED STOCK ARTICLE : Rocky Brands Powered Higher After Strong Earnings - 5/5/2021 |
View all notes |
Set NEW NOTE alert |
Company Profile |
SEC
News |
Chart |
Request a new note
C
A
S
I |
CRL
-
NYSE
Charles River Labs Intl
DRUGS - Biotechnology
|
$322.71
|
-6.36
-1.93% |
$330.70
|
814,489
144.67% of 50 DAV
50 DAV is 563,000
|
$349.13
-7.57%
|
12/17/2020
|
$247.06
|
PP = $257.98
|
|
MB = $270.88
|
Most Recent Note - 5/14/2021 12:39:47 PM
G - Extended from any sound base, it abruptly retreated from its all-time high with a spurt of volume-driven losses. Its 50 DMA line ($307.75) defines near-term support above the prior high ($303). Reported Mar '21 quarterly earnings +38% on +17%v sales revenues versus the year ago period. Two of the past 3 quarterly comparisons have been above the +25% minimum earnings guideline (C criteria).
>>> FEATURED STOCK ARTICLE : Pulling Back From Record High Following Strong Quarterly Report - 5/6/2021 |
View all notes |
Set NEW NOTE alert |
Company Profile |
SEC
News |
Chart |
Request a new note
C
A
S
I |
CAMT
-
NASDAQ
Camtek Ltd
ELECTRONICS - Scientific and Technical Instrum
|
$27.22
|
-0.14
-0.51% |
$27.80
|
311,276
105.52% of 50 DAV
50 DAV is 295,000
|
$36.14
-24.68%
|
4/28/2021
|
$35.03
|
PP = $35.34
|
|
MB = $37.11
|
Most Recent Note - 5/14/2021 5:20:26 PM
G - Remains well below its 50 DMA line ($30.83) after damaging losses. A prompt rebound is needed for its outlook to improve. Subsequent gains and a strong close above the pivot point backed by at least +40% above average volume still are needed to trigger a technical buy signal.
>>> FEATURED STOCK ARTICLE : Earnings Acceleration and Perched at High After Ascending Base - 4/28/2021 |
View all notes |
Set NEW NOTE alert |
Company Profile |
SEC
News |
Chart |
Request a new note
C
A
S
I |
Symbol/Exchange
Company Name
Industry Group |
PRICE |
CHANGE
(%Change) |
Day High |
Volume
(% DAV)
(% 50 day avg vol) |
52 Wk Hi
% From Hi |
Featured
Date |
Price
Featured |
Pivot Featured |
|
Max Buy |
BRKS
-
NASDAQ
Brooks Automation
ELECTRONICS - Semiconductor Equipment and Mate
|
$90.79
|
-1.32
-1.43% |
$90.92
|
786,544
95.80% of 50 DAV
50 DAV is 821,000
|
$108.72
-16.49%
|
4/5/2021
|
$99.31
|
PP = $91.88
|
|
MB = $96.47
|
Most Recent Note - 5/13/2021 5:56:47 PM
G - Posted a volume-driven gain today but it is still sputtering below prior highs in the $91 area and also below its 50 DMA line ($91.12). More damaging losses would raise greater concerns.
>>> FEATURED STOCK ARTICLE : Extended From Base and Consolidating After Recent Rally - 4/30/2021 |
View all notes |
Set NEW NOTE alert |
Company Profile |
SEC
News |
Chart |
Request a new note
C
A
S
I |
OPY
-
NYSE
Oppenheimer Holdings Inc
FINANCIAL SERVICES - Investment Brokerage - Regiona
|
$49.47
|
+0.60
1.23% |
$49.83
|
64,383
55.50% of 50 DAV
50 DAV is 116,000
|
$52.45
-5.68%
|
2/25/2021
|
$38.95
|
PP = $38.11
|
|
MB = $40.02
|
Most Recent Note - 5/17/2021 5:47:07 PM
G - Posted a 3rd consecutive quiet gain, hovering near its all-time high, very extended from any sound base. Bullish action came after it reported Mar '21 quarterly earnings +402% on +59% sales revenues versus the year ago period. Prior high in the $44 area defines initial support to watch coinciding with its 50 DMA line. See the latest FSU analysis for more details and a new annotated graph.
>>> FEATURED STOCK ARTICLE : Extended From Any Sound Base After Decent Rally - 5/17/2021 |
View all notes |
Set NEW NOTE alert |
Company Profile |
SEC
News |
Chart |
Request a new note
C
A
S
I |
MTH
-
NYSE
Meritage Homes Corp
MATERIALS and CONSTRUCTION - Residential Construction
|
$111.86
|
-0.82
-0.73% |
$112.22
|
320,281
75.47% of 50 DAV
50 DAV is 424,400
|
$120.19
-6.93%
|
10/26/2004
|
$108.84
|
PP = $117.16
|
|
MB = $123.02
|
Most Recent Note - 5/13/2021 5:52:47 PM
Y - Posted a solid gain today, halting its slide following 2 consecutive volume-driven losses after hitting new 52-week highs with volume-driven gains. Subsequent gains above the pivot point with at least +40% above average volume would be a reassuring confirmation of fresh institutional buying demand. Reported earnings +88% on +20% sales revenues for the Mar '21 quarter versus the year ago period, its 7th consecutive strong quarterly comparison above the +25% minimum guideline (C criteria). Annual earnings (A criteria) history has been strong after a downturn in FY '15. See the latest FSU analysis for more details and a new annotated graph.
>>> FEATURED STOCK ARTICLE : Homebuilder Pulled Back After Hitting New High - 5/13/2021 |
View all notes |
Set NEW NOTE alert |
Company Profile |
SEC
News |
Chart |
Request a new note
C
A
S
I |
LAD
-
NYSE
Lithia Motors Inc Cl A
SPECIALTY RETAIL - Auto Dealerships
|
$366.09
|
-3.29
-0.89% |
$370.44
|
147,215
50.76% of 50 DAV
50 DAV is 290,000
|
$417.98
-12.41%
|
4/21/2021
|
$377.00
|
PP = $418.08
|
|
MB = $438.98
|
Most Recent Note - 5/14/2021 5:26:47 PM
G - Remains below its 50 DMA line ($385) following a noted streak of losses. A prompt rebound above its 50 DMA line is needed for its outlook to improve. Subsequent gains above the pivot point backed by at least +40% above average volume are needed to trigger a technical buy signal.
>>> FEATURED STOCK ARTICLE : Building a Base With Rebound Above 50-Day Moving Average - 4/21/2021 |
View all notes |
Set NEW NOTE alert |
Company Profile |
SEC
News |
Chart |
Request a new note
C
A
S
I |
MED
-
NYSE
Medifast Inc
SPECIALTY RETAIL - Specialty Retail, Other
|
$307.20
|
+10.20
3.43% |
$308.44
|
157,621
128.15% of 50 DAV
50 DAV is 123,000
|
$297.13
3.39%
|
5/11/2021
|
$285.72
|
PP = $279.56
|
|
MB = $293.54
|
Most Recent Note - 5/14/2021 5:22:57 PM
G - Color code is changed to green after it posted a big gain today rising above its "max buy" level with +27% above average volume for a best-ever close. Showed resilience after briefly slumping back into the prior base.
>>> FEATURED STOCK ARTICLE : Held Ground Following Breakout Gain on Prior Session - 5/11/2021 |
View all notes |
Set NEW NOTE alert |
Company Profile |
SEC
News |
Chart |
Request a new note
C
A
S
I |
Symbol/Exchange
Company Name
Industry Group |
PRICE |
CHANGE
(%Change) |
Day High |
Volume
(% DAV)
(% 50 day avg vol) |
52 Wk Hi
% From Hi |
Featured
Date |
Price
Featured |
Pivot Featured |
|
Max Buy |
CLFD
-
NASDAQ
Clearfield Inc
TELECOMMUNICATIONS - Cables / Satalite Equipment
|
$35.69
|
+0.35
0.99% |
$35.75
|
83,843
62.11% of 50 DAV
50 DAV is 135,000
|
$40.26
-11.35%
|
4/26/2021
|
$39.68
|
PP = $38.85
|
|
MB = $40.79
|
Most Recent Note - 5/13/2021 6:02:11 PM
Y - Posted a solid gain today following 3 consecutive losses with below average volume. Fundamentals remain strong after it reported Mar '21 quarterly earnings +440% on +45% sales revenues versus the year ago period, continuing its strong earnings track record.
>>> FEATURED STOCK ARTICLE : Rallied Straight Up From Bottom of 10-Week Base - 4/26/2021 |
View all notes |
Set NEW NOTE alert |
Company Profile |
SEC
News |
Chart |
Request a new note
C
A
S
I |
SMPL
-
NASDAQ
Simply Good Foods Co
Food-Confectionery
|
$31.69
|
-1.72
-5.15% |
$33.47
|
1,305,145
191.96% of 50 DAV
50 DAV is 679,900
|
$35.24
-10.07%
|
12/28/2020
|
$30.40
|
PP = $31.44
|
|
MB = $33.01
|
Most Recent Note - 5/17/2021 12:51:45 PM
G - Again undercutting its 50 DMA line ($32.68) with today's loss backed by above average volume, raising concerns. Reported Feb '21 quarterly earnings +9% on +2% sales revenues versus the year ago period, below the +25% minimum earnings guideline (C criteria), raising fundamental concerns. Its current Relative Strength Rating is 77, below the 80+ minimum guideline for buy candidates.
>>> FEATURED STOCK ARTICLE : Hovering Near All-Time High Following Lackluster Quarter - 5/10/2021 |
View all notes |
Set NEW NOTE alert |
Company Profile |
SEC
News |
Chart |
Request a new note
C
A
S
I |
IBP
-
NYSE
"Installed Building Products, Inc"
DIVERSIFIED SERVICES - Business/Management Services
|
$120.90
|
-2.42
-1.96% |
$122.50
|
203,293
82.04% of 50 DAV
50 DAV is 247,800
|
$140.58
-14.00%
|
4/19/2021
|
$131.15
|
PP = $130.21
|
|
MB = $136.72
|
Most Recent Note - 5/14/2021 5:18:20 PM
G - Showed resilience late this week with quiet gains while rebounding above its 50 DMA line ($121). More damaging losses would raise serious concerns. Weak action came after it reported Mar '21 quarterly earnings +15% on +10% sales revenues versus the year ago period, below the +25% minimum earnings guideline (C criteria) raising fundamental concerns. See the latest FSU analysis for more details and a new annotated graph.
>>> FEATURED STOCK ARTICLE : Rebound Above 50-Day Moving Average Helped Technical Stance - 5/14/2021 |
View all notes |
Set NEW NOTE alert |
Company Profile |
SEC
News |
Chart |
Request a new note
C
A
S
I |
QRVO
-
NASDAQ
"Qorvo, Inc"
ELECTRONICS - Semiconductor - Integrated Cir
|
$171.08
|
+0.07
0.04% |
$171.42
|
1,252,966
104.05% of 50 DAV
50 DAV is 1,204,200
|
$201.68
-15.17%
|
4/1/2021
|
$190.48
|
PP = $191.92
|
|
MB = $201.52
|
Most Recent Note - 5/14/2021 12:56:51 PM
G - Halted its slide this week after violating its 50 DMA line and the prior low with a damaging volume-driven loss on 5/10/21 triggering a technical sell signal. A rebound above the 50 DMA line ($183) is needed for its outlook to improve. Its Relative Strength Rating is 59, below the 80+ minimum for buy candidates. Reported Mar '21 quarterly earnings +75% on +36% sales revenues versus the year ago period, its 3rd very strong quarterly comparison. It stalled after recently wedging up to new highs from a 9-week base.
>>> FEATURED STOCK ARTICLE : Quiet Gain For Best Ever Close - 4/29/2021 |
View all notes |
Set NEW NOTE alert |
Company Profile |
SEC
News |
Chart |
Request a new note
C
A
S
I |
YETI
-
NYSE
Yeti Holdings Inc
Leisure-Products
|
$86.01
|
-2.54
-2.87% |
$88.49
|
2,078,723
152.96% of 50 DAV
50 DAV is 1,359,000
|
$90.65
-5.12%
|
5/13/2021
|
$84.20
|
PP = $90.65
|
|
MB = $95.18
|
Most Recent Note - 5/17/2021 12:56:01 PM
Y - Quickly rebounded after a pullback last week tested support at its 50 DMA line and prior high. Reported Mar 21 quarterly earnings +245% on +42% sales revenues versus the year ago period, continuing its strong earnings track record. Color code was changed to yellow as it was noted that a valid secondary buy point exists from its 10 WMA line up to 5% above the latest high.
>>> FEATURED STOCK ARTICLE : Hovering Near Record High Following Volume-Driven Gains - 5/3/2021 |
View all notes |
Set NEW NOTE alert |
Company Profile |
SEC
News |
Chart |
Request a new note
C
A
S
I |
Symbol/Exchange
Company Name
Industry Group |
PRICE |
CHANGE
(%Change) |
Day High |
Volume
(% DAV)
(% 50 day avg vol) |
52 Wk Hi
% From Hi |
Featured
Date |
Price
Featured |
Pivot Featured |
|
Max Buy |
MRBK
-
NASDAQ
Meridian Corp
Banks-Northeast
|
$26.47
|
-0.28
-1.05% |
$27.01
|
16,111
45.51% of 50 DAV
50 DAV is 35,400
|
$27.96
-5.33%
|
2/22/2021
|
$25.58
|
PP = $26.10
|
|
MB = $27.41
|
Most Recent Note - 5/13/2021 5:54:43 PM
Y - Posted a gain today with slightly above average volume. Consolidating near its 50 DMA line ($25.90), still perched only -7.3% off its 52-week high. Reported Mar '21 earnings +323% on +93% sales revenues versus the year ago period, continuing its strong earnings track record. Recent low ($24.01 on 4/21/21) defines important near-term support where any violation may trigger a worrisome technical sell signal. Its Relative Strength Rating is 78, below the 80 minimum guideline.
>>> FEATURED STOCK ARTICLE : Bank Consolidating Near 50 Day Moving Average Line - 5/7/2021 |
View all notes |
Set NEW NOTE alert |
Company Profile |
SEC
News |
Chart |
Request a new note
C
A
S
I |
CLAR
-
NASDAQ
Clarus Corporation
Leisure-Products
|
$21.46
|
+0.18
0.85% |
$21.78
|
57,358
33.74% of 50 DAV
50 DAV is 170,000
|
$21.93
-2.14%
|
5/12/2021
|
$21.40
|
PP = $19.73
|
|
MB = $20.72
|
Most Recent Note - 5/17/2021 5:50:02 PM
G - Color code is changed to green after rising even further above its "max buy" level with today's gain with light volume for a best-ever close. Prior high ($19.63 on 3/09/21) defines initial support to watch on pullbacks.
>>> FEATURED STOCK ARTICLE : 4 Volume-Driven Gains Into New High Territory - 5/12/2021 |
View all notes |
Set NEW NOTE alert |
Company Profile |
SEC
News |
Chart |
Request a new note
C
A
S
I |
|
|
|
THESE ARE NOT BUY RECOMMENDATIONS!
Comments contained in the body of this report are technical
opinions only. The material herein has been obtained
from sources believed to be reliable and accurate, however,
its accuracy and completeness cannot be guaranteed.
This site is not an investment advisor, hence it does
not endorse or recommend any securities or other investments.
Any recommendation contained in this report may not
be suitable for all investors and it is not to be deemed
an offer or solicitation on our part with respect to
the purchase or sale of any securities. All trademarks,
service marks and trade names appearing in this report
are the property of their respective owners, and are
likewise used for identification purposes only.
This report is a service available
only to active Paid Premium Members.
You may opt-out of receiving report notifications
at any time. Questions or comments may be submitted
by writing to Premium Membership Services 665 S.E. 10 Street, Suite 201 Deerfield Beach, FL 33441-5634 or by calling 1-800-965-8307
or 954-785-1121.
|
|
|