You are not logged in.
This means you
CAN ONLY VIEW reports that were published prior to Thursday, March 20, 2025.
You
MUST UPGRADE YOUR MEMBERSHIP if you want to see any current reports.
AFTER MARKET UPDATE - WEDNESDAY, MAY 12TH, 2021
Previous After Market Report Next After Market Report >>>
|
|
|
|
DOW |
-681.50 |
33,587.66 |
-1.99% |
|
Volume |
1,046,190,060 |
+5% |
|
Volume |
4,696,188,100 |
-0% |
|
NASDAQ |
-344.33 |
13,045.10 |
-2.57% |
|
Advancers |
450 |
14% |
|
Advancers |
914 |
23% |
|
S&P 500 |
-89.06 |
4,063.04 |
-2.14% |
|
Decliners |
2,834 |
86% |
|
Decliners |
3,134 |
77% |
|
Russell 2000 |
-71.85 |
2,135.14 |
-3.26% |
|
52 Wk Highs |
75 |
|
|
52 Wk Highs |
60 |
|
|
S&P 600 |
-42.98 |
1,294.40 |
-3.21% |
|
52 Wk Lows |
58 |
|
|
52 Wk Lows |
123 |
|
|
 |
Major Indices Sink as Inflation Concerns Grow
Kenneth J. Gruneisen - Passed the CAN SLIM® Master's Exam
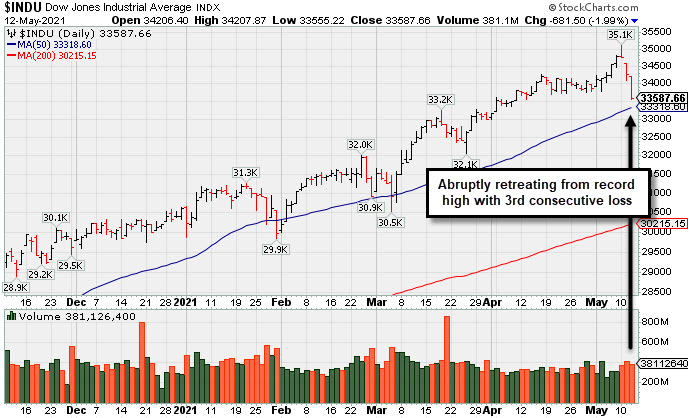
The Dow tumbled 681 points, its worst day since January 29, while the S&P 500 shed 2.1%, its biggest decline since February. The Nasdaq Composite retreated 2.7% amid continued weakness in chipmakers and mega-cap tech shares. The volume totals reported were higher than the prior session on the NYSE and near the prior session total on the Nasdaq exchange, indicative of less institutional selling pressure. Breadth was negative as decliners led advancers by a 6-1 margin on the NYSE and 3-1 on the Nasdaq exchange. There were 10 high-ranked companies from the Leaders List that hit new 52-week highs and were listed on the BreakOuts Page, matching 10 on the prior session, still down abruptly from the total of 171 on Monday's session. New 52-week highs outnumbered new 52-week lows on the NYSE while new lows outnumbered new highs on the Nasdaq exchange. The major indices (M criteria) are in a confirmed uptrend. Investors are reminded to always make buying and selling decisions on case-by-case basis under the strict criteria and rules of the fact-based investment system.
PICTURED: The Dow Jones Industrial Average has abruptly retreated from its record high with 3 consecutive losses, falling toward its 50-day moving average (DMA) line.
U.S. stocks finished lower for a third session on Wednesday as higher-than-expected consumer inflation exacerbated concerns that the Federal Reserve may fall behind the curve in terms of tightening monetary policy.
On the data front, the consumer price index (CPI) saw its largest monthly uptick since June 2009 in April (+0.8%). Core CPI (excluding food and energy) increased at an annualized 3% pace, nearly doubling the prior 1.6% gain and exceeding consensus expectations calling for a 2.3% rise. Federal Reserve Vice Chair Richard Clarida admitted being surprised by the release, but noted that additional data releases would need to be monitored before officials prematurely removed accommodative monetary stimulus.
Treasuries were firmly weaker following the inflation report. The yield on the benchmark 10-year note spiked seven basis points to 1.69%, its biggest one-day increase since March. The maturity’s $41 billion auction was well-received this afternoon. A gauge of the U.S. dollar rebounded 0.7%. In commodities, WTI crude added 0.8% to $65.78/barrel, its strongest point in almost eight weeks.
Ten of 11 S&P 500 sectors closed in negative territory, with the Consumer Discretionary and Technology groups leading the downturn. Apple and Amazon both dropped more than 2.2%, while Microsoft slumped 2.9%. Elsewhere, security software company NortonLifeLock (NLOK +7.19%) bucked the downtrend, jumping after being the subject of a double upgrade from a Wall Street analyst. |
 Kenneth J. Gruneisen started out as a licensed stockbroker in August 1987, a couple of months prior to the historic stock market crash that took the Dow Jones Industrial Average down -22.6% in a single day. He has published daily fact-based fundamental and technical analysis on high-ranked stocks online for two decades. Through FACTBASEDINVESTING.COM, Kenneth provides educational articles, news, market commentary, and other information regarding proven investment systems that work in good times and bad.
Comments contained in the body of this report are technical opinions only and are not necessarily those of Gruneisen Growth Corp. The material herein has been obtained from sources believed to be reliable and accurate, however, its accuracy and completeness cannot be guaranteed. Our firm, employees, and customers may effect transactions, including transactions contrary to any recommendation herein, or have positions in the securities mentioned herein or options with respect thereto. Any recommendation contained in this report may not be suitable for all investors and it is not to be deemed an offer or solicitation on our part with respect to the purchase or sale of any securities. |
|
 |
Retail, Financial, Tech, and Gold & Silver Indexes Fell
Kenneth J. Gruneisen - Passed the CAN SLIM® Master's Exam
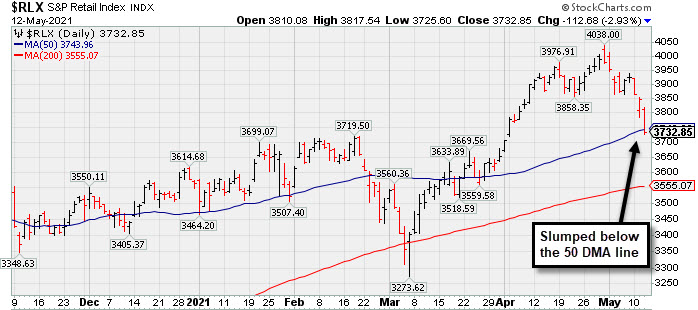
The Retail Index ($RLX -2.93%) suffered a big loss that weighed on the major averages along with losses from the Broker/Dealer Index ($XBD -2.65%) and the Bank Index ($BKX -1.62%). The Semiconductor Index ($SOX -4.16%) and Networking Index ($NWX -3.39%) both suffered big losses while the Biotech Index ($BTK +0.07%) finished flat. The Oil Services Index ($OSX +0.66%) and Integrated Oil Index ($XOI +0.51%) both edged higher, meanwhile the Gold & Silver Index ($XAU -2.21%) slumped for a big loss.
PICTURED: The Retail Index ($RLX -2.93%) abruptly slumped below its 50-day moving average (DMA) line with a 3rd consecutive loss.
| Oil Services |
$OSX |
60.21 |
+0.39 |
+0.66% |
+35.81% |
| Integrated Oil |
$XOI |
1,080.43 |
+5.52 |
+0.51% |
+36.33% |
| Semiconductor |
$SOX |
2,852.26 |
-123.75 |
-4.16% |
+2.03% |
| Networking |
$NWX |
769.63 |
-27.00 |
-3.39% |
+7.32% |
| Broker/Dealer |
$XBD |
448.38 |
-12.21 |
-2.65% |
+18.75% |
| Retail |
$RLX |
3,732.85 |
-112.68 |
-2.93% |
+4.76% |
| Gold & Silver |
$XAU |
153.66 |
-3.48 |
-2.21% |
+6.57% |
| Bank |
$BKX |
128.85 |
-2.12 |
-1.62% |
+31.60% |
| Biotech |
$BTK |
5,467.35 |
+3.77 |
+0.07% |
-4.73% |
|
|
|
 |
4 Volume-Driven Gains Into New High Territory
Kenneth J. Gruneisen - Passed the CAN SLIM® Master's Exam
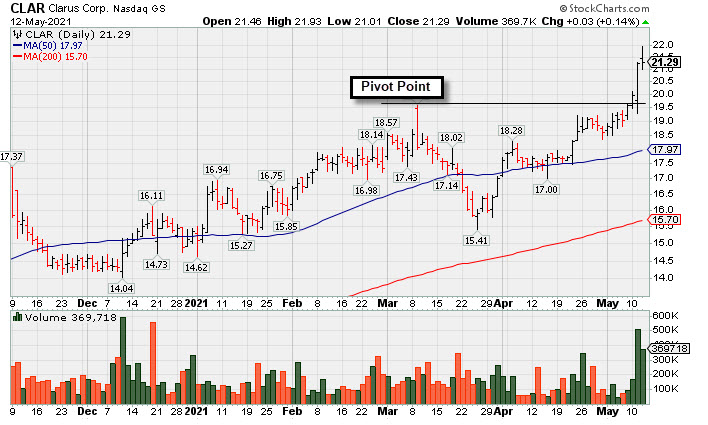
Clarus Corporation (CLAR +$0.03 or +0.14% to $21.29) held its ground was highlighted in yellow in the earlier mid-day report (read here) with pivot point cited based on its 3/09/21 high plus 10 cents. It is quickly getting extended from prior highs and hit a new 52-week high with today's 4th consecutive gain backed by ever-increasing volume.
The high-ranked Leisure-Products firm's Sep, Dec '20 and Mar '21 quarterly results showed very strong earnings increases over the year ago periods with impressive acceleration in sales revenues growth rate. Annual earnings history (A criteria) has been strong.
The number of top-rated funds owning its shares rose from 168 in Dec '20 to 173 in Mar '21. Its current Up/Down Volume Ratio of 1.0 is an unbiased indication that it has been neutral concerning accumulation/distribution over the past 50 days. Its small supply of only 22.2 million shares (S criteria) in the public float can contribute to greater volatility in the event of institutional buying or selling.
|
|
|
Color Codes Explained :
Y - Better candidates highlighted by our
staff of experts.
G - Previously featured
in past reports as yellow but may no longer be buyable under the
guidelines.
***Last / Change / Volume data in this table is the closing quote data***
Symbol/Exchange
Company Name
Industry Group |
PRICE |
CHANGE
(%Change) |
Day High |
Volume
(% DAV)
(% 50 day avg vol) |
52 Wk Hi
% From Hi |
Featured
Date |
Price
Featured |
Pivot Featured |
|
Max Buy |
 SIVB
-
NASDAQ
SIVB
-
NASDAQ
S V B Financial Group
BANKING - Regional - Pacific Banks
|
$547.27
|
-36.63
-6.27% |
$595.90
|
509,677
91.34% of 50 DAV
50 DAV is 558,000
|
$592.34
-7.61%
|
4/23/2021
|
$579.70
|
PP = $577.16
|
|
MB = $606.02
|
Most Recent Note - 5/11/2021 5:14:38 PM
Y - Perched near its high, it posted another gain today with average volume. Confirming volume-driven gains are still needed to help clinch a convincing technical buy signal. Bullish action came after it reported earnings +293% on +64% sales revenues for the Mar '21 quarter versus the year ago period, its 3rd strong comparison. Completed a new Public Offering on 3/24/21.
>>> FEATURED STOCK ARTICLE : Hit New High But Closed Below Pivot Point - 4/23/2021 |
View all notes |
Set NEW NOTE alert |
Company Profile |
SEC
News |
Chart |
Request a new note
C
A
S
I |
CROX
-
NASDAQ
Crocs Inc
CONSUMER NON-DURABLES - Textile - Apparel Footwear
|
$97.95
|
-6.22
-5.97% |
$103.86
|
1,728,755
124.19% of 50 DAV
50 DAV is 1,392,000
|
$109.91
-10.88%
|
4/27/2021
|
$99.81
|
PP = $86.50
|
|
MB = $90.83
|
Most Recent Note - 5/10/2021 2:57:32 PM
G - Reversed into the red today after hitting yet another new all-time high. A spurt of volume-driven gains has it very extended from the latest base. Prior highs in the $86 area define initial support to watch on pullbacks.
>>> FEATURED STOCK ARTICLE : Powerful "Breakaway Gap" for CROX - 4/27/2021 |
View all notes |
Set NEW NOTE alert |
Company Profile |
SEC
News |
Chart |
Request a new note
C
A
S
I |
RCKY
-
NASDAQ
Rocky Brands Inc
CONSUMER NON-DURABLES - Textile - Apparel Footwear
|
$55.67
|
-4.69
-7.77% |
$60.40
|
106,533
122.45% of 50 DAV
50 DAV is 87,000
|
$69.00
-19.32%
|
5/5/2021
|
$61.65
|
PP = $61.55
|
|
MB = $64.63
|
 Most Recent Note - 5/12/2021 5:11:08 PM
G - Abruptly pulled back from its all-time high with today's 3rd big volume-driven loss undercutting the prior high in the $61 area raising concerns. Fundamentals remain strong. The 50 DMA line ($53.65) defines the next important support level.
>>> FEATURED STOCK ARTICLE : Rocky Brands Powered Higher After Strong Earnings - 5/5/2021 |
View all notes |
Set NEW NOTE alert |
Company Profile |
SEC
News |
Chart |
Request a new note
C
A
S
I |
CRL
-
NYSE
Charles River Labs Intl
DRUGS - Biotechnology
|
$316.76
|
-3.74
-1.17% |
$331.99
|
730,983
217.55% of 50 DAV
50 DAV is 336,000
|
$349.13
-9.27%
|
12/17/2020
|
$247.06
|
PP = $257.98
|
|
MB = $270.88
|
Most Recent Note - 5/12/2021 12:44:32 PM
G - Extended from any sound base and retreating from its all-time high with today's 4th volume-driven loss in the span of 5 sessions. Its 50 DMA line ($305) defines near-term support above the prior high ($303). Reported Mar '21 quarterly earnings +38% on +17%v sales revenues versus the year ago period. Two of the past 3 quarterly comparisons have been above the +25% minimum earnings guideline (C criteria).
>>> FEATURED STOCK ARTICLE : Pulling Back From Record High Following Strong Quarterly Report - 5/6/2021 |
View all notes |
Set NEW NOTE alert |
Company Profile |
SEC
News |
Chart |
Request a new note
C
A
S
I |
CAMT
-
NASDAQ
Camtek Ltd
ELECTRONICS - Scientific and Technical Instrum
|
$27.08
|
-1.82
-6.30% |
$28.52
|
216,199
66.32% of 50 DAV
50 DAV is 326,000
|
$36.14
-25.07%
|
4/28/2021
|
$35.03
|
PP = $35.34
|
|
MB = $37.11
|
Most Recent Note - 5/12/2021 5:18:04 PM
G - Color code is changed to green while slumping well below its 50 DMA line raising concerns. A prompt rebound is needed for its outlook to improve. Subsequent gains and a strong close above the pivot point backed by at least +40% above average volume still are needed to trigger a technical buy signal.
>>> FEATURED STOCK ARTICLE : Earnings Acceleration and Perched at High After Ascending Base - 4/28/2021 |
View all notes |
Set NEW NOTE alert |
Company Profile |
SEC
News |
Chart |
Request a new note
C
A
S
I |
Symbol/Exchange
Company Name
Industry Group |
PRICE |
CHANGE
(%Change) |
Day High |
Volume
(% DAV)
(% 50 day avg vol) |
52 Wk Hi
% From Hi |
Featured
Date |
Price
Featured |
Pivot Featured |
|
Max Buy |
BRKS
-
NASDAQ
Brooks Automation
ELECTRONICS - Semiconductor Equipment and Mate
|
$86.59
|
-5.38
-5.85% |
$91.05
|
1,239,501
154.74% of 50 DAV
50 DAV is 801,000
|
$108.72
-20.36%
|
4/5/2021
|
$99.31
|
PP = $91.88
|
|
MB = $96.47
|
Most Recent Note - 5/11/2021 12:37:04 PM
G - Halting its slide with today's gain, finding prompt support after violating prior highs in the $91 area and also undercutting its 50 DMA line ($90.93). More damaging losses would raise greater concerns.
>>> FEATURED STOCK ARTICLE : Extended From Base and Consolidating After Recent Rally - 4/30/2021 |
View all notes |
Set NEW NOTE alert |
Company Profile |
SEC
News |
Chart |
Request a new note
C
A
S
I |
ENTG
-
NASDAQ
Entegris Inc
ELECTRONICS - Semiconductor Equipment and Mate
|
$101.61
|
-7.58
-6.94% |
$107.34
|
1,929,406
207.24% of 50 DAV
50 DAV is 931,000
|
$126.41
-19.62%
|
4/1/2021
|
$118.42
|
PP = $110.37
|
|
MB = $115.89
|
Most Recent Note - 5/12/2021 5:15:46 PM
Suffered another big volume-driven loss today slumping well below its 50 DMA line, raising greater concerns. Only a prompt rebound would help its outlook improve. Its Relative Strength Rating is 74, below the 80+ minimum guideline for buy candidates. It will be dropped from the Featured Stocks list tonight.
>>> FEATURED STOCK ARTICLE : Negated Recent Breakout and Sputtering Near Prior High - 4/22/2021 |
View all notes |
Set NEW NOTE alert |
Company Profile |
SEC
News |
Chart |
Request a new note
C
A
S
I |
OPY
-
NYSE
Oppenheimer Holdings Inc
FINANCIAL SERVICES - Investment Brokerage - Regiona
|
$47.54
|
-2.56
-5.11% |
$50.98
|
159,239
136.10% of 50 DAV
50 DAV is 117,000
|
$52.45
-9.36%
|
2/25/2021
|
$38.95
|
PP = $38.11
|
|
MB = $40.02
|
Most Recent Note - 5/10/2021 6:28:26 PM
G - Hovering near its all-time high, very extended from any sound base. Bullish action came after it reported Mar '21 quarterly earnings +402% on +59% sales revenues versus the year ago period. Prior high in the $44 area defines initial support to watch above its 50 DMA line ($43.69).
>>> FEATURED STOCK ARTICLE : Negative Reversal After 7 Consecutive Gains - 4/20/2021 |
View all notes |
Set NEW NOTE alert |
Company Profile |
SEC
News |
Chart |
Request a new note
C
A
S
I |
MTH
-
NYSE
Meritage Homes Corp
MATERIALS and CONSTRUCTION - Residential Construction
|
$105.83
|
-7.27
-6.43% |
$112.12
|
936,129
223.42% of 50 DAV
50 DAV is 419,000
|
$120.19
-11.95%
|
10/26/2004
|
$108.84
|
PP = $117.16
|
|
MB = $123.02
|
Most Recent Note - 5/12/2021 5:23:21 PM
Y - Ended near the session low after highlighted yellow with pivot point cited based on its 10/05/20 high plus 10 cents. Pulled back today for a 2nd consecutive volume-driven loss after hitting new 52-week highs with volume-driven gains. Subsequent gains above the pivot point with at least +40% above average volume would be a reassuring confirmation of fresh institutional buying demand. Reported earnings +88% on +20% sales revenues for the Mar '21 quarter versus the year ago period, its 7th consecutive strong quarterly comparison above the +25% minimum guideline (C criteria). Annual earnings (A criteria) history has been strong after a downturn in FY '15.
There are no Featured Stock Updates™ available for this stock at this time. You may request one by clicking the Request a New Note link below |
View all notes |
Set NEW NOTE alert |
Company Profile |
SEC
News |
Chart |
Request a new note
C
A
S
I |
LAD
-
NYSE
Lithia Motors Inc Cl A
SPECIALTY RETAIL - Auto Dealerships
|
$350.72
|
-15.01
-4.10% |
$363.79
|
277,792
92.60% of 50 DAV
50 DAV is 300,000
|
$417.98
-16.09%
|
4/21/2021
|
$377.00
|
PP = $418.08
|
|
MB = $438.98
|
Most Recent Note - 5/11/2021 5:13:05 PM
G - Slumped further below its 50 DMA line ($386) with today's 6th consecutive loss. A prompt rebound above its 50 DMA line is needed for its outlook to improve. Subsequent gains above the pivot point backed by at least +40% above average volume are needed to trigger a technical buy signal.
>>> FEATURED STOCK ARTICLE : Building a Base With Rebound Above 50-Day Moving Average - 4/21/2021 |
View all notes |
Set NEW NOTE alert |
Company Profile |
SEC
News |
Chart |
Request a new note
C
A
S
I |
Symbol/Exchange
Company Name
Industry Group |
PRICE |
CHANGE
(%Change) |
Day High |
Volume
(% DAV)
(% 50 day avg vol) |
52 Wk Hi
% From Hi |
Featured
Date |
Price
Featured |
Pivot Featured |
|
Max Buy |
MED
-
NYSE
Medifast Inc
SPECIALTY RETAIL - Specialty Retail, Other
|
$274.25
|
-19.96
-6.78% |
$294.78
|
176,926
146.22% of 50 DAV
50 DAV is 121,000
|
$296.50
-7.50%
|
5/11/2021
|
$285.72
|
PP = $279.56
|
|
MB = $293.54
|
Most Recent Note - 5/12/2021 5:20:18 PM
Y - Suffered a big loss today with above average volume, undercutting the prior high, raising concerns while slumping back into the prior base.
>>> FEATURED STOCK ARTICLE : Held Ground Following Breakout Gain on Prior Session - 5/11/2021 |
View all notes |
Set NEW NOTE alert |
Company Profile |
SEC
News |
Chart |
Request a new note
C
A
S
I |
CLFD
-
NASDAQ
Clearfield Inc
TELECOMMUNICATIONS - Cables / Satalite Equipment
|
$33.36
|
-2.11
-5.95% |
$35.38
|
104,013
74.30% of 50 DAV
50 DAV is 140,000
|
$40.26
-17.14%
|
4/26/2021
|
$39.68
|
PP = $38.85
|
|
MB = $40.79
|
Most Recent Note - 5/10/2021 2:43:31 PM
Y - Pulling back abruptly today following 5 consecutive gains. Fundamentals remain strong after it reported Mar '21 quarterly earnings +440% on +45% sales revenues versus the year ago period, continuing its strong earnings track record.
>>> FEATURED STOCK ARTICLE : Rallied Straight Up From Bottom of 10-Week Base - 4/26/2021 |
View all notes |
Set NEW NOTE alert |
Company Profile |
SEC
News |
Chart |
Request a new note
C
A
S
I |
EDUC
-
NASDAQ
Educational Development
WHOLESALE - Basic Materials Wholesale
|
$15.89
|
-0.81
-4.85% |
$16.70
|
26,818
107.27% of 50 DAV
50 DAV is 25,000
|
$20.00
-20.55%
|
3/10/2021
|
$17.89
|
PP = $20.10
|
|
MB = $21.11
|
Most Recent Note - 5/10/2021 2:59:32 PM
G - Color code is changed to green after sputtering below its 50 DMA line ($17.43). A rebound above the 50 DMA line is needed for its outlook to improve. Met stubborn resistance in the $19-20 area. Subsequent gains above the pivot point backed by at least +40% above average volume are needed to trigger a proper technical buy signal.
>>> FEATURED STOCK ARTICLE : Finding Support During Consolidation Above 50-Day Moving Average - 4/16/2021 |
View all notes |
Set NEW NOTE alert |
Company Profile |
SEC
News |
Chart |
Request a new note
C
A
S
I |
SMPL
-
NASDAQ
Simply Good Foods Co
Food-Confectionery
|
$32.59
|
-1.59
-4.65% |
$34.00
|
524,285
78.96% of 50 DAV
50 DAV is 664,000
|
$35.34
-7.78%
|
12/28/2020
|
$30.40
|
PP = $31.44
|
|
MB = $33.01
|
Most Recent Note - 5/10/2021 6:27:13 PM
G - Still quietly perched near its all-time high, stubbornly holding its ground with volume totals cooling. Reported Feb '21 quarterly earnings +9% on +2% sales revenues versus the year ago period, below the +25% minimum earnings guideline (C criteria), raising fundamental concerns. Its 50 DMA line ($32.33) defines important near-term support to watch on pullbacks. Its current Relative Strength Rating is 78, below the 80+ minimum guideline for buy candidates. See the latest FSU analysis for more details and a new annotated graph.
>>> FEATURED STOCK ARTICLE : Hovering Near All-Time High Following Lackluster Quarter - 5/10/2021 |
View all notes |
Set NEW NOTE alert |
Company Profile |
SEC
News |
Chart |
Request a new note
C
A
S
I |
IBP
-
NYSE
Installed Building Prod
DIVERSIFIED SERVICES - Business/Management Services
|
$115.89
|
-6.36
-5.20% |
$122.76
|
527,976
220.91% of 50 DAV
50 DAV is 239,000
|
$140.58
-17.56%
|
4/19/2021
|
$131.15
|
PP = $130.21
|
|
MB = $136.72
|
Most Recent Note - 5/10/2021 12:45:28 PM
G - Showing resilience today, rebounding near the prior high in the $130 area after slumping into the prior base. Gapped down on 5/07/21 for a big volume-driven loss, raising technical concerns. Its 50 DMA line ($120) defines the next important near-term support level. Weak action came after it reported Mar '21 quarterly earnings +15% on +10% sales revenues versus the year ago period, below the +25% minimum earnings guideline (C criteria) raising fundamental concerns.
>>> FEATURED STOCK ARTICLE : Steady Streak of Gains Into New High Territory - 4/19/2021 |
View all notes |
Set NEW NOTE alert |
Company Profile |
SEC
News |
Chart |
Request a new note
C
A
S
I |
Symbol/Exchange
Company Name
Industry Group |
PRICE |
CHANGE
(%Change) |
Day High |
Volume
(% DAV)
(% 50 day avg vol) |
52 Wk Hi
% From Hi |
Featured
Date |
Price
Featured |
Pivot Featured |
|
Max Buy |
QRVO
-
NASDAQ
"Qorvo, Inc"
ELECTRONICS - Semiconductor - Integrated Cir
|
$165.35
|
-6.66
-3.87% |
$170.90
|
1,534,347
126.82% of 50 DAV
50 DAV is 1,209,900
|
$201.68
-18.01%
|
4/1/2021
|
$190.48
|
PP = $191.92
|
|
MB = $201.52
|
Most Recent Note - 5/10/2021 2:50:08 PM
G - Color code is changed to green after gapping down today violating its 50 DMA line ($183.60) and undercutting the prior low with a damaging volume-driven loss triggering a technical sell signal. Reported Mar '21 quarterly earnings +75% on +36% sales revenues versus the year ago period, its 3rd very strong quarterly comparison. It stalled after recently wedging up to new highs from a 9-week base. Its Relative Strength Rating is 69, below the 80+ minimum for buy candidates.
>>> FEATURED STOCK ARTICLE : Quiet Gain For Best Ever Close - 4/29/2021 |
View all notes |
Set NEW NOTE alert |
Company Profile |
SEC
News |
Chart |
Request a new note
C
A
S
I |
YETI
-
NYSE
Yeti Holdings Inc
Leisure-Products
|
$81.42
|
-6.11
-6.98% |
$87.16
|
2,507,570
199.33% of 50 DAV
50 DAV is 1,258,000
|
$90.65
-10.18%
|
4/6/2021
|
$76.95
|
PP = $79.42
|
|
MB = $83.39
|
Most Recent Note - 5/12/2021 5:13:04 PM
G - Abruptly retreated from its all-time high with today's 3rd consecutive volume-driven loss. Prior highs in the $80 area define initial support to watch on pullbacks above its 50 DMA line ($78.43).
>>> FEATURED STOCK ARTICLE : Hovering Near Record High Following Volume-Driven Gains - 5/3/2021 |
View all notes |
Set NEW NOTE alert |
Company Profile |
SEC
News |
Chart |
Request a new note
C
A
S
I |
MRBK
-
NASDAQ
Meridian Corp
Banks-Northeast
|
$25.37
|
-0.45
-1.74% |
$26.49
|
27,181
76.35% of 50 DAV
50 DAV is 35,600
|
$27.96
-9.26%
|
2/22/2021
|
$25.58
|
PP = $26.10
|
|
MB = $27.41
|
Most Recent Note - 5/7/2021 5:40:40 PM
Y - Posted a small gain today halting its slide after 5 consecutive small losses. Consolidating near its 50 DMA line ($25.83), still perched only -7.6% off its 52-week high. Reported Mar '21 earnings +323% on +93% sales revenues versus the year ago period, continuing its strong earnings track record. Recent low ($24.01 on 4/21/21) defines important near-term support where any violation may trigger a worrisome technical sell signal. Its Relative Strength Rating is 74, below the 80 minimum guideline. See the latest FSU analysis for more details and a new annotated graph.
>>> FEATURED STOCK ARTICLE : Bank Consolidating Near 50 Day Moving Average Line - 5/7/2021 |
View all notes |
Set NEW NOTE alert |
Company Profile |
SEC
News |
Chart |
Request a new note
C
A
S
I |
CLAR
-
NASDAQ
Clarus Corporation
Leisure-Products
|
$21.29
|
+0.03
0.14% |
$21.93
|
369,718
226.82% of 50 DAV
50 DAV is 163,000
|
$21.27
0.09%
|
5/12/2021
|
$21.40
|
PP = $19.73
|
|
MB = $20.72
|
Most Recent Note - 5/12/2021 5:06:34 PM
Y - Held its ground today after highlighted in yellow with pivot point cited based on its 3/09/21 high plus 10 cents. Quickly getting extended from prior highs with today's 4th consecutive gain backed by ever-increasing volume. The Sep, Dec '20 and Mar '21 quarterly results showed very strong earnings increases over the year ago periods with impressive acceleration in sales revenues growth rate. Annual earnings history has been strong. See the latest FSU analysis for more details and a new annotated graph.
>>> FEATURED STOCK ARTICLE : 4 Volume-Driven Gains Into New High Territory - 5/12/2021 |
View all notes |
Set NEW NOTE alert |
Company Profile |
SEC
News |
Chart |
Request a new note
C
A
S
I |
|
|
|
THESE ARE NOT BUY RECOMMENDATIONS!
Comments contained in the body of this report are technical
opinions only. The material herein has been obtained
from sources believed to be reliable and accurate, however,
its accuracy and completeness cannot be guaranteed.
This site is not an investment advisor, hence it does
not endorse or recommend any securities or other investments.
Any recommendation contained in this report may not
be suitable for all investors and it is not to be deemed
an offer or solicitation on our part with respect to
the purchase or sale of any securities. All trademarks,
service marks and trade names appearing in this report
are the property of their respective owners, and are
likewise used for identification purposes only.
This report is a service available
only to active Paid Premium Members.
You may opt-out of receiving report notifications
at any time. Questions or comments may be submitted
by writing to Premium Membership Services 665 S.E. 10 Street, Suite 201 Deerfield Beach, FL 33441-5634 or by calling 1-800-965-8307
or 954-785-1121.
|
|
|