You are not logged in.
This means you
CAN ONLY VIEW reports that were published prior to Thursday, March 20, 2025.
You
MUST UPGRADE YOUR MEMBERSHIP if you want to see any current reports.
AFTER MARKET UPDATE - THURSDAY, MAY 20TH, 2021
Previous After Market Report Next After Market Report >>>
|
|
|
|
DOW |
+188.11 |
34,084.15 |
+0.55% |
|
Volume |
856,892,228 |
-13% |
|
Volume |
3,941,444,000 |
-8% |
|
NASDAQ |
+236.07 |
13,535.81 |
+1.78% |
|
Advancers |
2,172 |
67% |
|
Advancers |
2,858 |
69% |
|
S&P 500 |
+43.44 |
4,159.12 |
+1.06% |
|
Decliners |
1,082 |
33% |
|
Decliners |
1,277 |
31% |
|
Russell 2000 |
+14.12 |
2,207.76 |
+0.64% |
|
52 Wk Highs |
111 |
|
|
52 Wk Highs |
83 |
|
|
S&P 600 |
+4.25 |
1,337.78 |
+0.32% |
|
52 Wk Lows |
21 |
|
|
52 Wk Lows |
41 |
|
|
 |
Breadth Positive as Major Averages Rose With Less Volume Conviction
Kenneth J. Gruneisen - Passed the CAN SLIM® Master's Exam
All three major averages snapped a three-day losing streak, with the Dow advancing 188 points. The S&P 500 rallied 1.1%, while the Nasdaq Composite jumped 1.8% as tech and growth-oriented stocks outperformed. Despite the gains, the Dow and S&P 500 are heading for weekly declines. Meanwhile, the Nasdaq Composite is looking to notch its first weekly advance in five weeks. The volume totals reported were lighter than the prior session on the NYSE and on the Nasdaq exchange, indicative of lackluster institutional buying demand. Breadth was positive as advancers led decliners by a 2-1 margin on the NYSE and 7-3 on the Nasdaq exchange. There were 18 high-ranked companies from the Leaders List that hit new 52-week highs and were listed on the BreakOuts Page, versus 7 on the prior session. New 52-week highs totals outnumbered new 52-week lows on the NYSE and on the Nasdaq exchange. The major indices (M criteria) are still in an uptrend, but that trend has come under pressure in recent weeks. Investors are reminded to always make buying and selling decisions on case-by-case basis under the strict criteria and rules of the fact-based investment system.
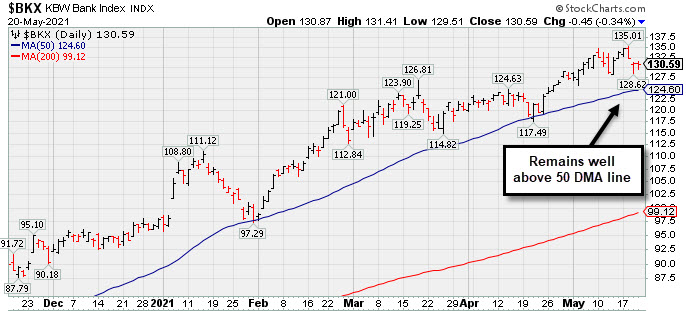
PICTURED: The Dow Jones Industrial Average remains above its 50-day moving average (DMA) line.
U.S. stocks ended broadly higher on Thursday as a better-than-expected update on the U.S. labor market lifted sentiment. Initial jobless claims came in at 444,000 in the week ending May 15, easing from the prior upwardly revised 478,000 figure and marking a fresh pandemic low.
Treasuries strengthened despite generally strong economic data, with the yield on the 10-year note down five basis points to 1.63%. A separate update showed the leading index of economic indicators rose 1.6% in April, up from the previous month's 1.3% reading. In commodities, WTI crude slid 2.1% to $62.05/barrel, falling for a third straight day as signs of progress toward reviving the U.S.-Iran nuclear deal improved the prospect of rising global supplies.
Ten of 11 S&P 500 sectors finished in positive territory, with Energy the lone laggard. The Technology and Communication Services groups paced the gains, with the oft-cited FAANG group rising 1.7%. In earnings, Cisco Systems (CSCO +0.72%) edged higher as investors assessed a disappointing profit forecast for the current quarter as ongoing supply chain issues weigh on the network equipment maker’s margins. Kohl's (KSS -10.17%) fell as the retailer exceeded consensus earnings and sales estimates but its upwardly revised sales growth projections fell short of analysts’ expectations. |
 Kenneth J. Gruneisen started out as a licensed stockbroker in August 1987, a couple of months prior to the historic stock market crash that took the Dow Jones Industrial Average down -22.6% in a single day. He has published daily fact-based fundamental and technical analysis on high-ranked stocks online for two decades. Through FACTBASEDINVESTING.COM, Kenneth provides educational articles, news, market commentary, and other information regarding proven investment systems that work in good times and bad.
Comments contained in the body of this report are technical opinions only and are not necessarily those of Gruneisen Growth Corp. The material herein has been obtained from sources believed to be reliable and accurate, however, its accuracy and completeness cannot be guaranteed. Our firm, employees, and customers may effect transactions, including transactions contrary to any recommendation herein, or have positions in the securities mentioned herein or options with respect thereto. Any recommendation contained in this report may not be suitable for all investors and it is not to be deemed an offer or solicitation on our part with respect to the purchase or sale of any securities. |
|
 |
Tech Sector Led Group Gainers
Kenneth J. Gruneisen - Passed the CAN SLIM® Master's Exam
The tech sector had a positive bias as the Semiconductor Index ($SOX +2.66%), Networking Index ($NWX +2.75%), and Biotech Index ($BTK +2.47%) each posted a solid gain. The Retail Index ($RLX +0.49%) and Broker/Dealer Index ($XBD +0.48%) both edged higher, but the Bank Index ($BKX -0.34%) finished slightly in the red. Commodity-linked groups were mixed as the Gold & Silver Index ($XAU +1.27%) rose while both the Oil Services Index ($OSX -0.31%) and Integrated Oil Index ($XOI -0.36%) edged lower. PICTURED: The Bank Index ($BKX -0.34%) remains well above its 50-day moving average (DMA) line.
| Oil Services |
$OSX |
60.07 |
-0.18 |
-0.31% |
+35.51% |
| Integrated Oil |
$XOI |
1,068.30 |
-3.83 |
-0.36% |
+34.80% |
| Semiconductor |
$SOX |
3,066.69 |
+79.41 |
+2.66% |
+9.70% |
| Networking |
$NWX |
817.13 |
+21.88 |
+2.75% |
+13.95% |
| Broker/Dealer |
$XBD |
461.15 |
+2.19 |
+0.48% |
+22.13% |
| Retail |
$RLX |
3,805.27 |
+18.73 |
+0.49% |
+6.79% |
| Gold & Silver |
$XAU |
164.05 |
+2.05 |
+1.27% |
+13.78% |
| Bank |
$BKX |
130.59 |
-0.45 |
-0.34% |
+33.38% |
| Biotech |
$BTK |
5,612.77 |
+135.27 |
+2.47% |
-2.20% |
|
|
|
 |
Sputtering Since Featured Without Confirming Gains
Kenneth J. Gruneisen - Passed the CAN SLIM® Master's Exam
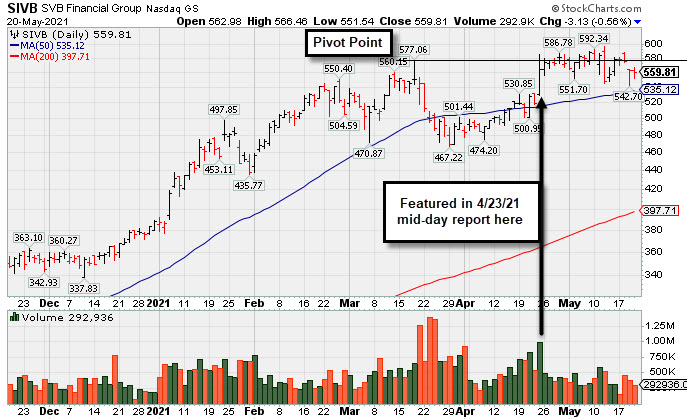
S V B Financial Group (SIVB -$3.13 or -0.56% to $559.81) was highlighted in yellow in the 4/23/21 mid-day report (read here) with a pivot point cited based on its 3/18/21 high plus 10 cents. At that time it spiked up to touch a new all-time high with a volume-driven gain but did not close above the pivot point. Since then it did not produce confirming volume-driven gains for new highs to help clinch a proper technical buy signal. Meanwhile, its 50-day moving average (DMA) line ($535) defines important near-term support to watch.
SIVB was last shown in this FSU section on 4/23/21 with an annotated graph under the headline, "Hit New High But Closed Below Pivot Point". Bullish action came after it reported earnings +293% on +64% sales revenues for the Mar '21 quarter versus the year ago period, its 3rd strong comparison above the +25% minimum guideline (C criteria) of the fact-based investment system's guidelines. It has a great annual earnings history (A criteria).
The company completed a new Public Offering on 3/24/21. The number of top-rated funds owning its shares rose from 761 in Mar '17 to 1,679 in Mar '21, a reassuring sign concerning the I criteria. Its current Up/Down Volume ratio of 1.0 is an unbiased indication its shares have been neutral concerning accumulation/distribution over the past 50 days. It has earned a Timeliness rating of A and a Sponsorship Rating of B. There are only 53.8 million shares outstanding (S criteria) which can contribute to greater price volatility in the event of institutional buying or selling. |
|
|
Color Codes Explained :
Y - Better candidates highlighted by our
staff of experts.
G - Previously featured
in past reports as yellow but may no longer be buyable under the
guidelines.
***Last / Change / Volume data in this table is the closing quote data***
Symbol/Exchange
Company Name
Industry Group |
PRICE |
CHANGE
(%Change) |
Day High |
Volume
(% DAV)
(% 50 day avg vol) |
52 Wk Hi
% From Hi |
Featured
Date |
Price
Featured |
Pivot Featured |
|
Max Buy |
 SIVB
-
NASDAQ
SIVB
-
NASDAQ
S V B Financial Group
BANKING - Regional - Pacific Banks
|
$559.81
|
-3.13
-0.56% |
$566.46
|
291,548
53.01% of 50 DAV
50 DAV is 550,000
|
$595.90
-6.06%
|
4/23/2021
|
$579.70
|
PP = $577.16
|
|
MB = $606.02
|
Most Recent Note - 5/19/2021 3:03:05 PM
Y - Gapped down today, yet still hovering near its high. Confirming volume-driven gains are still needed to help clinch a convincing technical buy signal. Its 50 DMA line ($534) defines near-term support to watch. Reported earnings +293% on +64% sales revenues for the Mar '21 quarter versus the year ago period, its 3rd strong comparison. Completed a new Public Offering on 3/24/21.
>>> FEATURED STOCK ARTICLE : Sputtering Since Featured Without Confirming Gains - 5/20/2021 |
View all notes |
Set NEW NOTE alert |
Company Profile |
SEC
News |
Chart |
Request a new note
C
A
S
I |
CROX
-
NASDAQ
Crocs Inc
CONSUMER NON-DURABLES - Textile - Apparel Footwear
|
$98.38
|
-0.39
-0.39% |
$99.87
|
1,336,989
95.64% of 50 DAV
50 DAV is 1,398,000
|
$109.91
-10.49%
|
4/27/2021
|
$99.81
|
PP = $86.50
|
|
MB = $90.83
|
Most Recent Note - 5/19/2021 3:04:09 PM
G - Hovering near its all-time high with volume totals cooling. It is very extended from the latest base. Prior highs in the $86 area define initial support to watch on pullbacks.
>>> FEATURED STOCK ARTICLE : Powerful "Breakaway Gap" for CROX - 4/27/2021 |
View all notes |
Set NEW NOTE alert |
Company Profile |
SEC
News |
Chart |
Request a new note
C
A
S
I |
RCKY
-
NASDAQ
Rocky Brands Inc
CONSUMER NON-DURABLES - Textile - Apparel Footwear
|
$51.78
|
-1.99
-3.70% |
$53.94
|
84,593
92.96% of 50 DAV
50 DAV is 91,000
|
$69.00
-24.96%
|
5/5/2021
|
$61.65
|
PP = $61.55
|
|
MB = $64.63
|
 Most Recent Note - 5/20/2021 5:46:07 PM
G - Slumping below its 50 DMA line ($54.73) this week with 3 consecutive damaging losses raising concerns. Only a prompt rebound above the 50 DMA line would help its outlook improve. Fundamentals remain strong.
>>> FEATURED STOCK ARTICLE : Rocky Brands Powered Higher After Strong Earnings - 5/5/2021 |
View all notes |
Set NEW NOTE alert |
Company Profile |
SEC
News |
Chart |
Request a new note
C
A
S
I |
CRL
-
NYSE
Charles River Labs Intl
DRUGS - Biotechnology
|
$326.70
|
+7.70
2.41% |
$329.85
|
489,224
85.07% of 50 DAV
50 DAV is 575,100
|
$349.13
-6.42%
|
12/17/2020
|
$247.06
|
PP = $257.98
|
|
MB = $270.88
|
Most Recent Note - 5/20/2021 5:40:40 PM
G - Posted a gain today with light volume, halting its slide above its 50 DMA line ($311) which defines initial support above the prior high ($303). Reported Mar '21 quarterly earnings +38% on +17%v sales revenues versus the year ago period. Two of the past 3 quarterly comparisons have been above the +25% minimum earnings guideline (C criteria).
>>> FEATURED STOCK ARTICLE : Pulling Back From Record High Following Strong Quarterly Report - 5/6/2021 |
View all notes |
Set NEW NOTE alert |
Company Profile |
SEC
News |
Chart |
Request a new note
C
A
S
I |
CAMT
-
NASDAQ
Camtek Ltd
ELECTRONICS - Scientific and Technical Instrum
|
$30.75
|
+2.10
7.33% |
$30.81
|
291,328
100.11% of 50 DAV
50 DAV is 291,000
|
$36.14
-14.91%
|
4/28/2021
|
$35.03
|
PP = $35.34
|
|
MB = $37.11
|
Most Recent Note - 5/19/2021 5:05:04 PM
G - Posted a 2nd consecutive gain today with light volume. Remains well below its 50 DMA line ($30.91) after damaging losses. A prompt rebound is needed for its outlook to improve. Subsequent gains and a strong close above the pivot point backed by at least +40% above average volume still are needed to trigger a technical buy signal.
>>> FEATURED STOCK ARTICLE : Earnings Acceleration and Perched at High After Ascending Base - 4/28/2021 |
View all notes |
Set NEW NOTE alert |
Company Profile |
SEC
News |
Chart |
Request a new note
C
A
S
I |
Symbol/Exchange
Company Name
Industry Group |
PRICE |
CHANGE
(%Change) |
Day High |
Volume
(% DAV)
(% 50 day avg vol) |
52 Wk Hi
% From Hi |
Featured
Date |
Price
Featured |
Pivot Featured |
|
Max Buy |
BRKS
-
NASDAQ
Brooks Automation
ELECTRONICS - Semiconductor Equipment and Mate
|
$96.19
|
+2.48
2.65% |
$97.11
|
675,242
81.45% of 50 DAV
50 DAV is 829,000
|
$108.72
-11.53%
|
4/5/2021
|
$99.31
|
PP = $91.88
|
|
MB = $96.47
|
Most Recent Note - 5/20/2021 5:49:11 PM
G - Rebounded further above its 50 DMA line with light volume behind today's 3rd consecutive gain. It has not formed a sound base. More damaging losses below the recent low ($86.12 on 5/12/21) would raise greater concerns.
>>> FEATURED STOCK ARTICLE : Extended From Base and Consolidating After Recent Rally - 4/30/2021 |
View all notes |
Set NEW NOTE alert |
Company Profile |
SEC
News |
Chart |
Request a new note
C
A
S
I |
OPY
-
NYSE
Oppenheimer Holdings Inc
FINANCIAL SERVICES - Investment Brokerage - Regiona
|
$47.68
|
+0.11
0.23% |
$47.77
|
104,164
91.37% of 50 DAV
50 DAV is 114,000
|
$52.45
-9.09%
|
2/25/2021
|
$38.95
|
PP = $38.11
|
|
MB = $40.02
|
Most Recent Note - 5/17/2021 5:47:07 PM
G - Posted a 3rd consecutive quiet gain, hovering near its all-time high, very extended from any sound base. Bullish action came after it reported Mar '21 quarterly earnings +402% on +59% sales revenues versus the year ago period. Prior high in the $44 area defines initial support to watch coinciding with its 50 DMA line. See the latest FSU analysis for more details and a new annotated graph.
>>> FEATURED STOCK ARTICLE : Extended From Any Sound Base After Decent Rally - 5/17/2021 |
View all notes |
Set NEW NOTE alert |
Company Profile |
SEC
News |
Chart |
Request a new note
C
A
S
I |
MTH
-
NYSE
Meritage Homes Corp
MATERIALS and CONSTRUCTION - Residential Construction
|
$107.55
|
+0.77
0.72% |
$108.22
|
267,437
63.54% of 50 DAV
50 DAV is 420,900
|
$120.19
-10.52%
|
5/12/2021
|
$108.84
|
PP = $117.16
|
|
MB = $123.02
|
Most Recent Note - 5/18/2021 4:54:50 PM
Y - Pulled back today for a 2nd consecutive loss with light volume. Subsequent gains above the pivot point with at least +40% above average volume would be a reassuring confirmation of fresh institutional buying demand. Reported earnings +88% on +20% sales revenues for the Mar '21 quarter versus the year ago period, its 7th consecutive strong quarterly comparison above the +25% minimum guideline (C criteria). Annual earnings (A criteria) history has been strong after a downturn in FY '15.
>>> FEATURED STOCK ARTICLE : Homebuilder Pulled Back After Hitting New High - 5/13/2021 |
View all notes |
Set NEW NOTE alert |
Company Profile |
SEC
News |
Chart |
Request a new note
C
A
S
I |
LAD
-
NYSE
Lithia Motors Inc Cl A
SPECIALTY RETAIL - Auto Dealerships
|
$338.74
|
+8.97
2.72% |
$343.03
|
2,395,213
814.70% of 50 DAV
50 DAV is 294,000
|
$417.98
-18.96%
|
4/21/2021
|
$377.00
|
PP = $418.08
|
|
MB = $438.98
|
Most Recent Note - 5/19/2021 3:00:46 PM
G - Gapped down today for a big loss after proposing a new Public Offering. Remains below its 50 DMA line ($384) following a noted streak of losses. A rebound above its 50 DMA line is needed for its outlook to improve.
>>> FEATURED STOCK ARTICLE : Gap Down After Proposing New Public Offering - 5/19/2021 |
View all notes |
Set NEW NOTE alert |
Company Profile |
SEC
News |
Chart |
Request a new note
C
A
S
I |
MED
-
NYSE
Medifast Inc
SPECIALTY RETAIL - Specialty Retail, Other
|
$317.43
|
+0.36
0.11% |
$322.16
|
112,998
91.13% of 50 DAV
50 DAV is 124,000
|
$326.81
-2.87%
|
5/11/2021
|
$285.72
|
PP = $279.56
|
|
MB = $293.54
|
Most Recent Note - 5/18/2021 12:41:40 PM
G - Rising into record high territory with today's 4th consecutive volume-driven gain, getting extended from the previously noted base. Prior highs in the $279 area define initial support to watch on pullbacks.
>>> FEATURED STOCK ARTICLE : Held Ground Following Breakout Gain on Prior Session - 5/11/2021 |
View all notes |
Set NEW NOTE alert |
Company Profile |
SEC
News |
Chart |
Request a new note
C
A
S
I |
Symbol/Exchange
Company Name
Industry Group |
PRICE |
CHANGE
(%Change) |
Day High |
Volume
(% DAV)
(% 50 day avg vol) |
52 Wk Hi
% From Hi |
Featured
Date |
Price
Featured |
Pivot Featured |
|
Max Buy |
CLFD
-
NASDAQ
Clearfield Inc
TELECOMMUNICATIONS - Cables / Satalite Equipment
|
$37.20
|
-0.17
-0.45% |
$38.00
|
87,817
67.04% of 50 DAV
50 DAV is 131,000
|
$40.26
-7.60%
|
4/26/2021
|
$39.68
|
PP = $38.85
|
|
MB = $40.79
|
Most Recent Note - 5/19/2021 2:58:02 PM
Y - On track for a 5th consecutive small gain today with light volume. Fundamentals remain strong after it reported Mar '21 quarterly earnings +440% on +45% sales revenues versus the year ago period, continuing its strong earnings track record.
>>> FEATURED STOCK ARTICLE : Rallied Straight Up From Bottom of 10-Week Base - 4/26/2021 |
View all notes |
Set NEW NOTE alert |
Company Profile |
SEC
News |
Chart |
Request a new note
C
A
S
I |
FSBW
-
NASDAQ
F S Bancorp
Banks-West/Southwest
|
$70.25
|
+1.24
1.80% |
$70.25
|
25,596
196.89% of 50 DAV
50 DAV is 13,000
|
$73.62
-4.58%
|
5/18/2021
|
$70.16
|
PP = $73.72
|
|
MB = $77.41
|
Most Recent Note - 5/18/2021 4:53:22 PM
Y - Color code was changed to yellow with pivot point cited based on its 3/08/21 high plus 10 cents. Consolidating above its 50 DMA line ($68.54) where it found prompt support during its ongoing ascent. Subsequent gains above the pivot point backed by at least +40% above average volume are needed to trigger a technical buy signal. Reported Mar '21 quarterly earnings +137% on +16% sales revenues versus the year ago period, its 4th consecutive strong quarterly comparison above the +25% minimum earnings guideline (C criteria), matching the fact-based investment system's winning models. Its annual earnings (A criteria) history has been great. This thinly traded Bank completed a new Public Offering on 9/08/17. See the latest FSU analysis for more details and a new annotated graph.
>>> FEATURED STOCK ARTICLE : Thinly-Traded Bank Consolidating Above 50-Day Moving Average - 5/18/2021 |
View all notes |
Set NEW NOTE alert |
Company Profile |
SEC
News |
Chart |
Request a new note
C
A
S
I |
SMPL
-
NASDAQ
Simply Good Foods Co
Food-Confectionery
|
$34.17
|
-0.21
-0.61% |
$34.44
|
463,519
65.56% of 50 DAV
50 DAV is 707,000
|
$35.34
-3.31%
|
12/28/2020
|
$30.40
|
PP = $31.44
|
|
MB = $33.01
|
Most Recent Note - 5/18/2021 3:59:02 PM
G - Rebounding above its 50 DMA line ($32.74) with today's big gain backed by above average volume, raising concerns. Reported Feb '21 quarterly earnings +9% on +2% sales revenues versus the year ago period, below the +25% minimum earnings guideline (C criteria), raising fundamental concerns. Its current Relative Strength Rating is 71, below the 80+ minimum guideline for buy candidates.
>>> FEATURED STOCK ARTICLE : Hovering Near All-Time High Following Lackluster Quarter - 5/10/2021 |
View all notes |
Set NEW NOTE alert |
Company Profile |
SEC
News |
Chart |
Request a new note
C
A
S
I |
IBP
-
NYSE
"Installed Building Products, Inc"
DIVERSIFIED SERVICES - Business/Management Services
|
$116.47
|
+1.63
1.42% |
$118.30
|
184,432
73.83% of 50 DAV
50 DAV is 249,800
|
$140.58
-17.15%
|
4/19/2021
|
$131.15
|
PP = $130.21
|
|
MB = $136.72
|
Most Recent Note - 5/18/2021 4:56:39 PM
G - Slumped below its 50 DMA line ($121) with today's 2nd consecutive loss with light volume. More damaging losses below the prior low ($115.46 on 5/12/21) would raise serious concerns. Weak action came after it reported Mar '21 quarterly earnings +15% on +10% sales revenues versus the year ago period, below the +25% minimum earnings guideline (C criteria) raising fundamental concerns.
>>> FEATURED STOCK ARTICLE : Rebound Above 50-Day Moving Average Helped Technical Stance - 5/14/2021 |
View all notes |
Set NEW NOTE alert |
Company Profile |
SEC
News |
Chart |
Request a new note
C
A
S
I |
QRVO
-
NASDAQ
"Qorvo, Inc"
ELECTRONICS - Semiconductor - Integrated Cir
|
$177.72
|
+3.57
2.05% |
$178.75
|
1,022,394
87.26% of 50 DAV
50 DAV is 1,171,700
|
$201.68
-11.88%
|
4/1/2021
|
$190.48
|
PP = $191.92
|
|
MB = $201.52
|
Most Recent Note - 5/20/2021 5:43:02 PM
G - Posted another gain today with light volume after violating its 50 DMA line with a damaging volume-driven loss triggering a technical sell signal. A rebound above the 50 DMA line ($183) is needed for its outlook to improve. Its Relative Strength Rating is 70, below the 80+ minimum for buy candidates. Reported Mar '21 quarterly earnings +75% on +36% sales revenues versus the year ago period, its 3rd very strong quarterly comparison. It stalled after recently wedging up to new highs from a 9-week base.
>>> FEATURED STOCK ARTICLE : Quiet Gain For Best Ever Close - 4/29/2021 |
View all notes |
Set NEW NOTE alert |
Company Profile |
SEC
News |
Chart |
Request a new note
C
A
S
I |
Symbol/Exchange
Company Name
Industry Group |
PRICE |
CHANGE
(%Change) |
Day High |
Volume
(% DAV)
(% 50 day avg vol) |
52 Wk Hi
% From Hi |
Featured
Date |
Price
Featured |
Pivot Featured |
|
Max Buy |
YETI
-
NYSE
Yeti Holdings Inc
Leisure-Products
|
$85.51
|
+1.06
1.26% |
$85.60
|
1,042,863
74.49% of 50 DAV
50 DAV is 1,400,000
|
$90.65
-5.67%
|
5/13/2021
|
$84.20
|
PP = $90.65
|
|
MB = $95.18
|
Most Recent Note - 5/17/2021 12:56:01 PM
Y - Quickly rebounded after a pullback last week tested support at its 50 DMA line and prior high. Reported Mar 21 quarterly earnings +245% on +42% sales revenues versus the year ago period, continuing its strong earnings track record. Color code was changed to yellow as it was noted that a valid secondary buy point exists from its 10 WMA line up to 5% above the latest high.
>>> FEATURED STOCK ARTICLE : Hovering Near Record High Following Volume-Driven Gains - 5/3/2021 |
View all notes |
Set NEW NOTE alert |
Company Profile |
SEC
News |
Chart |
Request a new note
C
A
S
I |
MRBK
-
NASDAQ
Meridian Corp
Banks-Northeast
|
$27.66
|
-0.16
-0.58% |
$27.75
|
15,849
44.03% of 50 DAV
50 DAV is 36,000
|
$29.18
-5.21%
|
5/18/2021
|
$25.58
|
PP = $28.06
|
|
MB = $29.46
|
Most Recent Note - 5/18/2021 3:57:55 PM
Y - New pivot point is cited based on its 3/11/21 high plus 10 cents. Hitting a new 52-week high with today's big volume-driven gain clearing an orderly consolidation. Reported Mar '21 earnings +323% on +93% sales revenues versus the year ago period, continuing its strong earnings track record. Recent low ($24.01 on 4/21/21) defines important near-term support where any violation may trigger a worrisome technical sell signal. Its Relative Strength Rating is 80, at the 80 minimum guideline.
>>> FEATURED STOCK ARTICLE : Bank Consolidating Near 50 Day Moving Average Line - 5/7/2021 |
View all notes |
Set NEW NOTE alert |
Company Profile |
SEC
News |
Chart |
Request a new note
C
A
S
I |
CLAR
-
NASDAQ
Clarus Corporation
Leisure-Products
|
$21.48
|
+0.15
0.70% |
$21.58
|
238,021
144.26% of 50 DAV
50 DAV is 165,000
|
$22.27
-3.55%
|
5/12/2021
|
$21.40
|
PP = $19.73
|
|
MB = $20.72
|
Most Recent Note - 5/20/2021 12:18:30 PM
G - Extended from the previously noted base. Prior high ($19.63 on 3/09/21) defines initial support to watch above its 50 DMA line ($18.37).
>>> FEATURED STOCK ARTICLE : 4 Volume-Driven Gains Into New High Territory - 5/12/2021 |
View all notes |
Set NEW NOTE alert |
Company Profile |
SEC
News |
Chart |
Request a new note
C
A
S
I |
|
|
|
THESE ARE NOT BUY RECOMMENDATIONS!
Comments contained in the body of this report are technical
opinions only. The material herein has been obtained
from sources believed to be reliable and accurate, however,
its accuracy and completeness cannot be guaranteed.
This site is not an investment advisor, hence it does
not endorse or recommend any securities or other investments.
Any recommendation contained in this report may not
be suitable for all investors and it is not to be deemed
an offer or solicitation on our part with respect to
the purchase or sale of any securities. All trademarks,
service marks and trade names appearing in this report
are the property of their respective owners, and are
likewise used for identification purposes only.
This report is a service available
only to active Paid Premium Members.
You may opt-out of receiving report notifications
at any time. Questions or comments may be submitted
by writing to Premium Membership Services 665 S.E. 10 Street, Suite 201 Deerfield Beach, FL 33441-5634 or by calling 1-800-965-8307
or 954-785-1121.
|
|
|