You are not logged in.
This means you
CAN ONLY VIEW reports that were published prior to Thursday, March 20, 2025.
You
MUST UPGRADE YOUR MEMBERSHIP if you want to see any current reports.
AFTER MARKET UPDATE - THURSDAY, MAY 6TH, 2021
Previous After Market Report Next After Market Report >>>
|
|
|
|
DOW |
+318.19 |
34,548.53 |
+0.93% |
|
Volume |
1,004,424,559 |
+8% |
|
Volume |
4,975,800,100 |
+11% |
|
NASDAQ |
+47.53 |
13,629.95 |
+0.35% |
|
Advancers |
1,799 |
55% |
|
Advancers |
1,681 |
42% |
|
S&P 500 |
+34.03 |
4,201.62 |
+0.82% |
|
Decliners |
1,444 |
45% |
|
Decliners |
2,341 |
58% |
|
Russell 2000 |
+0.05 |
2,241.42 |
+0.00% |
|
52 Wk Highs |
390 |
|
|
52 Wk Highs |
185 |
|
|
S&P 600 |
+7.80 |
1,361.61 |
+0.58% |
|
52 Wk Lows |
37 |
|
|
52 Wk Lows |
146 |
|
|
 |
Major Indices Rise While Internals Remain Mixed
Kenneth J. Gruneisen - Passed the CAN SLIM® Master's Exam
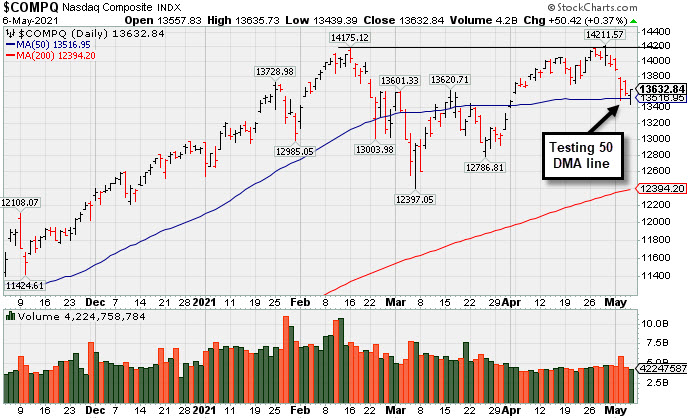
The Dow jumped 318 points to its 23rd record high of 2021, and remains on track to notch a weekly gain for the first time in three weeks. The S&P 500 climbed 0.8%, while the Nasdaq Composite added 0.4%, snapping a four session losing streak. Still, the tech-heavy index is poised to notch a more than 2% weekly decline as a trend in favoring cyclical and value stocks over growth-oriented shares reemerged this week. The volume totals reported were higher than the prior session on the NYSE and on the Nasdaq exchange. Breadth was mixed as decliners led advancers by a 3-2 margin on the Nasdaq exchange while advancers led decliners by an 9-7 margin on the NYSE. There were 89 high-ranked companies from the Leaders List that hit new 52-week highs and were listed on the BreakOuts Page, versus the total of 98 on the prior session. New 52-week highs totals outnumbered new 52-week lows totals on both the NYSE and the Nasdaq exchange. The major indices (M criteria) are in a confirmed uptrend. Investors are reminded to always make buying and selling decisions on case-by-case basis under the strict criteria and rules of the fact-based investment system.
PICTURED: The Nasdaq Composite Index stalled after recently reaching a new record high. It is consolidating near its 50-day moving average (DMA) line.
U.S. stocks ended higher on Thursday as investors digested the latest unemployment data. On the data front, first-time unemployment claims came in at 498,000 in the latest week, representing a new pandemic low. Market participants will now await Friday’s jobs report, which is projected to show the U.S. economy added 1 million nonfarm payrolls in April. Treasuries were little changed, with the yield on the 10-year note unchanged at 1.57%. In commodities, WTI crude fell 1.2% to $64.86/barrel, easing from its strongest level since mid-March. COMEX gold jumped 1.7% to $1815.20/ounce amid a 0.5% decline in the U.S. dollar.
All 11 S&P 500 sectors finished in positive territory, with Financials pacing the gains. The Consumer Staples group also outperformed, with Kellogg (K +7.07%) rallying after first quarter organic sales unexpectedly grew. Health Care lagged as pharmaceutical companies came under pressure following yesterday’s reports that the Biden administration supported waiving intellectual property protections for COVID-19 vaccines. A big drop in Cardinal Health (CAH -7.05%) shares also weighed on the sector, as the company missed analysts’ top and bottom line estimates. In other earnings, Etsy (ETSY -14.57%) gapped down and violated its 200 DMA line after warning that second-quarter sales growth would likely slow. |
 Kenneth J. Gruneisen started out as a licensed stockbroker in August 1987, a couple of months prior to the historic stock market crash that took the Dow Jones Industrial Average down -22.6% in a single day. He has published daily fact-based fundamental and technical analysis on high-ranked stocks online for two decades. Through FACTBASEDINVESTING.COM, Kenneth provides educational articles, news, market commentary, and other information regarding proven investment systems that work in good times and bad.
Comments contained in the body of this report are technical opinions only and are not necessarily those of Gruneisen Growth Corp. The material herein has been obtained from sources believed to be reliable and accurate, however, its accuracy and completeness cannot be guaranteed. Our firm, employees, and customers may effect transactions, including transactions contrary to any recommendation herein, or have positions in the securities mentioned herein or options with respect thereto. Any recommendation contained in this report may not be suitable for all investors and it is not to be deemed an offer or solicitation on our part with respect to the purchase or sale of any securities. |
|
 |
Gold & Silver, Energy, Retail, Financial, and Tech Indexes Rose
Kenneth J. Gruneisen - Passed the CAN SLIM® Master's Exam
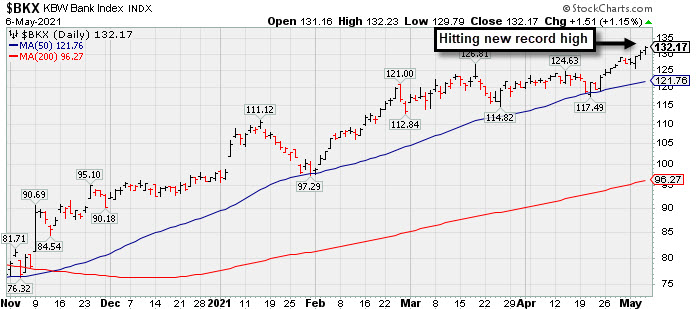
The Bank Index ($BKX +1.15%) outpaced the Broker/Dealer Index ($XBD +0.30%), and the Retail Index ($RLX +0.99%) also was a positive influence on the major averages. The Networking Index ($NWX +1.48%) led the tech sector higher while the Semiconductor Index ($SOX +0.84%) posted a smaller gain and the Biotech Index ($BTK +0.16%) also inched higher. The Gold & Silver Index ($XAU +3.89%) posted a standout gain. The Oil Services Index ($OSX +1.16%) rose and Integrated Oil Index ($XOI +0.35%) also edged higher. PICTURED: The Bank Index ($BKX +1.15%) recently found prompt support at its 50-day moving average (DMA) line and made steady progress to new record highs.
| Oil Services |
$OSX |
58.69 |
+0.67 |
+1.16% |
+32.39% |
| Integrated Oil |
$XOI |
1,083.22 |
+3.82 |
+0.35% |
+36.69% |
| Semiconductor |
$SOX |
3,068.53 |
+25.65 |
+0.84% |
+9.77% |
| Networking |
$NWX |
798.31 |
+11.63 |
+1.48% |
+11.32% |
| Broker/Dealer |
$XBD |
465.87 |
+1.40 |
+0.30% |
+23.38% |
| Retail |
$RLX |
3,914.21 |
+38.22 |
+0.99% |
+9.85% |
| Gold & Silver |
$XAU |
153.85 |
+5.76 |
+3.89% |
+6.70% |
| Bank |
$BKX |
132.17 |
+1.51 |
+1.15% |
+34.99% |
| Biotech |
$BTK |
5,477.87 |
+9.02 |
+0.16% |
-4.55% |
|
|
|
 |
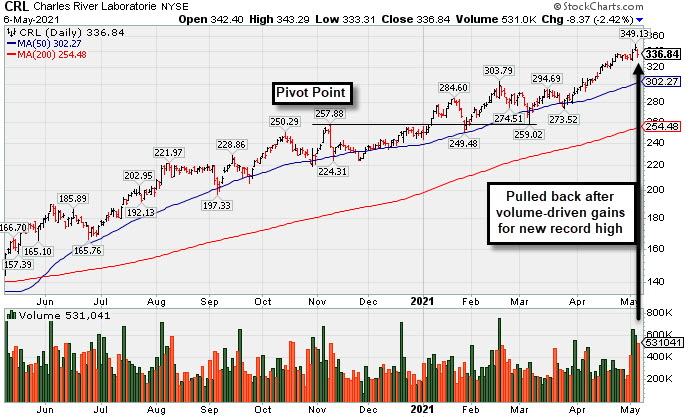
Pulling Back From Record High Following Strong Quarterly Report
Kenneth J. Gruneisen - Passed the CAN SLIM® Master's Exam
Charles River Labs Intl (CRL -$8.37 or -2.42% to $336.84) pulled from its all-time high with today's volume-driven loss following 2 volume-driven gains. It is extended from any sound base. Its 50-day moving average (DMA) line ($302.27) acted as support throughout its ongoing ascent.
Recently CRL reported Mar '21 quarterly earnings +38% on +17% sales revenues versus the year ago period. Two of the 3 latest quarterly comparisons have been above the +25% minimum earnings guideline (C criteria). It has a 90 Earnings Per Share Rating. The Medical - Research Equipment/Services industry group currently has a mediocre C- (37) Group Relative Strength Rating (L criteria). CRL traded up as much as +81% since it was highlighted in yellow with pivot point cited based on its 6/03/20 high plus 10 cents in the 7/15/20 mid-day report (read here). It was last shown in this FSU section on 4/09/21 with an annotated graph under the headline, "Perched at Record High After Rally From 50-Day Moving Average".
The number of top-rated funds owning its shares rose from 681 in Dec '19 to 879 in Mar '21, and its Up/Down Volume Ratio is 1.8 is an unbiased indication its shares have been under accumulation over the past 50 days. There is a small number of only 50.3 million shares (S criteria) outstanding, which can contribute to greater price volatility in the event of institutional buying or selling.
|
|
|
Color Codes Explained :
Y - Better candidates highlighted by our
staff of experts.
G - Previously featured
in past reports as yellow but may no longer be buyable under the
guidelines.
***Last / Change / Volume data in this table is the closing quote data***
Symbol/Exchange
Company Name
Industry Group |
PRICE |
CHANGE
(%Change) |
Day High |
Volume
(% DAV)
(% 50 day avg vol) |
52 Wk Hi
% From Hi |
Featured
Date |
Price
Featured |
Pivot Featured |
|
Max Buy |
 SIVB
-
NASDAQ
SIVB
-
NASDAQ
S V B Financial Group
BANKING - Regional - Pacific Banks
|
$578.96
|
-2.63
-0.45% |
$583.25
|
291,722
52.28% of 50 DAV
50 DAV is 558,000
|
$586.78
-1.33%
|
4/23/2021
|
$579.70
|
PP = $577.16
|
|
MB = $606.02
|
Most Recent Note - 5/5/2021 5:39:19 PM
Y - Posted another gain today with below average volume, wedging higher for a best-ever close. Confirming volume-driven gains are still needed to help clinch a convincing technical buy signal. Bullish action came after it reported earnings +293% on +64% sales revenues for the Mar '21 quarter versus the year ago period, its 3rd strong comparison. Completed a new Public Offering on 3/24/21.
>>> FEATURED STOCK ARTICLE : Hit New High But Closed Below Pivot Point - 4/23/2021 |
View all notes |
Set NEW NOTE alert |
Company Profile |
SEC
News |
Chart |
Request a new note
C
A
S
I |
CROX
-
NASDAQ
Crocs Inc
CONSUMER NON-DURABLES - Textile - Apparel Footwear
|
$106.17
|
-0.19
-0.18% |
$106.62
|
1,344,097
99.05% of 50 DAV
50 DAV is 1,357,000
|
$107.75
-1.47%
|
4/27/2021
|
$99.81
|
PP = $86.50
|
|
MB = $90.83
|
Most Recent Note - 5/4/2021 5:46:16 PM
G - Hit another new all-time high with today's volume-driven gain, getting very extended from the latest base. Prior highs in the $86 area define initial support to watch on pullbacks.
>>> FEATURED STOCK ARTICLE : Powerful "Breakaway Gap" for CROX - 4/27/2021 |
View all notes |
Set NEW NOTE alert |
Company Profile |
SEC
News |
Chart |
Request a new note
C
A
S
I |
RCKY
-
NASDAQ
Rocky Brands Inc
CONSUMER NON-DURABLES - Textile - Apparel Footwear
|
$64.45
|
+1.95
3.12% |
$69.00
|
181,273
215.80% of 50 DAV
50 DAV is 84,000
|
$66.06
-2.44%
|
5/5/2021
|
$61.65
|
PP = $61.55
|
|
MB = $64.63
|
 Most Recent Note - 5/6/2021 1:06:28 PM
G - Hitting another new high and rallying above its "max buy" level with today's big volume-driven gain and its color code is changed to green. Finished in the middle of its intra-day range after highlighted in yellow in the 5/05/21 mid-day report with a pivot point cited based on its 4/05/21 high following a 4-week square box base. Gapped up hitting a new all-time high and triggering a technical buy signal with a big volume-driven gain. Bullish action came after it reported Mar '21 quarterly earnings +341% on +57% sales revenues versus the year ago period, its 3rd strong quarterly comparison. Annual earnings (A criteria) history has been strong since a downturn in FY '16.
>>> FEATURED STOCK ARTICLE : Rocky Brands Powered Higher After Strong Earnings - 5/5/2021 |
View all notes |
Set NEW NOTE alert |
Company Profile |
SEC
News |
Chart |
Request a new note
C
A
S
I |
CRL
-
NYSE
Charles River Labs Intl
DRUGS - Biotechnology
|
$336.84
|
-8.37
-2.42% |
$343.29
|
529,363
170.21% of 50 DAV
50 DAV is 311,000
|
$349.13
-3.52%
|
12/17/2020
|
$247.06
|
PP = $257.98
|
|
MB = $270.88
|
Most Recent Note - 5/6/2021 6:06:23 PM
G - Pulled back from its all-time high with today's loss following 2 consecutive volume-driven gains. Very extended from any sound base. Its 50 DMA line ($302) acted as support throughout its ongoing ascent. Reported Mar '21 quarterly earnings +38% on +17%v sales revenues versus the year ago period. Two of the past 3 quarterly comparisons have been above the +25% minimum earnings guideline (C criteria). See the latest FSU analysis for more details and a new annotated graph.
>>> FEATURED STOCK ARTICLE : Pulling Back From Record High Following Strong Quarterly Report - 5/6/2021 |
View all notes |
Set NEW NOTE alert |
Company Profile |
SEC
News |
Chart |
Request a new note
C
A
S
I |
CAMT
-
NASDAQ
Camtek Ltd
ELECTRONICS - Scientific and Technical Instrum
|
$30.00
|
-1.50
-4.76% |
$31.61
|
649,226
205.45% of 50 DAV
50 DAV is 316,000
|
$36.14
-16.99%
|
4/28/2021
|
$35.03
|
PP = $35.34
|
|
MB = $37.11
|
Most Recent Note - 5/5/2021 12:21:59 PM
Y - Holding its ground today. Volume was higher on the prior session behind a 4th consecutive loss, action indicative of distributional pressure. Subsequent gains and a strong close above the pivot point backed by at least +40% above average volume are needed to trigger a technical buy signal. Completed a new Public Offering on 11/19/20. Found prompt support near its 50 DMA line ($30.75) during recent consolidations. Reported earnings +267% on +90% sales revenues for the Mar '21 quarter versus the year ago period, its 3rd strong quarterly comparison well above the +25% minimum guideline and showing impressive sequential acceleration. This Israeli Electronics firm has a strong annual earnings (A criteria) history.
>>> FEATURED STOCK ARTICLE : Earnings Acceleration and Perched at High After Ascending Base - 4/28/2021 |
View all notes |
Set NEW NOTE alert |
Company Profile |
SEC
News |
Chart |
Request a new note
C
A
S
I |
Symbol/Exchange
Company Name
Industry Group |
PRICE |
CHANGE
(%Change) |
Day High |
Volume
(% DAV)
(% 50 day avg vol) |
52 Wk Hi
% From Hi |
Featured
Date |
Price
Featured |
Pivot Featured |
|
Max Buy |
BRKS
-
NASDAQ
Brooks Automation
ELECTRONICS - Semiconductor Equipment and Mate
|
$94.64
|
-0.06
-0.06% |
$94.77
|
643,519
84.90% of 50 DAV
50 DAV is 758,000
|
$108.72
-12.95%
|
4/5/2021
|
$99.31
|
PP = $91.88
|
|
MB = $96.47
|
Most Recent Note - 5/4/2021 5:41:59 PM
Y - Volume was above average behind today's 4th consecutive loss. Color code is changed to yellow while testing support near prior highs in the $91 area and its 50 DMA line ($89.92). More damaging losses would raise concerns and trigger technical sell signals.
>>> FEATURED STOCK ARTICLE : Extended From Base and Consolidating After Recent Rally - 4/30/2021 |
View all notes |
Set NEW NOTE alert |
Company Profile |
SEC
News |
Chart |
Request a new note
C
A
S
I |
ENTG
-
NASDAQ
Entegris Inc
ELECTRONICS - Semiconductor Equipment and Mate
|
$111.30
|
+0.60
0.54% |
$111.31
|
767,067
83.74% of 50 DAV
50 DAV is 916,000
|
$126.41
-11.95%
|
4/1/2021
|
$118.42
|
PP = $110.37
|
|
MB = $115.89
|
Most Recent Note - 5/4/2021 5:50:12 PM
G - Color code is changed to green after a volume-driven loss today, slumping below the prior high in the $110 area and closing below its 50 DMA line ($109.54). Only a prompt rebound would help its outlook improve.
>>> FEATURED STOCK ARTICLE : Negated Recent Breakout and Sputtering Near Prior High - 4/22/2021 |
View all notes |
Set NEW NOTE alert |
Company Profile |
SEC
News |
Chart |
Request a new note
C
A
S
I |
OPY
-
NYSE
Oppenheimer Holdings Inc
FINANCIAL SERVICES - Investment Brokerage - Regiona
|
$50.14
|
-0.20
-0.40% |
$51.02
|
99,668
78.48% of 50 DAV
50 DAV is 127,000
|
$52.45
-4.40%
|
2/25/2021
|
$38.95
|
PP = $38.11
|
|
MB = $40.02
|
Most Recent Note - 5/4/2021 12:40:38 PM
G - Powered higher in recent weeks and it is very extended from any sound base. Bullish action came after it reported Mar '21 quarterly earnings +402% on +59% sales revenues versus the year ago period. Prior high in the $44 area defines initial support to watch above its 50 DMA line ($42.67).
>>> FEATURED STOCK ARTICLE : Negative Reversal After 7 Consecutive Gains - 4/20/2021 |
View all notes |
Set NEW NOTE alert |
Company Profile |
SEC
News |
Chart |
Request a new note
C
A
S
I |
LAD
-
NYSE
Lithia Motors Inc Cl A
SPECIALTY RETAIL - Auto Dealerships
|
$380.32
|
-0.53
-0.14% |
$383.75
|
222,039
73.77% of 50 DAV
50 DAV is 301,000
|
$417.98
-9.01%
|
4/21/2021
|
$377.00
|
PP = $418.08
|
|
MB = $438.98
|
Most Recent Note - 5/5/2021 5:44:36 PM
G - Volume was higher (near average ) as it sputtered to a close below its 50 DMA line ($386) and its color code is changed to green. A prompt rebound above its 50 DMA line is needed for its outlook to improve. Subsequent gains above the pivot point backed by at least +40% above average volume are needed to trigger a technical buy signal.
>>> FEATURED STOCK ARTICLE : Building a Base With Rebound Above 50-Day Moving Average - 4/21/2021 |
View all notes |
Set NEW NOTE alert |
Company Profile |
SEC
News |
Chart |
Request a new note
C
A
S
I |
CLFD
-
NASDAQ
Clearfield Inc
TELECOMMUNICATIONS - Cables / Satalite Equipment
|
$38.73
|
+1.34
3.58% |
$38.79
|
214,322
153.09% of 50 DAV
50 DAV is 140,000
|
$40.26
-3.80%
|
4/26/2021
|
$39.68
|
PP = $38.85
|
|
MB = $40.79
|
Most Recent Note - 5/6/2021 6:12:28 PM
Y - Posted a 4th consecutive gain today with higher volume for its second-best ever close. Fundamentals remain strong after it reported Mar '21 quarterly earnings +440% on +45% sales revenues versus the year ago period, continuing its strong earnings track record.
>>> FEATURED STOCK ARTICLE : Rallied Straight Up From Bottom of 10-Week Base - 4/26/2021 |
View all notes |
Set NEW NOTE alert |
Company Profile |
SEC
News |
Chart |
Request a new note
C
A
S
I |
Symbol/Exchange
Company Name
Industry Group |
PRICE |
CHANGE
(%Change) |
Day High |
Volume
(% DAV)
(% 50 day avg vol) |
52 Wk Hi
% From Hi |
Featured
Date |
Price
Featured |
Pivot Featured |
|
Max Buy |
EDUC
-
NASDAQ
Educational Development
WHOLESALE - Basic Materials Wholesale
|
$16.96
|
-0.58
-3.31% |
$17.39
|
26,043
104.17% of 50 DAV
50 DAV is 25,000
|
$20.00
-15.20%
|
3/10/2021
|
$17.89
|
PP = $20.10
|
|
MB = $21.11
|
Most Recent Note - 5/4/2021 5:47:42 PM
Y - Volume totals have been cooling while consolidating above its 50 DMA line ($17.32) which defines important near-term support. Met stubborn resistance in the $19-20 area. Subsequent gains above the pivot point backed by at least +40% above average volume are needed to trigger a proper technical buy signal.
>>> FEATURED STOCK ARTICLE : Finding Support During Consolidation Above 50-Day Moving Average - 4/16/2021 |
View all notes |
Set NEW NOTE alert |
Company Profile |
SEC
News |
Chart |
Request a new note
C
A
S
I |
SMPL
-
NASDAQ
Simply Good Foods Co
Food-Confectionery
|
$34.79
|
+0.87
2.56% |
$35.05
|
373,698
54.40% of 50 DAV
50 DAV is 687,000
|
$35.34
-1.56%
|
12/28/2020
|
$30.40
|
PP = $31.44
|
|
MB = $33.01
|
Most Recent Note - 5/6/2021 6:09:08 PM
G - Still perched at its all-time high, stubbornly holding its ground with volume totals cooling. Reported Feb '21 quarterly earnings +9% on +2% sales revenues versus the year ago period, below the +25% minimum earnings guideline (C criteria), raising fundamental concerns. Its 50 DMA line ($32.11) defines important near-term support to watch on pullbacks. Its current Relative Strength Rating is 80, right at the 80+ minimum guideline for buy candidates.
>>> FEATURED STOCK ARTICLE : Perched Near High But Fundamental Concerns Were Raised - 4/14/2021 |
View all notes |
Set NEW NOTE alert |
Company Profile |
SEC
News |
Chart |
Request a new note
C
A
S
I |
IBP
-
NYSE
Installed Building Prod
DIVERSIFIED SERVICES - Business/Management Services
|
$137.92
|
-0.87
-0.63% |
$139.76
|
436,025
197.30% of 50 DAV
50 DAV is 221,000
|
$140.58
-1.89%
|
4/19/2021
|
$131.15
|
PP = $130.21
|
|
MB = $136.72
|
Most Recent Note - 5/5/2021 5:42:12 PM
G - Color code is changed to green as it touched another new all-time high above is "max buy" level today but reversed into the red for a loss backed by higher (above average) volume. Prior high in the $130 area defines initial support to watch on pullbacks.
>>> FEATURED STOCK ARTICLE : Steady Streak of Gains Into New High Territory - 4/19/2021 |
View all notes |
Set NEW NOTE alert |
Company Profile |
SEC
News |
Chart |
Request a new note
C
A
S
I |
QRVO
-
NASDAQ
"Qorvo, Inc"
ELECTRONICS - Semiconductor - Integrated Cir
|
$184.69
|
+2.13
1.17% |
$188.32
|
1,920,117
171.62% of 50 DAV
50 DAV is 1,118,800
|
$201.68
-8.42%
|
4/1/2021
|
$190.48
|
PP = $191.92
|
|
MB = $201.52
|
Most Recent Note - 5/6/2021 1:04:00 PM
Y - Reported Mar '21 quarterly earnings +75% on +36% sales revenues versus the year ago period, its 3rd very strong quarterly comparison. Finding support near its 50 DMA line ($183) this week. That important short-term average acted as support when it stalled after recently wedging up to new highs from a 9-week base. Its Relative Strength Rating is 67, below the 80+ minimum for buy candidates, yet it is only -7.3% off its high.
>>> FEATURED STOCK ARTICLE : Quiet Gain For Best Ever Close - 4/29/2021 |
View all notes |
Set NEW NOTE alert |
Company Profile |
SEC
News |
Chart |
Request a new note
C
A
S
I |
YETI
-
NYSE
Yeti Holdings Inc
Leisure-Products
|
$88.11
|
+1.41
1.63% |
$88.15
|
1,081,626
86.88% of 50 DAV
50 DAV is 1,245,000
|
$89.70
-1.77%
|
4/6/2021
|
$76.95
|
PP = $79.42
|
|
MB = $83.39
|
Most Recent Note - 5/6/2021 6:11:00 PM
G - Stubbornly holding its ground in a tight range near its all-time high, extended from the latest base. Prior highs in the $80 area define initial support to watch on pullbacks.
>>> FEATURED STOCK ARTICLE : Hovering Near Record High Following Volume-Driven Gains - 5/3/2021 |
View all notes |
Set NEW NOTE alert |
Company Profile |
SEC
News |
Chart |
Request a new note
C
A
S
I |
Symbol/Exchange
Company Name
Industry Group |
PRICE |
CHANGE
(%Change) |
Day High |
Volume
(% DAV)
(% 50 day avg vol) |
52 Wk Hi
% From Hi |
Featured
Date |
Price
Featured |
Pivot Featured |
|
Max Buy |
MRBK
-
NASDAQ
Meridian Corp
Banks-Northeast
|
$25.89
|
-0.22
-0.84% |
$26.20
|
25,765
69.45% of 50 DAV
50 DAV is 37,100
|
$27.96
-7.40%
|
2/22/2021
|
$25.58
|
PP = $26.10
|
|
MB = $27.41
|
Most Recent Note - 5/5/2021 5:46:35 PM
Y - Suffered a 4th consecutive small loss today, still consolidating above its 50 DMA line ($25.83) and perched within striking distance of its 52-week high. Reported Mar '21 earnings +323% on +93% sales revenues versus the year ago period, continuing its strong earnings track record. Recent low ($24.01 on 4/21/21) defines important near-term support where any violation may trigger a worrisome technical sell signal. Its Relative Strength Rating is 76, below the 80 minimum guideline, however it is perched only -6.6% off its high..
>>> FEATURED STOCK ARTICLE : Encountering Distributional Pressure - 4/12/2021 |
View all notes |
Set NEW NOTE alert |
Company Profile |
SEC
News |
Chart |
Request a new note
C
A
S
I |
|
|
|
THESE ARE NOT BUY RECOMMENDATIONS!
Comments contained in the body of this report are technical
opinions only. The material herein has been obtained
from sources believed to be reliable and accurate, however,
its accuracy and completeness cannot be guaranteed.
This site is not an investment advisor, hence it does
not endorse or recommend any securities or other investments.
Any recommendation contained in this report may not
be suitable for all investors and it is not to be deemed
an offer or solicitation on our part with respect to
the purchase or sale of any securities. All trademarks,
service marks and trade names appearing in this report
are the property of their respective owners, and are
likewise used for identification purposes only.
This report is a service available
only to active Paid Premium Members.
You may opt-out of receiving report notifications
at any time. Questions or comments may be submitted
by writing to Premium Membership Services 665 S.E. 10 Street, Suite 201 Deerfield Beach, FL 33441-5634 or by calling 1-800-965-8307
or 954-785-1121.
|
|
|