You are not logged in.
This means you
CAN ONLY VIEW reports that were published prior to Friday, March 28, 2025.
You
MUST UPGRADE YOUR MEMBERSHIP if you want to see any current reports.
AFTER MARKET UPDATE - MONDAY, APRIL 3RD, 2017
Previous After Market Report Next After Market Report >>>
|
|
|
|
DOW |
-13.01 |
20,650.21 |
-0.06% |
|
Volume |
1,182,738,500 |
-12% |
|
Volume |
1,682,840,130 |
-2% |
|
NASDAQ |
-17.06 |
5,894.68 |
-0.29% |
|
Advancers |
1,288 |
44% |
|
Advancers |
803 |
28% |
|
S&P 500 |
-3.88 |
2,358.84 |
-0.16% |
|
Decliners |
1,643 |
56% |
|
Decliners |
2,065 |
72% |
|
Russell 2000 |
-16.25 |
1,369.67 |
-1.17% |
|
52 Wk Highs |
94 |
|
|
52 Wk Highs |
97 |
|
|
S&P 600 |
-15.80 |
828.37 |
-1.87% |
|
52 Wk Lows |
16 |
|
|
52 Wk Lows |
33 |
|
|
 |
Volume Lighter Behind Losses for Major Indices
Kenneth J. Gruneisen - Passed the CAN SLIM® Master's Exam
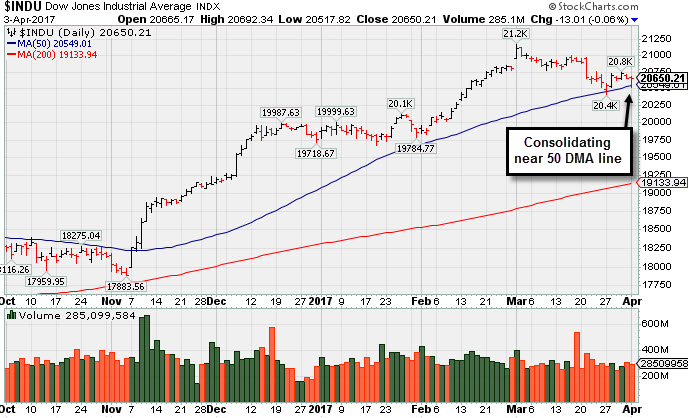
Stocks finished lower on Monday. The Dow was down 13 points to 20650. The S&P 500 lost 3 points to 2358 and the Nasdaq Composite fell 17 points to 5894. The volume totals reported were lighter than the prior session totals on the NYSE and on the Nasdaq exchange. Breadth was negative as decliners led advancers by a 4-3 margin on the NYSE and more than 2-1 on the Nasdaq exchange. There were 26 high-ranked companies from the Leaders List that made new 52-week highs and were listed on the BreakOuts Page, versus the total of 35 on the prior session. New 52-week highs totals outnumbered new 52-week lows on both the Nasdaq exchange and the NYSE.
PICTURED: The Dow Jones Industrial Average is consolidating above its 50-day moving average (DMA) line which recently acted as support. Subsequent losses leading to a 50 DMA line violation would raise concerns regarding the market rally's health.
Leadership has remained healthy with respect to the number of high-ranked stocks hitting new highs, although the major averages' (M criteria) uptrend recently came under pressure. New buying efforts should only be made in candidates with superior fundamental and technical characteristics. The Featured Stocks Page lists noteworthy high-ranked leaders.
The major averages declined on the session Monday as investors digested mixed economic data. Research firm Markit revealed that U.S. manufacturing PMI came in at 53.3 in March, slightly below expectations of 53.5. In a separate release, ISM's gauge of manufacturing activity fell to 57.2, below February's reading of 57.7. Finally, construction spending climbed 0.8% in February to the highest level since April 2006.
Seven of 11 sectors in the S&P 500 ended in negative territory. Financials lagged on the session with American International Group (AIG -1.03%) falling. Technology stocks underperformed with Accenture (ACN -1.87%) down after being the subject of negative analyst commentary. In the consumer space, the new General Motors Company (GM -3.37%) fell as March US auto sales came in firmly below expectations. Tesla (TSLA +7.27%) rose after the automaker delivered 25,000 vehicles during the first three months of 2017, its highest-ever quarterly total. Panera Bread (PNRA +7.93%) rose amid reports the restaurant chain is exploring a possible sale and has received takeover interest.
Treasuries advanced with the benchmark 10-year note up 14/32 to yield 2.34%. In commodities, NYMEX WTI crude lost 0.7% to $50.24/barrel. COMEX gold added 0.3% to $1250.80/ounce. In FOREX, the Dollar Index gained 0.2%. |
 Kenneth J. Gruneisen started out as a licensed stockbroker in August 1987, a couple of months prior to the historic stock market crash that took the Dow Jones Industrial Average down -22.6% in a single day. He has published daily fact-based fundamental and technical analysis on high-ranked stocks online for two decades. Through FACTBASEDINVESTING.COM, Kenneth provides educational articles, news, market commentary, and other information regarding proven investment systems that work in good times and bad.
Comments contained in the body of this report are technical opinions only and are not necessarily those of Gruneisen Growth Corp. The material herein has been obtained from sources believed to be reliable and accurate, however, its accuracy and completeness cannot be guaranteed. Our firm, employees, and customers may effect transactions, including transactions contrary to any recommendation herein, or have positions in the securities mentioned herein or options with respect thereto. Any recommendation contained in this report may not be suitable for all investors and it is not to be deemed an offer or solicitation on our part with respect to the purchase or sale of any securities. |
|
 |
Gold & Silver Index a Standout Gainer on Mostly Negative Session
Kenneth J. Gruneisen - Passed the CAN SLIM® Master's Exam
The Bank Index ($BKX -0.24%) and the Broker/Dealer Index ($XBD -0.94%) both fell along with the Retail Index ($RLX -0.47%) on Monday. The Gold & Silver Index ($XAU +1.83%) was a standout gainer, meanwhile, the Oil Services Index ($OSX -1.07%) and the Integrated Oil Index ($XOI -0.39%) ended the session lower. The tech sector saw unanimous losses from the Biotechnology Index ($BTK -1.32%), Networking Index ($NWX -1.01%), and the Semiconductor Index ($SOX -0.55%). Charts courtesy www.stockcharts.com
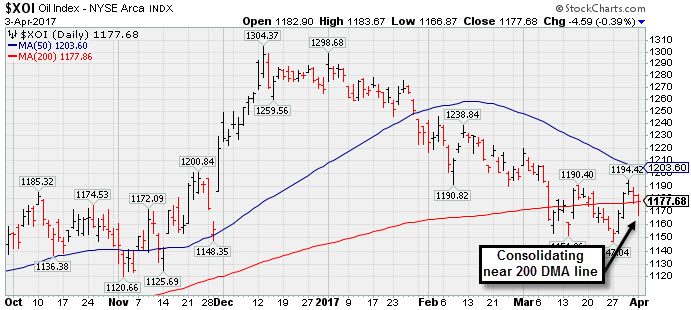 PICTURED: The Integrated Oil Index ($XOI -0.39%) is consolidating near its 200-day moving average (DMA) line, slumping toward prior lows.
| Oil Services |
$OSX |
167.94 |
-1.82 |
-1.07% |
-8.62% |
| Integrated Oil |
$XOI |
1,177.68 |
-4.59 |
-0.39% |
-7.12% |
| Semiconductor |
$SOX |
1,005.80 |
-5.60 |
-0.55% |
+10.96% |
| Networking |
$NWX |
448.67 |
-4.56 |
-1.01% |
+0.58% |
| Broker/Dealer |
$XBD |
213.93 |
-2.04 |
-0.94% |
+4.21% |
| Retail |
$RLX |
1,448.02 |
-6.83 |
-0.47% |
+7.82% |
| Gold & Silver |
$XAU |
85.30 |
+1.53 |
+1.83% |
+8.17% |
| Bank |
$BKX |
91.83 |
-0.22 |
-0.24% |
+0.04% |
| Biotech |
$BTK |
3,518.87 |
-47.14 |
-1.32% |
+14.43% |
|
|
|
 |
Perched Near High, Extended From Prior Base
Kenneth J. Gruneisen - Passed the CAN SLIM® Master's Exam
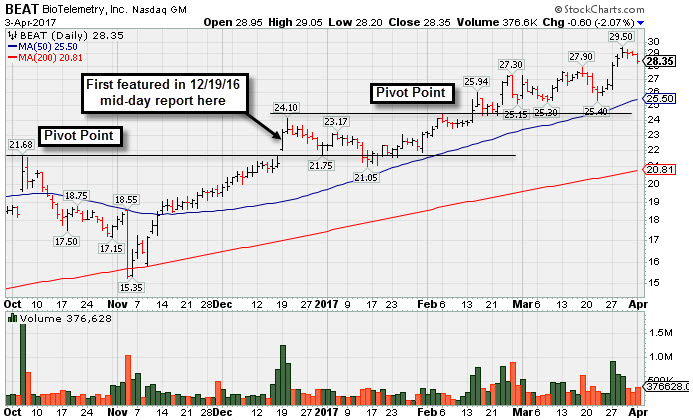
BioTelemetry Inc (BEAT -$0.60 or -2.07% to $28.35) pulled back from all-time high territory with a 3rd consecutive small loss. It is extended from its prior base. Disciplined investors avoid chasing extended stocks. Prior highs in the $24 area and its 50-day moving average (DMA) line ($25.50) define important near-term support to watch.
BEAT was last shown in this FSU section on 2/21/17 with an annotated graph under the headline, "Perched Near All-Time High With Earnings Report Due". It was highlighted in yellow in the 2/14/17 mid-day report with new pivot point cited based on its 2/06/17 high plus 10 cents after a saucer-with-handle base above its prior base (read here). The gain above its pivot point was backed by +121% above average volume triggering a new (or add-on) technical buy signal. It was first highlighted in yellow with pivot point cited based on its 10/05/16 high plus 10 cents in the 12/19/16 mid-day report (read here).
On 2/22/17 it reported Dec '16 quarterly earnings +52% on +15% sales revenues, continuing its strong earnings track record. It has the highest possible Earnings Per Share Rating of 99, well above the 80+ minimum guideline for buy candidates. Its quarterly and annual earnings history is a good match with the C and A criteria. Earnings per share rose +200%, +233%, +67%, and +62% in the Dec '15, Mar, Jun and Sep '16 quarters, respectively. During that same span the sales revenues increases were +7%, +12%, +18%, and +22%, showing encouraging acceleration.
Its current Up/Down Volume Ratio of 1.7 is an unbiased indication its shares have been under accumulation over the past 50 days. The number of top-rated funds owning its shares rose from 194 in Dec '15 to 274 in Dec '16.Increasing ownership by top-rated funds is a reassuring sign concerning the I criteria, and it has a small supply (S criteria) of only 28.4 million shares outstanding. |
|
|
Color Codes Explained :
Y - Better candidates highlighted by our
staff of experts.
G - Previously featured
in past reports as yellow but may no longer be buyable under the
guidelines.
***Last / Change / Volume data in this table is the closing quote data***
Symbol/Exchange
Company Name
Industry Group |
PRICE |
CHANGE
(%Change) |
Day High |
Volume
(% DAV)
(% 50 day avg vol) |
52 Wk Hi
% From Hi |
Featured
Date |
Price
Featured |
Pivot Featured |
|
Max Buy |
SBCF
-
NASDAQ
Seacoast Banking Corp Fl
BANKING - Regional - Mid-Atlantic Banks
|
$23.91
|
-0.07
-0.29% |
$24.04
|
288,941
67.99% of 50 DAV
50 DAV is 425,000
|
$25.13
-4.85%
|
2/13/2017
|
$24.84
|
PP = $23.10
|
|
MB = $24.26
|
Most Recent Note - 3/30/2017 5:20:22 PM
Y - Finished near the session high with below average volume behind today's gain for its 2nd best close ever. Subsequent deterioration below the 50 DMA line and recent low ($21.89 on 3/22/17) would raise more serious concerns and trigger worrisome technical sell signals. See the latest FSU analysis for more details and an annotated graph.
>>> FEATURED STOCK ARTICLE : Rebound After Slump Below 50-Day Average Into Prior Base - 3/28/2017 |
View all notes |
Set NEW NOTE alert |
Company Profile |
SEC
News |
Chart |
Request a new note
C
A
S
I |
CSFL
-
NASDAQ
Centerstate Banks Inc
Banks-Southeast
|
$25.63
|
-0.27
-1.04% |
$25.96
|
178,422
58.31% of 50 DAV
50 DAV is 306,000
|
$26.94
-4.85%
|
3/13/2017
|
$25.54
|
PP = $26.40
|
|
MB = $27.72
|
Most Recent Note - 3/30/2017 5:23:18 PM
Y - Rose near prior highs with today's 3rd consecutive gain after finding prompt support near its 50 DMA line and its color code is changed to yellow. Subsequent losses below its recent low ($23.70 on 3/27/17) would raise greater concerns.
>>> FEATURED STOCK ARTICLE : Gain Backed By Volume For Best Ever Close - 3/15/2017 |
View all notes |
Set NEW NOTE alert |
Company Profile |
SEC
News |
Chart |
Request a new note
C
A
S
I |
NSP
-
NYSE
Insperity Inc
Comml Svcs-Outsourcing
|
$85.00
|
-3.65
-4.12% |
$89.15
|
213,713
136.12% of 50 DAV
50 DAV is 157,000
|
$90.55
-6.13%
|
2/14/2017
|
$84.30
|
PP = $82.28
|
|
MB = $86.39
|
 Most Recent Note - 4/3/2017 5:49:03 PM
Y - Color code is changed to yellow after slumping to a close below its "max buy" level. Old highs the $82 area define support along with its 50 DMA line ($81.78).
>>> FEATURED STOCK ARTICLE : Ordinary Pullback From Highs With Lighter Volume - 3/22/2017 |
View all notes |
Set NEW NOTE alert |
Company Profile |
SEC
News |
Chart |
Request a new note
C
A
S
I |
EVR
-
NYSE
Evercore Partners Inc
FINANCIAL SERVICES - Investment Banking
|
$75.90
|
-2.00
-2.57% |
$78.25
|
238,674
54.99% of 50 DAV
50 DAV is 434,000
|
$83.30
-8.88%
|
1/5/2017
|
$71.40
|
PP = $72.07
|
|
MB = $75.67
|
Most Recent Note - 3/30/2017 5:16:35 PM
G - Posted a gain today with higher volume but still below average volume. Halted its slide after triggering technical sell signals and undercutting the prior low ($74.75 on 2/08/17), but a rebound above the 50-day moving average (DMA) line ($78.86) is still needed for its outlook to improve. See the latest FSU analysis for more details and a new annotated graph.
>>> FEATURED STOCK ARTICLE : Outlook Hurt By 50-Day Moving Average Breach and Fundamentals - 3/30/2017 |
View all notes |
Set NEW NOTE alert |
Company Profile |
SEC
News |
Chart |
Request a new note
C
A
S
I |
NTES
-
NASDAQ
Netease Inc Adr
INTERNET - Internet Information Providers
|
$285.22
|
+1.22
0.43% |
$286.88
|
859,917
75.30% of 50 DAV
50 DAV is 1,142,000
|
$308.66
-7.59%
|
2/10/2017
|
$259.30
|
PP = $272.68
|
|
MB = $286.31
|
Most Recent Note - 3/29/2017 5:10:54 PM
Y - Color code is changed to yellow after a loss with below average volume led to a pullback below its "max buy" level. Volume totals have been cooling while consolidating in a tight trading range following a big "breakaway gap" on 2/16/17. Prior highs in the $272 area define initial support to watch along with its 50 DMA line ($276).
>>> FEATURED STOCK ARTICLE : Consolidating in Tight Range Following Breakaway Gap - 3/23/2017 |
View all notes |
Set NEW NOTE alert |
Company Profile |
SEC
News |
Chart |
Request a new note
C
A
S
I |
Symbol/Exchange
Company Name
Industry Group |
PRICE |
CHANGE
(%Change) |
Day High |
Volume
(% DAV)
(% 50 day avg vol) |
52 Wk Hi
% From Hi |
Featured
Date |
Price
Featured |
Pivot Featured |
|
Max Buy |
HTHT
-
NASDAQ
China Lodging Group Ads
LEISURE - Lodging
|
$62.04
|
-0.01
-0.02% |
$62.50
|
134,292
91.36% of 50 DAV
50 DAV is 147,000
|
$64.32
-3.54%
|
9/29/2016
|
$46.12
|
PP = $47.82
|
|
MB = $50.21
|
Most Recent Note - 3/27/2017 6:41:31 PM
G - Hovering near all-time highs with volume totals cooling, holding its ground following volume-driven gains, Previously noted with caution - "Reported earnings +0% on +4% sales revenues for the Dec '16 quarter versus the year ago period, marking a 2nd comparison below the +25% minimum earnings guideline (C criteria), and its waning sales revenues growth rate is also a concern." See the latest FSU analysis for more details and an annotated graph.
>>> FEATURED STOCK ARTICLE : Bullish Action Led to +54% Rally Since First Featured - 3/17/2017 |
View all notes |
Set NEW NOTE alert |
Company Profile |
SEC
News |
Chart |
Request a new note
C
A
S
I |
SIRI
-
NASDAQ
Sirius X M Holdings Inc
MEDIA - Broadcasting - Radio
|
$5.10
|
-0.05
-0.97% |
$5.19
|
22,393,321
95.65% of 50 DAV
50 DAV is 23,411,000
|
$5.53
-7.78%
|
3/13/2017
|
$5.48
|
PP = $5.32
|
|
MB = $5.59
|
Most Recent Note - 3/30/2017 5:18:36 PM
Y - Below average volume was behind today's 4th consecutive gain. Volume totals have been cooling since its powerful breakout, but its slump into the previous short base raised concerns. Disciplined investors always limit losses by selling any stock that falls more than -7% from their purchase price. First highlighted in the 3/13/17 mid-day report (read here) in yellow with pivot point cited based on its 2/22/17 high plus 10 cents.
>>> FEATURED STOCK ARTICLE : Breakout From Advanced Base Pattern Backed By Very Heavy Volume - 3/13/2017 |
View all notes |
Set NEW NOTE alert |
Company Profile |
SEC
News |
Chart |
Request a new note
C
A
S
I |
BEAT
-
NASDAQ
BioTelemetry Inc
Medical-Services
|
$28.35
|
-0.60
-2.07% |
$29.05
|
376,578
106.08% of 50 DAV
50 DAV is 355,000
|
$29.50
-3.90%
|
2/14/2017
|
$25.10
|
PP = $24.55
|
|
MB = $25.78
|
Most Recent Note - 4/3/2017 5:44:01 PM
G - Pulled back from its all-time high with a 3rd consecutive small loss on near average volume. Extended from its prior base, and disciplined investors avoid chasing extended stocks. Prior highs in the $24 area and its 50 DMA line define important near-term support to watch. See the latest FSU analysis for more details and a new annotated graph.
>>> FEATURED STOCK ARTICLE : Perched Near High, Extended From Prior Base - 4/3/2017 |
View all notes |
Set NEW NOTE alert |
Company Profile |
SEC
News |
Chart |
Request a new note
C
A
S
I |
ULTA
-
NASDAQ
Ulta Beauty Inc
SPECIALTY RETAIL - Specialty Retail, Other
|
$282.03
|
-3.20
-1.12% |
$285.98
|
644,253
95.59% of 50 DAV
50 DAV is 674,000
|
$289.27
-2.50%
|
3/6/2017
|
$274.96
|
PP = $278.73
|
|
MB = $292.67
|
Most Recent Note - 3/28/2017 5:18:20 PM
Y - Consolidating with lighter volume totals. Prior highs in the $278 area define support along with its 50 DMA line ($275). Subsequent losses leading to violations would raise concerns and trigger technical sell signals.
>>> FEATURED STOCK ARTICLE : Earnings News Due as Good Looking Candidate Hovers Near Highs - 3/6/2017 |
View all notes |
Set NEW NOTE alert |
Company Profile |
SEC
News |
Chart |
Request a new note
C
A
S
I |
ESNT
-
NYSE
Essent Group Ltd
Finance-MrtgandRel Svc
|
$36.03
|
-0.14
-0.39% |
$36.70
|
518,260
74.36% of 50 DAV
50 DAV is 697,000
|
$38.10
-5.43%
|
1/25/2017
|
$34.09
|
PP = $34.04
|
|
MB = $35.74
|
Most Recent Note - 3/28/2017 5:13:32 PM
Y - Finished at the session high and near its "max buy" level with higher (near average) volume behind today's gain. Its 50 DMA line ($35.05) defines important near-term support above prior highs in the $33-34 area. Subsequent losses leading to violations may trigger technical sell signals.
>>> FEATURED STOCK ARTICLE : Consolidating Above Support Following Breakout - 3/10/2017 |
View all notes |
Set NEW NOTE alert |
Company Profile |
SEC
News |
Chart |
Request a new note
C
A
S
I |
Symbol/Exchange
Company Name
Industry Group |
PRICE |
CHANGE
(%Change) |
Day High |
Volume
(% DAV)
(% 50 day avg vol) |
52 Wk Hi
% From Hi |
Featured
Date |
Price
Featured |
Pivot Featured |
|
Max Buy |
VEEV
-
NYSE
Veeva Systems Inc Cl A
Computer Sftwr-Medical
|
$51.33
|
+0.05
0.10% |
$51.90
|
1,269,450
109.53% of 50 DAV
50 DAV is 1,159,000
|
$51.67
-0.66%
|
3/16/2017
|
$49.00
|
PP = $48.05
|
|
MB = $50.45
|
Most Recent Note - 3/27/2017 1:00:12 PM
Y - After a noted spurt of volume-driven gains it is still stubbornly holding its ground perched near its "max buy" level and near all-time highs. Prior highs in the $47-48 area define initial support to watch on pullbacks.
>>> FEATURED STOCK ARTICLE : Breakout Gain for New Highs Backed by Three Times Average Volume - 3/16/2017 |
View all notes |
Set NEW NOTE alert |
Company Profile |
SEC
News |
Chart |
Request a new note
C
A
S
I |
ANET
-
NYSE
Arista Networks Inc
TELECOMMUNICATIONS - Communication Equipment
|
$131.70
|
-0.57
-0.43% |
$132.46
|
1,039,228
126.89% of 50 DAV
50 DAV is 819,000
|
$134.65
-2.19%
|
3/6/2017
|
$119.43
|
PP = $123.22
|
|
MB = $129.38
|
Most Recent Note - 3/28/2017 5:20:33 PM
G - Hit another new high with below average volume behind today's 3rd consecutive gain, getting more extended from any sound base. Disciplined investors avoid chasing extended stocks.
>>> FEATURED STOCK ARTICLE : Stubbornly Holding Ground After Breakaway Gap - 3/1/2017 |
View all notes |
Set NEW NOTE alert |
Company Profile |
SEC
News |
Chart |
Request a new note
C
A
S
I |
VBTX
-
NASDAQ
Veritex Holdings Inc
BANKING - Regional - Southwest Banks
|
$27.62
|
-0.50
-1.78% |
$28.13
|
160,103
179.89% of 50 DAV
50 DAV is 89,000
|
$29.43
-6.15%
|
1/23/2017
|
$27.30
|
PP = $27.87
|
|
MB = $29.26
|
Most Recent Note - 4/3/2017 12:07:52 PM
G - Sputtering below its 50 DMA line ($28.10) with higher volume behind today's loss. Subsequent losses below the prior low ($26.82 on 3/10/17) would raise more serious concerns and trigger a worrisome technical sell signal.
>>> FEATURED STOCK ARTICLE : Hovering Near Highs But Latest Earnings Were Below Guidelines - 3/8/2017 |
View all notes |
Set NEW NOTE alert |
Company Profile |
SEC
News |
Chart |
Request a new note
C
A
S
I |
IBP
-
NYSE
Installed Building Prod
DIVERSIFIED SERVICES - Business/Management Services
|
$51.90
|
-0.85
-1.61% |
$52.90
|
146,659
91.09% of 50 DAV
50 DAV is 161,000
|
$53.00
-2.08%
|
2/27/2017
|
$44.83
|
PP = $44.40
|
|
MB = $46.62
|
Most Recent Note - 3/28/2017 5:15:16 PM
G - Hovering near its all-time high, very extended from its prior base following an impressive streak of volume-driven gains. Its 50 DMA line and prior highs in the $44 area define support to watch.
>>> FEATURED STOCK ARTICLE : Big Breakout Followed Solid Earnings News - 2/28/2017 |
View all notes |
Set NEW NOTE alert |
Company Profile |
SEC
News |
Chart |
Request a new note
C
A
S
I |
INGN
-
NASDAQ
Inogen Inc
HEALTH SERVICES - Medical Instruments and Supplies
|
$78.32
|
+0.76
0.98% |
$78.67
|
189,156
115.34% of 50 DAV
50 DAV is 164,000
|
$79.94
-2.03%
|
2/27/2017
|
$68.69
|
PP = $69.94
|
|
MB = $73.44
|
Most Recent Note - 3/31/2017 5:01:58 PM
G - Traded average volume while inching to a best-ever close, extended from its prior base. Its 50 DMA line ($70.27) and prior highs in the $69 area define important near-term support to watch. See the latest FSU analysis for more details and a new annotated graph.
>>> FEATURED STOCK ARTICLE : Best Ever Close For High-Ranked Medical Product Maker - 3/31/2017 |
View all notes |
Set NEW NOTE alert |
Company Profile |
SEC
News |
Chart |
Request a new note
C
A
S
I |
Symbol/Exchange
Company Name
Industry Group |
PRICE |
CHANGE
(%Change) |
Day High |
Volume
(% DAV)
(% 50 day avg vol) |
52 Wk Hi
% From Hi |
Featured
Date |
Price
Featured |
Pivot Featured |
|
Max Buy |
PLAY
-
NASDAQ
Dave & Buster's Ent Inc
Retail-Restaurants
|
$60.63
|
-0.46
-0.75% |
$61.20
|
701,184
87.43% of 50 DAV
50 DAV is 802,000
|
$63.12
-3.94%
|
2/23/2017
|
$55.41
|
PP = $58.35
|
|
MB = $61.27
|
Most Recent Note - 3/31/2017 12:58:41 PM
G - Color code was changed to green after rallying above its "max buy" level with volume-driven gains for new all-time highs. Reported earnings +19% on +15% sales revenues for the Jan '17 quarter, below the +25% minimum guideline (C criteria). Its 50 DMA line ($57.32) defines near-term support to watch. See the latest FSU analysis for more details and an annotated graph.
>>> FEATURED STOCK ARTICLE : Retreated From All-Time High Following Earnings Report - 3/29/2017 |
View all notes |
Set NEW NOTE alert |
Company Profile |
SEC
News |
Chart |
Request a new note
C
A
S
I |
OLLI
-
NASDAQ
Ollie's Bargain Outlet
Retail-DiscountandVariety
|
$33.35
|
-0.15
-0.45% |
$33.67
|
620,714
111.44% of 50 DAV
50 DAV is 557,000
|
$35.80
-6.84%
|
3/27/2017
|
$32.80
|
PP = $33.55
|
|
MB = $35.23
|
Most Recent Note - 3/30/2017 1:05:35 PM
Y - Perched at its all-time high today while on track for a 4th consecutive volume-driven gain. Reported earnings +22% on +16% sales revenues for the Jan '17 quarter, below the +25% minimum earnings guideline (C criteria). OLLI was highlighted in yellow with new pivot point cited based on its 2/21/17 high plus 10 cents in the 3/27/17 mid-day report (read here) and it was recently noted - "A volume-driven gain for new highs may trigger a technical buy signal. Due to report Jan '17 quarterly results on Tuesday, March 28, 2017 after the market closes. Volume and volatility often increase near earnings news. Found support near its 50 DMA line ($31.68) during its orderly consolidation. Fundamentals remain strong and its Relative Strength rating has improved to 86. See the latest FSU analysis for more details and an annotated graph."
>>> FEATURED STOCK ARTICLE : No Resistance Remains and Earnings News is Due - 3/27/2017 |
View all notes |
Set NEW NOTE alert |
Company Profile |
SEC
News |
Chart |
Request a new note
C
A
S
I |
LITE
-
NASDAQ
Lumentum Holdings Inc
TELECOMMUNICATIONS - Cables / Satalite Equipment
|
$51.50
|
-1.85
-3.47% |
$53.70
|
1,613,249
89.18% of 50 DAV
50 DAV is 1,809,000
|
$55.92
-7.91%
|
2/8/2017
|
$44.60
|
PP = $44.80
|
|
MB = $47.04
|
Most Recent Note - 4/3/2017 5:51:17 PM
G - Pulling back from its all-time high following a streak of gains. Its 50 DMA line ($46.32) defines near-term support to watch.
>>> FEATURED STOCK ARTICLE : Support Elusive Following Prior Demand - 3/14/2017 |
View all notes |
Set NEW NOTE alert |
Company Profile |
SEC
News |
Chart |
Request a new note
C
A
S
I |
MOMO
-
NASDAQ
Momo Inc Ads Cl A
INTERNET - Content
|
$34.84
|
+0.77
2.26% |
$35.02
|
3,996,930
95.10% of 50 DAV
50 DAV is 4,203,000
|
$36.18
-3.70%
|
3/7/2017
|
$29.71
|
PP = $27.83
|
|
MB = $29.22
|
Most Recent Note - 3/31/2017 12:57:15 PM
G - Retreating from a new all-time high hit on the prior session with a loss today on higher volume. It is extended from the previously noted base. Prior highs in the $27-28 area and its 50 DMA line coincide defining important support to watch on pullbacks.
>>> FEATURED STOCK ARTICLE : Breakaway Gap Followed Very Strong Earnings Report - 3/7/2017 |
View all notes |
Set NEW NOTE alert |
Company Profile |
SEC
News |
Chart |
Request a new note
C
A
S
I |
|
|
|
THESE ARE NOT BUY RECOMMENDATIONS!
Comments contained in the body of this report are technical
opinions only. The material herein has been obtained
from sources believed to be reliable and accurate, however,
its accuracy and completeness cannot be guaranteed.
This site is not an investment advisor, hence it does
not endorse or recommend any securities or other investments.
Any recommendation contained in this report may not
be suitable for all investors and it is not to be deemed
an offer or solicitation on our part with respect to
the purchase or sale of any securities. All trademarks,
service marks and trade names appearing in this report
are the property of their respective owners, and are
likewise used for identification purposes only.
This report is a service available
only to active Paid Premium Members.
You may opt-out of receiving report notifications
at any time. Questions or comments may be submitted
by writing to Premium Membership Services 665 S.E. 10 Street, Suite 201 Deerfield Beach, FL 33441-5634 or by calling 1-800-965-8307
or 954-785-1121.
|
|
|