***Last / Change / Volume data in this table is the closing quote data***
Symbol/Exchange
Company Name
Industry Group |
PRICE |
CHANGE
(%Change) |
Day High |
Volume
(% DAV)
(% 50 day avg vol) |
52 Wk Hi
% From Hi |
Featured
Date |
Price
Featured |
Pivot Featured |
|
Max Buy |
SBCF
-
NASDAQ
Seacoast Banking Corp Fl
BANKING - Regional - Mid-Atlantic Banks
|
$22.67
|
+0.37
1.66% |
$22.98
|
309,547
73.01% of 50 DAV
50 DAV is 424,000
|
$25.13
-9.79%
|
2/13/2017
|
$24.84
|
PP = $23.10
|
|
MB = $24.26
|
Most Recent Note - 3/21/2017 4:07:49 PM
G - Violated prior highs and its 50 DMA line with today's loss triggering technical sell signals and raising concerns. Its color code is changed to green. Only a prompt rebound above the 50 DMA line would help its outlook improve.
>>> FEATURED STOCK ARTICLE : Gap Up Gain and Strong Finish Triggered Technical Buy Signal - 2/13/2017 |
View all notes |
Set NEW NOTE alert |
Company Profile |
SEC
News |
Chart |
Request a new note
C
A
S
I |
CSFL
-
NASDAQ
Centerstate Banks Inc
Banks-Southeast
|
$24.97
|
+0.39
1.59% |
$25.36
|
356,877
107.49% of 50 DAV
50 DAV is 332,000
|
$26.94
-7.30%
|
3/13/2017
|
$25.54
|
PP = $26.40
|
|
MB = $27.72
|
Most Recent Note - 3/22/2017 12:21:57 PM
G - Slumped into the prior base and violated its 50 DMA line raising concerns and triggering technical sell signals on the prior session. Color code is changed to green. Only a prompt rebound above the 50 DMA line ($25.08) would help its outlook improve.
>>> FEATURED STOCK ARTICLE : Gain Backed By Volume For Best Ever Close - 3/15/2017 |
View all notes |
Set NEW NOTE alert |
Company Profile |
SEC
News |
Chart |
Request a new note
C
A
S
I |
IESC
-
NASDAQ
Integrated Electric Svcs
Bldg-Maintenance and Svc
|
$18.20
|
-0.20
-1.09% |
$18.65
|
68,468
129.67% of 50 DAV
50 DAV is 52,800
|
$23.00
-20.87%
|
11/23/2016
|
$19.35
|
PP = $18.26
|
|
MB = $19.17
|
Most Recent Note - 3/21/2017 1:09:15 PM
G - Slumping below its 50 DMA line ($19.43) but it remains above the prior low ($18.05 on 1/18/17) defining important support above its 200 DMA line ($17.04). Recently reported Dec '16 quarterly earnings -33% on +27% sales revenues, below the +25% minimum earnings guideline (C criteria), raising fundamental concerns.
>>> FEATURED STOCK ARTICLE : Recent Low Defines Support Near Prior Highs - 3/3/2017 |
View all notes |
Set NEW NOTE alert |
Company Profile |
SEC
News |
Chart |
Request a new note
C
A
S
I |
NSP
-
NYSE
Insperity Inc
Comml Svcs-Outsourcing
|
$86.75
|
+0.50
0.58% |
$87.50
|
69,336
43.61% of 50 DAV
50 DAV is 159,000
|
$90.55
-4.20%
|
2/14/2017
|
$84.30
|
PP = $82.28
|
|
MB = $86.39
|
Most Recent Note - 3/22/2017 6:00:23 PM
Y - Color code is changed to yellow after pulling back just below its "max buy" level with lighter than average volume behind today's 5th consecutive loss. Prior highs in the $86 area and old highs the $82 area define initial support levels to watch above its 50 DMA line ($79.28). See the latest FSU analysis for more details and a new annotated graph.
>>> FEATURED STOCK ARTICLE : Ordinary Pullback From Highs With Lighter Volume - 3/22/2017 |
View all notes |
Set NEW NOTE alert |
Company Profile |
SEC
News |
Chart |
Request a new note
C
A
S
I |
BERY
-
NYSE
Berry Plastics Group Inc
CONSUMER NON-DURABLES - Packaging and Containers
|
$48.36
|
+0.19
0.39% |
$48.54
|
597,169
49.85% of 50 DAV
50 DAV is 1,197,900
|
$52.97
-8.70%
|
11/30/2016
|
$50.26
|
PP = $46.47
|
|
MB = $48.79
|
Most Recent Note - 3/20/2017 5:44:31 PM
G - Relative Strength Rating is 74, below the 80+ minimum for buy candidates under the fact-based investment system. Recently consolidating near its 50 DMA line ($50.46) while prior lows in the $48.50 area define important near-term support. Damaging losses and violations would trigger a more worrisome technical sell signal. Reported earnings +43% on -7% sales revenues for the Dec '16 quarter. See the latest FSU analysis for more details and a new annotated graph.
>>> FEATURED STOCK ARTICLE : Sputtering Below its 50-Day Moving Average - 3/20/2017 |
View all notes |
Set NEW NOTE alert |
Company Profile |
SEC
News |
Chart |
Request a new note
C
A
S
I |
Symbol/Exchange
Company Name
Industry Group |
PRICE |
CHANGE
(%Change) |
Day High |
Volume
(% DAV)
(% 50 day avg vol) |
52 Wk Hi
% From Hi |
Featured
Date |
Price
Featured |
Pivot Featured |
|
Max Buy |
EVR
-
NYSE
Evercore Partners Inc
FINANCIAL SERVICES - Investment Banking
|
$77.55
|
+0.15
0.19% |
$78.40
|
224,864
50.31% of 50 DAV
50 DAV is 447,000
|
$83.30
-6.90%
|
1/5/2017
|
$71.40
|
PP = $72.07
|
|
MB = $75.67
|
Most Recent Note - 3/21/2017 1:05:46 PM
G - Retreating near its 50 DMA line ($78.27) with today's 3rd consecutive loss. Further deterioration or a violation of the prior low ($74.75 on 2/08/17) would raise more serious concerns and trigger technical sell signals. Recently reported Dec '16 quarterly earnings +17% on +9% sales revenues, below the +25% minimum earnings guideline (C criteria), raising fundamental concerns.
>>> FEATURED STOCK ARTICLE : Holding Ground After Latest Earnings Were Below +25% Guideline - 2/17/2017 |
View all notes |
Set NEW NOTE alert |
Company Profile |
SEC
News |
Chart |
Request a new note
C
A
S
I |
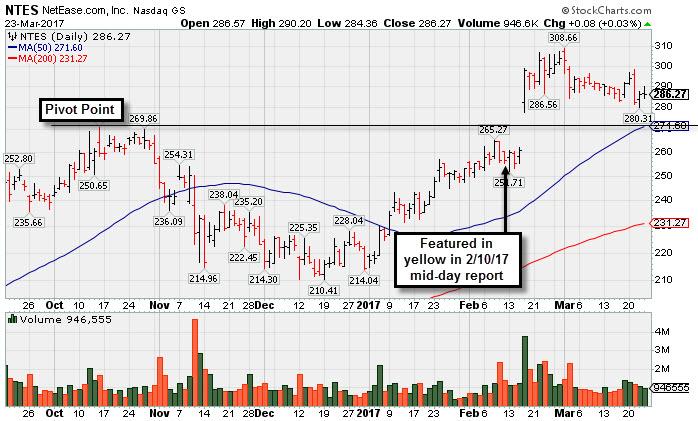
NTES
-
NASDAQ
Netease Inc Adr
INTERNET - Internet Information Providers
|
$286.27
|
+0.08
0.03% |
$290.20
|
946,475
82.30% of 50 DAV
50 DAV is 1,150,000
|
$308.66
-7.25%
|
2/10/2017
|
$259.30
|
PP = $272.68
|
|
MB = $286.31
|
 Most Recent Note - 3/23/2017 5:32:46 PM
G - Still consolidating in a tight trading range following a big "breakaway gap" on 2/16/17. Prior highs in the $272 area define initial support to watch along with its 50 DMA line. See the latest FSU analysis for more details and a new annotated graph.
>>> FEATURED STOCK ARTICLE : Consolidating in Tight Range Following Breakaway Gap - 3/23/2017 |
View all notes |
Set NEW NOTE alert |
Company Profile |
SEC
News |
Chart |
Request a new note
C
A
S
I |
STMP
-
NASDAQ
Stamps.com Inc
INTERNET - Internet Software and Services
|
$117.70
|
-4.05
-3.33% |
$121.25
|
632,083
238.07% of 50 DAV
50 DAV is 265,500
|
$136.00
-13.46%
|
2/16/2017
|
$129.45
|
PP = $123.85
|
|
MB = $130.04
|
Most Recent Note - 3/23/2017 12:47:45 PM
G - Sinking further below the 50 DMA line today and raising concerns as it undercut the recent low ($120.11 on 3/02/17) triggering a more worrisome technical sell signal. Only a prompt rebound above the 50 DMA line ($125.46) would help its outlook improve.
>>> FEATURED STOCK ARTICLE : Recent Gains Have Lacked Heavy Volume Indicative of Accumulation - 2/16/2017 |
View all notes |
Set NEW NOTE alert |
Company Profile |
SEC
News |
Chart |
Request a new note
C
A
S
I |
HTHT
-
NASDAQ
China Lodging Group Ads
LEISURE - Lodging
|
$62.79
|
+1.66
2.72% |
$63.09
|
101,993
71.83% of 50 DAV
50 DAV is 142,000
|
$63.87
-1.69%
|
9/29/2016
|
$46.12
|
PP = $47.82
|
|
MB = $50.21
|
Most Recent Note - 3/21/2017 12:33:28 PM
G - Perched near all-time highs, holding its ground following volume-driven gains last week, Previously noted with caution - "Reported earnings +0% on +4% sales revenues for the Dec '16 quarter versus the year ago period, marking a 2nd comparison below the +25% minimum earnings guideline (C criteria), and its waning sales revenues growth rate is also a concern." See the latest FSU analysis for more details and an annotated graph.
>>> FEATURED STOCK ARTICLE : Bullish Action Led to +54% Rally Since First Featured - 3/17/2017 |
View all notes |
Set NEW NOTE alert |
Company Profile |
SEC
News |
Chart |
Request a new note
C
A
S
I |
SIRI
-
NASDAQ
Sirius X M Holdings Inc
MEDIA - Broadcasting - Radio
|
$5.13
|
+0.03
0.59% |
$5.16
|
26,396,966
112.31% of 50 DAV
50 DAV is 23,504,000
|
$5.53
-7.23%
|
3/13/2017
|
$5.48
|
PP = $5.32
|
|
MB = $5.59
|
Most Recent Note - 3/20/2017 4:58:05 PM
Y - Pulled back today with very light volume. Volume totals have been cooling since its powerful breakout. First highlighted in the 3/13/17 mid-day report (read here) in yellow with pivot point cited based on its 2/22/17 high plus 10 cents. Its prior high ($5.22 on 2/22/17) defines initial support to watch. Disciplined investors always limit losses by selling any stock that falls more than -7% from their purchase price.
>>> FEATURED STOCK ARTICLE : Breakout From Advanced Base Pattern Backed By Very Heavy Volume - 3/13/2017 |
View all notes |
Set NEW NOTE alert |
Company Profile |
SEC
News |
Chart |
Request a new note
C
A
S
I |
Symbol/Exchange
Company Name
Industry Group |
PRICE |
CHANGE
(%Change) |
Day High |
Volume
(% DAV)
(% 50 day avg vol) |
52 Wk Hi
% From Hi |
Featured
Date |
Price
Featured |
Pivot Featured |
|
Max Buy |
BEAT
-
NASDAQ
BioTelemetry Inc
Medical-Services
|
$26.05
|
+0.05
0.19% |
$26.45
|
253,333
77.00% of 50 DAV
50 DAV is 329,000
|
$27.90
-6.63%
|
2/14/2017
|
$25.10
|
PP = $24.55
|
|
MB = $25.78
|
Most Recent Note - 3/21/2017 12:06:38 PM
G - Pulling back from all-time highs with today's 3rd consecutive loss. Prior highs in the $24 area and its 50 DMA line ($24.45) define important near-term support.
>>> FEATURED STOCK ARTICLE : Perched Near All-Time High With Earnings Report Due - 2/21/2017 |
View all notes |
Set NEW NOTE alert |
Company Profile |
SEC
News |
Chart |
Request a new note
C
A
S
I |
ULTA
-
NASDAQ
Ulta Beauty Inc
SPECIALTY RETAIL - Specialty Retail, Other
|
$281.22
|
-2.04
-0.72% |
$284.78
|
476,468
69.76% of 50 DAV
50 DAV is 683,000
|
$289.27
-2.78%
|
3/6/2017
|
$274.96
|
PP = $278.73
|
|
MB = $292.67
|
Most Recent Note - 3/21/2017 4:00:38 PM
Y - Pulling back on light volume toward prior highs in the $278 area defining initial support. Its 50 DMA line ($273) defines the next important support to watch on pullbacks. After highlighted in yellow in the 3/06/17 mid-day report a volume-driven gain for new highs on 3/10/17 triggered a new technical buy signal.
>>> FEATURED STOCK ARTICLE : Earnings News Due as Good Looking Candidate Hovers Near Highs - 3/6/2017 |
View all notes |
Set NEW NOTE alert |
Company Profile |
SEC
News |
Chart |
Request a new note
C
A
S
I |
ESNT
-
NYSE
Essent Group Ltd
Finance-MrtgandRel Svc
|
$35.14
|
+0.51
1.47% |
$35.66
|
442,885
65.81% of 50 DAV
50 DAV is 673,000
|
$38.10
-7.77%
|
1/25/2017
|
$34.09
|
PP = $34.04
|
|
MB = $35.74
|
Most Recent Note - 3/20/2017 4:43:50 PM
Y - Color code is changed to yellow after a loss today on light volume closing below its "max buy" level. Its 50 DMA line ($34.72) and prior highs define important near-term support in the $33-34 area. Subsequent losses leading to violations may trigger technical sell signals.
>>> FEATURED STOCK ARTICLE : Consolidating Above Support Following Breakout - 3/10/2017 |
View all notes |
Set NEW NOTE alert |
Company Profile |
SEC
News |
Chart |
Request a new note
C
A
S
I |
VEEV
-
NYSE
Veeva Systems Inc Cl A
Computer Sftwr-Medical
|
$49.80
|
+0.81
1.65% |
$50.25
|
2,009,318
193.76% of 50 DAV
50 DAV is 1,037,000
|
$50.75
-1.87%
|
3/16/2017
|
$49.00
|
PP = $48.05
|
|
MB = $50.45
|
Most Recent Note - 3/23/2017 5:35:15 PM
Y - Added to a spurt of volume-driven gains today and it is perched near all-time highs. Prior highs in the $47-48 area define initial support to watch on pullbacks.
>>> FEATURED STOCK ARTICLE : Breakout Gain for New Highs Backed by Three Times Average Volume - 3/16/2017 |
View all notes |
Set NEW NOTE alert |
Company Profile |
SEC
News |
Chart |
Request a new note
C
A
S
I |
ANET
-
NYSE
Arista Networks Inc
TELECOMMUNICATIONS - Communication Equipment
|
$130.08
|
-0.46
-0.35% |
$131.12
|
560,891
62.18% of 50 DAV
50 DAV is 902,000
|
$131.43
-1.03%
|
3/6/2017
|
$119.43
|
PP = $123.22
|
|
MB = $129.38
|
Most Recent Note - 3/22/2017 3:51:11 PM
G - Stubbornly holding its ground after rallying above its "max buy" level. Recent gains were marked unimpressive volume, revealing a lack of institutional buying demand while it wedged up from the previously noted advanced "3-weeks tight" base pattern.
>>> FEATURED STOCK ARTICLE : Stubbornly Holding Ground After Breakaway Gap - 3/1/2017 |
View all notes |
Set NEW NOTE alert |
Company Profile |
SEC
News |
Chart |
Request a new note
C
A
S
I |
Symbol/Exchange
Company Name
Industry Group |
PRICE |
CHANGE
(%Change) |
Day High |
Volume
(% DAV)
(% 50 day avg vol) |
52 Wk Hi
% From Hi |
Featured
Date |
Price
Featured |
Pivot Featured |
|
Max Buy |
VBTX
-
NASDAQ
Veritex Holdings Inc
BANKING - Regional - Southwest Banks
|
$27.59
|
+0.21
0.77% |
$27.86
|
83,448
93.76% of 50 DAV
50 DAV is 89,000
|
$29.43
-6.25%
|
1/23/2017
|
$27.30
|
PP = $27.87
|
|
MB = $29.26
|
Most Recent Note - 3/22/2017 3:58:23 PM
G - Color code is changed to green after slumping below prior highs in the $27 area and also undercutting its 50 DMA line. A prompt rebound above the 50 DMA line ($27.81) is needed for its outlook to improve. Losses below the prior low ($26.82 on 3/10/17) would raise more serious concerns and trigger a worrisome technical sell signal
>>> FEATURED STOCK ARTICLE : Hovering Near Highs But Latest Earnings Were Below Guidelines - 3/8/2017 |
View all notes |
Set NEW NOTE alert |
Company Profile |
SEC
News |
Chart |
Request a new note
C
A
S
I |
IBP
-
NYSE
Installed Building Prod
DIVERSIFIED SERVICES - Business/Management Services
|
$51.75
|
+1.35
2.68% |
$51.91
|
146,297
92.59% of 50 DAV
50 DAV is 158,000
|
$52.70
-1.80%
|
2/27/2017
|
$44.83
|
PP = $44.40
|
|
MB = $46.62
|
Most Recent Note - 3/21/2017 3:58:52 PM
G - Pulling back with light volume after getting very extended from its prior base with an impressive streak of volume-driven gains. Prior highs in the $44 area define initial support to watch.
>>> FEATURED STOCK ARTICLE : Big Breakout Followed Solid Earnings News - 2/28/2017 |
View all notes |
Set NEW NOTE alert |
Company Profile |
SEC
News |
Chart |
Request a new note
C
A
S
I |
INGN
-
NASDAQ
Inogen Inc
HEALTH SERVICES - Medical Instruments and Supplies
|
$75.14
|
+0.51
0.68% |
$75.51
|
75,545
45.51% of 50 DAV
50 DAV is 166,000
|
$79.94
-6.00%
|
2/27/2017
|
$68.69
|
PP = $69.94
|
|
MB = $73.44
|
Most Recent Note - 3/20/2017 4:47:31 PM
G - Posted a small gain today with above average volume for yet another new high close. Its 50 DMA line and prior highs in the $69 area define important near-term support to watch.
>>> FEATURED STOCK ARTICLE : Formed Orderly Base With Earnings News Due After Tuesday's Close - 2/27/2017 |
View all notes |
Set NEW NOTE alert |
Company Profile |
SEC
News |
Chart |
Request a new note
C
A
S
I |
PLAY
-
NASDAQ
Dave & Buster's Ent Inc
Retail-Restaurants
|
$59.99
|
+0.77
1.30% |
$60.19
|
529,966
87.74% of 50 DAV
50 DAV is 604,000
|
$61.20
-1.98%
|
2/23/2017
|
$55.41
|
PP = $58.35
|
|
MB = $61.27
|
Most Recent Note - 3/21/2017 3:57:51 PM
Y - Still perched near all-time highs, consolidating and holding its ground above prior highs in the $58 area. Its 50 DMA line ($56) recently acted as a support level, and a subsequent violation would raise concerns and trigger a technical sell signal.
>>> FEATURED STOCK ARTICLE : Consolidating Near 50 DMA After Recent Gains Lacked Volume - 2/23/2017 |
View all notes |
Set NEW NOTE alert |
Company Profile |
SEC
News |
Chart |
Request a new note
C
A
S
I |
LITE
-
NASDAQ
Lumentum Holdings Inc
TELECOMMUNICATIONS - Cables / Satalite Equipment
|
$51.50
|
+0.05
0.10% |
$52.50
|
1,840,655
108.27% of 50 DAV
50 DAV is 1,700,000
|
$53.70
-4.09%
|
2/8/2017
|
$44.60
|
PP = $44.80
|
|
MB = $47.04
|
Most Recent Note - 3/22/2017 3:48:18 PM
Y - Color code remains yellow while noting that a valid "secondary buy point" exists up to +5% above the prior high ($53.70 X 1.05 = $56.38) after finding support at the 10 WMA line following a recent breakout. Found prompt support near prior highs in the $44-45 area and stayed well above its 50 DMA line ($43).
>>> FEATURED STOCK ARTICLE : Support Elusive Following Prior Demand - 3/14/2017 |
View all notes |
Set NEW NOTE alert |
Company Profile |
SEC
News |
Chart |
Request a new note
C
A
S
I |
Symbol/Exchange
Company Name
Industry Group |
PRICE |
CHANGE
(%Change) |
Day High |
Volume
(% DAV)
(% 50 day avg vol) |
52 Wk Hi
% From Hi |
Featured
Date |
Price
Featured |
Pivot Featured |
|
Max Buy |
MOMO
-
NASDAQ
Momo Inc Ads Cl A
INTERNET - Content
|
$33.29
|
+0.48
1.46% |
$34.49
|
9,266,888
259.00% of 50 DAV
50 DAV is 3,578,000
|
$35.76
-6.91%
|
3/7/2017
|
$29.71
|
PP = $27.83
|
|
MB = $29.22
|
Most Recent Note - 3/23/2017 12:37:14 PM
G - Hovering near its all-time high, extended from its previously noted base. Prior highs in the $27-28 area define initial support to watch on pullbacks.
>>> FEATURED STOCK ARTICLE : Breakaway Gap Followed Very Strong Earnings Report - 3/7/2017 |
View all notes |
Set NEW NOTE alert |
Company Profile |
SEC
News |
Chart |
Request a new note
C
A
S
I |