***Last / Change / Volume data in this table is the closing quote data***
Symbol/Exchange
Company Name
Industry Group |
PRICE |
CHANGE
(%Change) |
Day High |
Volume
(% DAV)
(% 50 day avg vol) |
52 Wk Hi
% From Hi |
Featured
Date |
Price
Featured |
Pivot Featured |
|
Max Buy |
SBCF
-
NASDAQ
Seacoast Banking Corp Fl
BANKING - Regional - Mid-Atlantic Banks
|
$23.52
|
-0.17
-0.72% |
$23.85
|
264,463
61.94% of 50 DAV
50 DAV is 427,000
|
$25.13
-6.41%
|
2/13/2017
|
$24.84
|
PP = $23.10
|
|
MB = $24.26
|
Most Recent Note - 3/28/2017 5:09:41 PM
Y - Finished near the session high with below average volume behind today's 4th consecutive gain. Subsequent deterioration below the 50 DMA line and recent low ($21.89 on 3/22/17) would raise more serious concerns and trigger worrisome technical sell signals. See the latest FSU analysis for more details and a new annotated graph.
>>> FEATURED STOCK ARTICLE : Rebound After Slump Below 50-Day Average Into Prior Base - 3/28/2017 |
View all notes |
Set NEW NOTE alert |
Company Profile |
SEC
News |
Chart |
Request a new note
C
A
S
I |
CSFL
-
NASDAQ
Centerstate Banks Inc
Banks-Southeast
|
$25.06
|
+0.09
0.36% |
$25.14
|
182,229
59.94% of 50 DAV
50 DAV is 304,000
|
$26.94
-6.97%
|
3/13/2017
|
$25.54
|
PP = $26.40
|
|
MB = $27.72
|
 Most Recent Note - 3/29/2017 5:14:01 PM
G - Still lingering near its 50 DMA line with volume totals cooling. Subsequent losses below its recent low ($23.70 on 3/27/17) would raise greater concerns.
>>> FEATURED STOCK ARTICLE : Gain Backed By Volume For Best Ever Close - 3/15/2017 |
View all notes |
Set NEW NOTE alert |
Company Profile |
SEC
News |
Chart |
Request a new note
C
A
S
I |
NSP
-
NYSE
Insperity Inc
Comml Svcs-Outsourcing
|
$86.80
|
-0.45
-0.52% |
$87.45
|
80,300
51.47% of 50 DAV
50 DAV is 156,000
|
$90.55
-4.14%
|
2/14/2017
|
$84.30
|
PP = $82.28
|
|
MB = $86.39
|
Most Recent Note - 3/28/2017 5:23:24 PM
G - Color code is changed to green after light volume gains above its "max buy" level. Prior highs in the $86 area and old highs the $82 area define initial support levels to watch above its 50 DMA line ($80.48).
>>> FEATURED STOCK ARTICLE : Ordinary Pullback From Highs With Lighter Volume - 3/22/2017 |
View all notes |
Set NEW NOTE alert |
Company Profile |
SEC
News |
Chart |
Request a new note
C
A
S
I |
EVR
-
NYSE
Evercore Partners Inc
FINANCIAL SERVICES - Investment Banking
|
$76.70
|
-0.45
-0.58% |
$77.05
|
219,310
49.84% of 50 DAV
50 DAV is 440,000
|
$83.30
-7.92%
|
1/5/2017
|
$71.40
|
PP = $72.07
|
|
MB = $75.67
|
Most Recent Note - 3/27/2017 6:40:08 PM
G - Finished near the session high, but it undercut the prior low ($74.75 on 2/08/17) raising more serious concerns today as it gapped down for a loss after failing to rebound above its 50 DMA line. Recently reported Dec '16 quarterly earnings +17% on +9% sales revenues, below the +25% minimum earnings guideline (C criteria), raising fundamental concerns.
>>> FEATURED STOCK ARTICLE : Holding Ground After Latest Earnings Were Below +25% Guideline - 2/17/2017 |
View all notes |
Set NEW NOTE alert |
Company Profile |
SEC
News |
Chart |
Request a new note
C
A
S
I |
NTES
-
NASDAQ
Netease Inc Adr
INTERNET - Internet Information Providers
|
$283.32
|
-6.03
-2.08% |
$290.17
|
972,100
84.75% of 50 DAV
50 DAV is 1,147,000
|
$308.66
-8.21%
|
2/10/2017
|
$259.30
|
PP = $272.68
|
|
MB = $286.31
|
Most Recent Note - 3/29/2017 5:10:54 PM
Y - Color code is changed to yellow after a loss with below average volume led to a pullback below its "max buy" level. Volume totals have been cooling while consolidating in a tight trading range following a big "breakaway gap" on 2/16/17. Prior highs in the $272 area define initial support to watch along with its 50 DMA line ($276).
>>> FEATURED STOCK ARTICLE : Consolidating in Tight Range Following Breakaway Gap - 3/23/2017 |
View all notes |
Set NEW NOTE alert |
Company Profile |
SEC
News |
Chart |
Request a new note
C
A
S
I |
Symbol/Exchange
Company Name
Industry Group |
PRICE |
CHANGE
(%Change) |
Day High |
Volume
(% DAV)
(% 50 day avg vol) |
52 Wk Hi
% From Hi |
Featured
Date |
Price
Featured |
Pivot Featured |
|
Max Buy |
STMP
-
NASDAQ
Stamps.com Inc
INTERNET - Internet Software and Services
|
$115.00
|
-0.60
-0.52% |
$116.60
|
547,694
191.77% of 50 DAV
50 DAV is 285,600
|
$136.00
-15.44%
|
2/16/2017
|
$129.45
|
PP = $123.85
|
|
MB = $130.04
|
Most Recent Note - 3/29/2017 3:32:21 PM
It will be dropped from the Featured Stocks list tonight. Still slumping after triggering worrisome technical sell signals with damaging volume-driven losses noted last week. A rebound above the 50 DMA line ($125) is needed for its outlook improve.
>>> FEATURED STOCK ARTICLE : Technical Deterioration Noted After 50-Day Moving Average Violation - 3/24/2017 |
View all notes |
Set NEW NOTE alert |
Company Profile |
SEC
News |
Chart |
Request a new note
C
A
S
I |
HTHT
-
NASDAQ
China Lodging Group Ads
LEISURE - Lodging
|
$62.58
|
-0.13
-0.21% |
$62.85
|
130,772
90.81% of 50 DAV
50 DAV is 144,000
|
$64.32
-2.71%
|
9/29/2016
|
$46.12
|
PP = $47.82
|
|
MB = $50.21
|
Most Recent Note - 3/27/2017 6:41:31 PM
G - Hovering near all-time highs with volume totals cooling, holding its ground following volume-driven gains, Previously noted with caution - "Reported earnings +0% on +4% sales revenues for the Dec '16 quarter versus the year ago period, marking a 2nd comparison below the +25% minimum earnings guideline (C criteria), and its waning sales revenues growth rate is also a concern." See the latest FSU analysis for more details and an annotated graph.
>>> FEATURED STOCK ARTICLE : Bullish Action Led to +54% Rally Since First Featured - 3/17/2017 |
View all notes |
Set NEW NOTE alert |
Company Profile |
SEC
News |
Chart |
Request a new note
C
A
S
I |
SIRI
-
NASDAQ
Sirius X M Holdings Inc
MEDIA - Broadcasting - Radio
|
$5.14
|
+0.03
0.59% |
$5.14
|
17,349,950
73.91% of 50 DAV
50 DAV is 23,474,000
|
$5.53
-7.05%
|
3/13/2017
|
$5.48
|
PP = $5.32
|
|
MB = $5.59
|
Most Recent Note - 3/27/2017 6:35:59 PM
Y - Volume totals have been cooling since its powerful breakout, but it slumped back into the previous short base raising some concerns. Disciplined investors always limit losses by selling any stock that falls more than -7% from their purchase price. First highlighted in the 3/13/17 mid-day report (read here) in yellow with pivot point cited based on its 2/22/17 high plus 10 cents.
>>> FEATURED STOCK ARTICLE : Breakout From Advanced Base Pattern Backed By Very Heavy Volume - 3/13/2017 |
View all notes |
Set NEW NOTE alert |
Company Profile |
SEC
News |
Chart |
Request a new note
C
A
S
I |
BEAT
-
NASDAQ
BioTelemetry Inc
Medical-Services
|
$29.10
|
+0.50
1.75% |
$29.50
|
593,913
170.18% of 50 DAV
50 DAV is 349,000
|
$28.95
0.52%
|
2/14/2017
|
$25.10
|
PP = $24.55
|
|
MB = $25.78
|
Most Recent Note - 3/29/2017 12:18:46 PM
G - Powering further into new all-time high territory with a streak of volume-driven gains, getting more extended from its prior base. Disciplined investors avoid chasing extended stocks. Prior highs in the $24 area and its 50 DMA line ($25.09) define important near-term support to watch.
>>> FEATURED STOCK ARTICLE : Perched Near All-Time High With Earnings Report Due - 2/21/2017 |
View all notes |
Set NEW NOTE alert |
Company Profile |
SEC
News |
Chart |
Request a new note
C
A
S
I |
ULTA
-
NASDAQ
Ulta Beauty Inc
SPECIALTY RETAIL - Specialty Retail, Other
|
$283.43
|
+0.57
0.20% |
$283.99
|
409,289
59.75% of 50 DAV
50 DAV is 685,000
|
$289.27
-2.02%
|
3/6/2017
|
$274.96
|
PP = $278.73
|
|
MB = $292.67
|
Most Recent Note - 3/28/2017 5:18:20 PM
Y - Consolidating with lighter volume totals. Prior highs in the $278 area define support along with its 50 DMA line ($275). Subsequent losses leading to violations would raise concerns and trigger technical sell signals.
>>> FEATURED STOCK ARTICLE : Earnings News Due as Good Looking Candidate Hovers Near Highs - 3/6/2017 |
View all notes |
Set NEW NOTE alert |
Company Profile |
SEC
News |
Chart |
Request a new note
C
A
S
I |
Symbol/Exchange
Company Name
Industry Group |
PRICE |
CHANGE
(%Change) |
Day High |
Volume
(% DAV)
(% 50 day avg vol) |
52 Wk Hi
% From Hi |
Featured
Date |
Price
Featured |
Pivot Featured |
|
Max Buy |
ESNT
-
NYSE
Essent Group Ltd
Finance-MrtgandRel Svc
|
$35.51
|
-0.26
-0.73% |
$35.78
|
404,861
59.80% of 50 DAV
50 DAV is 677,000
|
$38.10
-6.80%
|
1/25/2017
|
$34.09
|
PP = $34.04
|
|
MB = $35.74
|
Most Recent Note - 3/28/2017 5:13:32 PM
Y - Finished at the session high and near its "max buy" level with higher (near average) volume behind today's gain. Its 50 DMA line ($35.05) defines important near-term support above prior highs in the $33-34 area. Subsequent losses leading to violations may trigger technical sell signals.
>>> FEATURED STOCK ARTICLE : Consolidating Above Support Following Breakout - 3/10/2017 |
View all notes |
Set NEW NOTE alert |
Company Profile |
SEC
News |
Chart |
Request a new note
C
A
S
I |
VEEV
-
NYSE
Veeva Systems Inc Cl A
Computer Sftwr-Medical
|
$50.96
|
-0.17
-0.33% |
$51.20
|
1,049,149
91.71% of 50 DAV
50 DAV is 1,144,000
|
$51.48
-1.01%
|
3/16/2017
|
$49.00
|
PP = $48.05
|
|
MB = $50.45
|
Most Recent Note - 3/27/2017 1:00:12 PM
Y - After a noted spurt of volume-driven gains it is still stubbornly holding its ground perched near its "max buy" level and near all-time highs. Prior highs in the $47-48 area define initial support to watch on pullbacks.
>>> FEATURED STOCK ARTICLE : Breakout Gain for New Highs Backed by Three Times Average Volume - 3/16/2017 |
View all notes |
Set NEW NOTE alert |
Company Profile |
SEC
News |
Chart |
Request a new note
C
A
S
I |
ANET
-
NYSE
Arista Networks Inc
TELECOMMUNICATIONS - Communication Equipment
|
$133.30
|
-0.67
-0.50% |
$134.65
|
517,385
56.54% of 50 DAV
50 DAV is 915,000
|
$134.18
-0.66%
|
3/6/2017
|
$119.43
|
PP = $123.22
|
|
MB = $129.38
|
Most Recent Note - 3/28/2017 5:20:33 PM
G - Hit another new high with below average volume behind today's 3rd consecutive gain, getting more extended from any sound base. Disciplined investors avoid chasing extended stocks.
>>> FEATURED STOCK ARTICLE : Stubbornly Holding Ground After Breakaway Gap - 3/1/2017 |
View all notes |
Set NEW NOTE alert |
Company Profile |
SEC
News |
Chart |
Request a new note
C
A
S
I |
VBTX
-
NASDAQ
Veritex Holdings Inc
BANKING - Regional - Southwest Banks
|
$27.93
|
-0.62
-2.17% |
$28.64
|
68,979
75.80% of 50 DAV
50 DAV is 91,000
|
$29.43
-5.10%
|
1/23/2017
|
$27.30
|
PP = $27.87
|
|
MB = $29.26
|
Most Recent Note - 3/29/2017 5:08:48 PM
G - Retreated today on lighter volume and closed near its 50 DMA line. Subsequent losses below the prior low ($26.82 on 3/10/17) would raise more serious concerns and trigger a worrisome technical sell signal.
>>> FEATURED STOCK ARTICLE : Hovering Near Highs But Latest Earnings Were Below Guidelines - 3/8/2017 |
View all notes |
Set NEW NOTE alert |
Company Profile |
SEC
News |
Chart |
Request a new note
C
A
S
I |
IBP
-
NYSE
Installed Building Prod
DIVERSIFIED SERVICES - Business/Management Services
|
$52.05
|
+0.20
0.39% |
$52.20
|
64,065
40.04% of 50 DAV
50 DAV is 160,000
|
$52.70
-1.23%
|
2/27/2017
|
$44.83
|
PP = $44.40
|
|
MB = $46.62
|
Most Recent Note - 3/28/2017 5:15:16 PM
G - Hovering near its all-time high, very extended from its prior base following an impressive streak of volume-driven gains. Its 50 DMA line and prior highs in the $44 area define support to watch.
>>> FEATURED STOCK ARTICLE : Big Breakout Followed Solid Earnings News - 2/28/2017 |
View all notes |
Set NEW NOTE alert |
Company Profile |
SEC
News |
Chart |
Request a new note
C
A
S
I |
Symbol/Exchange
Company Name
Industry Group |
PRICE |
CHANGE
(%Change) |
Day High |
Volume
(% DAV)
(% 50 day avg vol) |
52 Wk Hi
% From Hi |
Featured
Date |
Price
Featured |
Pivot Featured |
|
Max Buy |
INGN
-
NASDAQ
Inogen Inc
HEALTH SERVICES - Medical Instruments and Supplies
|
$76.70
|
-0.28
-0.36% |
$77.11
|
94,383
56.52% of 50 DAV
50 DAV is 167,000
|
$79.94
-4.05%
|
2/27/2017
|
$68.69
|
PP = $69.94
|
|
MB = $73.44
|
Most Recent Note - 3/29/2017 5:16:24 PM
G - Traded lighter than average volume while holding its ground near its all-time high. Its 50 DMA line ($69.72) coincides with prior highs in the $69 area defining important near-term support to watch.
>>> FEATURED STOCK ARTICLE : Formed Orderly Base With Earnings News Due After Tuesday's Close - 2/27/2017 |
View all notes |
Set NEW NOTE alert |
Company Profile |
SEC
News |
Chart |
Request a new note
C
A
S
I |
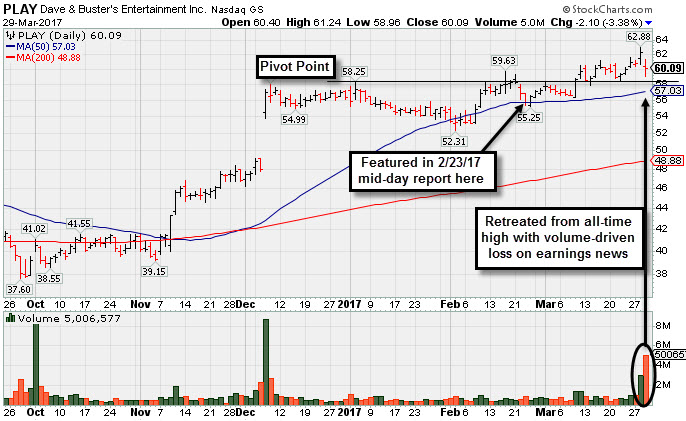
PLAY
-
NASDAQ
Dave & Buster's Ent Inc
Retail-Restaurants
|
$60.09
|
-2.10
-3.38% |
$61.24
|
5,007,977
754.21% of 50 DAV
50 DAV is 664,000
|
$62.88
-4.44%
|
2/23/2017
|
$55.41
|
PP = $58.35
|
|
MB = $61.27
|
Most Recent Note - 3/29/2017 5:07:17 PM
Y - Reported earnings +19% on +15% sales revenues for the Jan '17 quarter, below the +25% minimum guideline (C criteria). Pulled back from its all-time high with a loss on heavy volume. Subsequent losses leading to a violation of the 50 DMA line ($57.03) would raise concerns and trigger a technical sell signal. See the latest FSU analysis for more details and a new annotated graph.
>>> FEATURED STOCK ARTICLE : Retreated From All-Time High Following Earnings Report - 3/29/2017 |
View all notes |
Set NEW NOTE alert |
Company Profile |
SEC
News |
Chart |
Request a new note
C
A
S
I |
OLLI
-
NASDAQ
Ollie's Bargain Outlet
Retail-DiscountandVariety
|
$33.20
|
+0.10
0.30% |
$35.80
|
2,986,591
585.61% of 50 DAV
50 DAV is 510,000
|
$33.50
-0.90%
|
3/27/2017
|
$32.80
|
PP = $33.55
|
|
MB = $35.23
|
Most Recent Note - 3/29/2017 12:59:35 PM
Y - Hitting a new all-time high with today's 3rd consecutive volume-driven gain. Reported earnings +22% on +16% sales revenues for the Jan '17 quarter, below the +25% minimum earnings guideline (C criteria). OLLI was highlighted in yellow with new pivot point cited based on its 2/21/17 high plus 10 cents in the 3/27/17 mid-day report (read here) and it was recently noted - "A volume-driven gain for new highs may trigger a technical buy signal. Due to report Jan '17 quarterly results on Tuesday, March 28, 2017 after the market closes. Volume and volatility often increase near earnings news. Found support near its 50 DMA line ($31.68) during its orderly consolidation. Fundamentals remain strong and its Relative Strength rating has improved to 86. See the latest FSU analysis for more details and an annotated graph."
>>> FEATURED STOCK ARTICLE : No Resistance Remains and Earnings News is Due - 3/27/2017 |
View all notes |
Set NEW NOTE alert |
Company Profile |
SEC
News |
Chart |
Request a new note
C
A
S
I |
LITE
-
NASDAQ
Lumentum Holdings Inc
TELECOMMUNICATIONS - Cables / Satalite Equipment
|
$53.55
|
-1.15
-2.10% |
$55.92
|
3,136,875
178.64% of 50 DAV
50 DAV is 1,756,000
|
$55.20
-2.99%
|
2/8/2017
|
$44.60
|
PP = $44.80
|
|
MB = $47.04
|
Most Recent Note - 3/29/2017 12:49:03 PM
G - Perched at its all-time high following a streak of gains. Recently noted - "A valid 'secondary buy point' exists up to +5% above the prior high ($53.70 X 1.05 = $56.38) after finding support at the 10 WMA line following a recent breakout. Found prompt support near prior highs in the $44-45 area and stayed well above its 50 DMA line ($43)."
>>> FEATURED STOCK ARTICLE : Support Elusive Following Prior Demand - 3/14/2017 |
View all notes |
Set NEW NOTE alert |
Company Profile |
SEC
News |
Chart |
Request a new note
C
A
S
I |
MOMO
-
NASDAQ
Momo Inc Ads Cl A
INTERNET - Content
|
$34.11
|
+0.31
0.92% |
$34.49
|
3,427,539
89.38% of 50 DAV
50 DAV is 3,835,000
|
$35.76
-4.61%
|
3/7/2017
|
$29.71
|
PP = $27.83
|
|
MB = $29.22
|
Most Recent Note - 3/27/2017 6:46:56 PM
G - Posted a 4th consecutive gain today and volume increased while it closed near the session high. It remains extended from its previously noted base, and prior highs in the $27-28 area define initial support to watch on pullbacks.
>>> FEATURED STOCK ARTICLE : Breakaway Gap Followed Very Strong Earnings Report - 3/7/2017 |
View all notes |
Set NEW NOTE alert |
Company Profile |
SEC
News |
Chart |
Request a new note
C
A
S
I |
Symbol/Exchange
Company Name
Industry Group |
PRICE |
CHANGE
(%Change) |
Day High |
Volume
(% DAV)
(% 50 day avg vol) |
52 Wk Hi
% From Hi |
Featured
Date |
Price
Featured |
Pivot Featured |
|
Max Buy |