***Last / Change / Volume data in this table is the closing quote data***
Symbol/Exchange
Company Name
Industry Group |
PRICE |
CHANGE
(%Change) |
Day High |
Volume
(% DAV)
(% 50 day avg vol) |
52 Wk Hi
% From Hi |
Featured
Date |
Price
Featured |
Pivot Featured |
|
Max Buy |
SBCF
-
NASDAQ
Seacoast Banking Corp Fl
BANKING - Regional - Mid-Atlantic Banks
|
$23.57
|
+0.01
0.04% |
$23.76
|
1,343,035
347.04% of 50 DAV
50 DAV is 387,000
|
$25.13
-6.21%
|
2/13/2017
|
$24.84
|
PP = $23.10
|
|
MB = $24.26
|
Most Recent Note - 3/13/2017 6:15:22 PM
Y - Stubbornly holding its ground above its pivot point. Prior highs and its 50 DMA line in the $23 area define important near-term support to watch.
>>> FEATURED STOCK ARTICLE : Gap Up Gain and Strong Finish Triggered Technical Buy Signal - 2/13/2017 |
View all notes |
Set NEW NOTE alert |
Company Profile |
SEC
News |
Chart |
Request a new note
C
A
S
I |
CSFL
-
NASDAQ
Centerstate Banks Inc
Banks-Southeast
|
$26.48
|
+0.15
0.57% |
$26.62
|
966,087
325.28% of 50 DAV
50 DAV is 297,000
|
$26.46
0.08%
|
3/13/2017
|
$25.54
|
PP = $26.40
|
|
MB = $27.72
|
 Most Recent Note - 3/17/2017 5:11:14 PM
Y - Clinched a technical buy signal with heavy volume behind today's volume-driven gain as it rose and closed above the new pivot point cited based on its 1/26/17 high plus 10 cents. Its 50 DMA line ($25) and recent low ($23.80 on 2/08/17) define important near-term support where further deterioration would trigger a technical sell signal. Completed a new Public Offering of shares on 1/10/17. See the latest FSU analysis for more details and an annotated graph.
>>> FEATURED STOCK ARTICLE : Gain Backed By Volume For Best Ever Close - 3/15/2017 |
View all notes |
Set NEW NOTE alert |
Company Profile |
SEC
News |
Chart |
Request a new note
C
A
S
I |
IESC
-
NASDAQ
I E S Holdings Inc
Bldg-Maintenance and Svc
|
$19.95
|
+0.30
1.53% |
$20.10
|
79,919
153.69% of 50 DAV
50 DAV is 52,000
|
$23.00
-13.26%
|
11/23/2016
|
$19.35
|
PP = $18.26
|
|
MB = $19.17
|
Most Recent Note - 3/16/2017 7:00:33 PM
G - Technically, its outlook improved with today's quiet gain helping it close above its 50 DMA line ($19.45). Its Relative Strength improved to 80, right at the minimum guideline for buy candidates. Prior low ($18.05 on 1/18/17) defines important support near prior highs. Recently reported Dec '16 quarterly earnings -33% on +27% sales revenues, below the +25% minimum earnings guideline (C criteria), raising fundamental concerns.
>>> FEATURED STOCK ARTICLE : Recent Low Defines Support Near Prior Highs - 3/3/2017 |
View all notes |
Set NEW NOTE alert |
Company Profile |
SEC
News |
Chart |
Request a new note
C
A
S
I |
NSP
-
NYSE
Insperity Inc
Comml Svcs-Outsourcing
|
$89.25
|
-0.55
-0.61% |
$90.45
|
267,313
173.58% of 50 DAV
50 DAV is 154,000
|
$90.55
-1.44%
|
2/14/2017
|
$84.30
|
PP = $82.28
|
|
MB = $86.39
|
Most Recent Note - 3/17/2017 5:01:49 PM
G - Encountered distributional pressure today with a loss on above average volume. Wedged higher with gains in the past 2 weeks lacking volume conviction, getting extended from prior highs. The recent low ($79.97 on 2/24/17) defines important near-term support.
>>> FEATURED STOCK ARTICLE : Big Volume-Driven Gains Indicative of Institutional Demand - 2/14/2017 |
View all notes |
Set NEW NOTE alert |
Company Profile |
SEC
News |
Chart |
Request a new note
C
A
S
I |
BERY
-
NYSE
Berry Plastics Group Inc
CONSUMER NON-DURABLES - Packaging and Containers
|
$50.32
|
-0.04
-0.08% |
$50.54
|
1,005,303
85.72% of 50 DAV
50 DAV is 1,172,800
|
$52.97
-5.00%
|
11/30/2016
|
$50.26
|
PP = $46.47
|
|
MB = $48.79
|
Most Recent Note - 3/17/2017 4:58:54 PM
G - Relative Strength Rating is 76, back below the 80+ minimum for buy candidates under the fact-based investment system. Recently consolidating near its 50 DMA line ($50.468) while prior lows in the $48.50 area define important near-term support. Damaging losses and violations would trigger a more worrisome technical sell signal. Reported earnings +43% on -7% sales revenues for the Dec '16 quarter.
>>> FEATURED STOCK ARTICLE : Recent 50-Day Violation Raised Concerns - 2/7/2017 |
View all notes |
Set NEW NOTE alert |
Company Profile |
SEC
News |
Chart |
Request a new note
C
A
S
I |
Symbol/Exchange
Company Name
Industry Group |
PRICE |
CHANGE
(%Change) |
Day High |
Volume
(% DAV)
(% 50 day avg vol) |
52 Wk Hi
% From Hi |
Featured
Date |
Price
Featured |
Pivot Featured |
|
Max Buy |
EVR
-
NYSE
Evercore Partners Inc
FINANCIAL SERVICES - Investment Banking
|
$81.90
|
-0.80
-0.97% |
$83.00
|
625,232
143.40% of 50 DAV
50 DAV is 436,000
|
$83.30
-1.68%
|
1/5/2017
|
$71.40
|
PP = $72.07
|
|
MB = $75.67
|
Most Recent Note - 3/13/2017 6:07:58 PM
G - Inched to another new high with light volume behind today's 3rd consecutive gain. Holding its ground stubbornly, extended from its prior base. Its 50 DMA line and prior low ($74.75 on 2/08/17) define near-term support to watch. Recently reported Dec '16 quarterly earnings +17% on +9% sales revenues, below the +25% minimum earnings guideline (C criteria), raising fundamental concerns.
>>> FEATURED STOCK ARTICLE : Holding Ground After Latest Earnings Were Below +25% Guideline - 2/17/2017 |
View all notes |
Set NEW NOTE alert |
Company Profile |
SEC
News |
Chart |
Request a new note
C
A
S
I |
NTES
-
NASDAQ
Netease Inc Adr
INTERNET - Internet Information Providers
|
$291.50
|
+8.23
2.91% |
$292.00
|
1,371,659
118.66% of 50 DAV
50 DAV is 1,156,000
|
$308.66
-5.56%
|
2/10/2017
|
$259.30
|
PP = $272.68
|
|
MB = $286.31
|
Most Recent Note - 3/14/2017 6:10:58 PM
G - Holding its ground with volume totals cooling while consolidating following a big "breakaway gap" on 2/16/17. Prior highs in the $272 area define initial support to watch above its 50 DMA line.
>>> FEATURED STOCK ARTICLE : Rebounding With Earnings News Due Soon - 2/10/2017 |
View all notes |
Set NEW NOTE alert |
Company Profile |
SEC
News |
Chart |
Request a new note
C
A
S
I |
STMP
-
NASDAQ
Stamps.com Inc
INTERNET - Internet Software and Services
|
$128.80
|
-2.95
-2.24% |
$131.70
|
491,788
195.93% of 50 DAV
50 DAV is 251,000
|
$136.00
-5.29%
|
2/16/2017
|
$129.45
|
PP = $123.85
|
|
MB = $130.04
|
Most Recent Note - 3/17/2017 5:36:09 PM
Y - Pulled back with above average volume today and its color code is changed to yellow after finishing below its "max buy" level again. Subsequent losses leading to deterioration below the 50 DMA line or recent low ($120.11 on 3/02/17) would trigger technical sell signals.
>>> FEATURED STOCK ARTICLE : Recent Gains Have Lacked Heavy Volume Indicative of Accumulation - 2/16/2017 |
View all notes |
Set NEW NOTE alert |
Company Profile |
SEC
News |
Chart |
Request a new note
C
A
S
I |
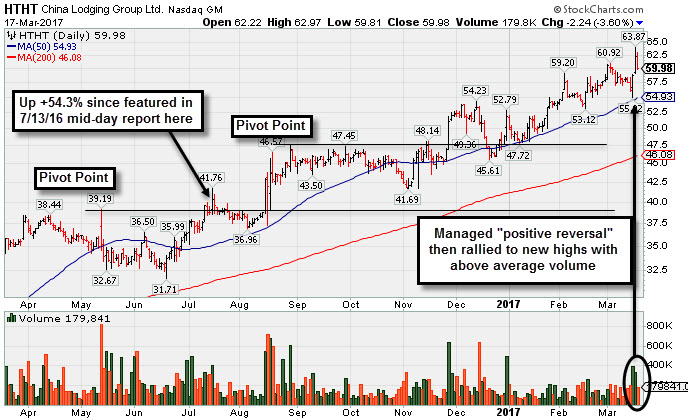
HTHT
-
NASDAQ
China Lodging Group Ads
LEISURE - Lodging
|
$59.98
|
-2.24
-3.60% |
$62.97
|
179,841
137.28% of 50 DAV
50 DAV is 131,000
|
$63.87
-6.09%
|
9/29/2016
|
$46.12
|
PP = $47.82
|
|
MB = $50.21
|
Most Recent Note - 3/17/2017 5:33:40 PM
G - Pulled back today from all-time highs following 2 consecutive volume-driven gains, Reported earnings +0% on +4% sales revenues for the Dec '16 quarter versus the year ago period, marking a 2nd comparison below the +25% minimum earnings guideline (C criteria), and its waning sales revenues growth rate is also a concern. See the latest FSU analysis for more details and a new annotated graph.
>>> FEATURED STOCK ARTICLE : Bullish Action Led to +54% Rally Since First Featured - 3/17/2017 |
View all notes |
Set NEW NOTE alert |
Company Profile |
SEC
News |
Chart |
Request a new note
C
A
S
I |
SIRI
-
NASDAQ
Sirius X M Holdings Inc
MEDIA - Broadcasting - Radio
|
$5.36
|
+0.03
0.56% |
$5.39
|
37,569,505
159.19% of 50 DAV
50 DAV is 23,600,000
|
$5.53
-3.07%
|
3/13/2017
|
$5.48
|
PP = $5.32
|
|
MB = $5.59
|
Most Recent Note - 3/14/2017 6:15:01 PM
Y - Pulled back today with volume slightly above average. Finished strong after highlighted in yellow with pivot point cited based on its 2/22/17 high plus 10 cents in the 3/13/17 mid-day report (read here). Technically, it broke out of an advanced "3-weeks tight" base pattern with a considerable gain backed by nearly 3 times average volume. Earnings increases have been above the +25% minimum guideline (C criteria) in 3 of the past 4 quarterly comparisons through Dec '16 while sales revenues growth was in the +9-11% range. See the latest FSU analysis for more details and an annotated graph.
>>> FEATURED STOCK ARTICLE : Breakout From Advanced Base Pattern Backed By Very Heavy Volume - 3/13/2017 |
View all notes |
Set NEW NOTE alert |
Company Profile |
SEC
News |
Chart |
Request a new note
C
A
S
I |
Symbol/Exchange
Company Name
Industry Group |
PRICE |
CHANGE
(%Change) |
Day High |
Volume
(% DAV)
(% 50 day avg vol) |
52 Wk Hi
% From Hi |
Featured
Date |
Price
Featured |
Pivot Featured |
|
Max Buy |
BEAT
-
NASDAQ
BioTelemetry Inc
Medical-Services
|
$27.45
|
-0.05
-0.18% |
$27.90
|
609,301
195.29% of 50 DAV
50 DAV is 312,000
|
$27.55
-0.36%
|
2/14/2017
|
$25.10
|
PP = $24.55
|
|
MB = $25.78
|
Most Recent Note - 3/13/2017 6:27:22 PM
G - Hit another new high with today's 3rd consecutive volume-driven gain. Prior highs in the $24 area and its 50 DMA line ($23.91) define important near-term support.
>>> FEATURED STOCK ARTICLE : Perched Near All-Time High With Earnings Report Due - 2/21/2017 |
View all notes |
Set NEW NOTE alert |
Company Profile |
SEC
News |
Chart |
Request a new note
C
A
S
I |
ULTA
-
NASDAQ
Ulta Beauty Inc
SPECIALTY RETAIL - Specialty Retail, Other
|
$288.81
|
+2.49
0.87% |
$289.27
|
663,195
95.70% of 50 DAV
50 DAV is 693,000
|
$289.13
-0.11%
|
3/6/2017
|
$274.96
|
PP = $278.73
|
|
MB = $292.67
|
Most Recent Note - 3/15/2017 8:37:07 PM
Y - Closed at a best-ever high with today's small gain on light volume. Its 50 DMA line ($271) defines near term support to watch on pullbacks. After highlighted in yellow in the 3/06/17 mid-day report a volume-driven gain for new highs on 3/10/17 triggered a new technical buy signal. Reported earnings +33% on +25% sales revenues for the Jan '17 quarter and prior earnings history satisfied the C and A criteria.
>>> FEATURED STOCK ARTICLE : Earnings News Due as Good Looking Candidate Hovers Near Highs - 3/6/2017 |
View all notes |
Set NEW NOTE alert |
Company Profile |
SEC
News |
Chart |
Request a new note
C
A
S
I |
ESNT
-
NYSE
Essent Group Ltd
Finance-MrtgandRel Svc
|
$36.00
|
-0.30
-0.83% |
$36.32
|
963,803
146.47% of 50 DAV
50 DAV is 658,000
|
$38.10
-5.51%
|
1/25/2017
|
$34.09
|
PP = $34.04
|
|
MB = $35.74
|
Most Recent Note - 3/13/2017 9:02:48 PM
G - Color code was changed to green after rallying above its "max buy" level. Its 50 DMA line and prior highs define important near-term support in the $33-34 area. Subsequent losses leading to violations may trigger technical sell signals.
>>> FEATURED STOCK ARTICLE : Consolidating Above Support Following Breakout - 3/10/2017 |
View all notes |
Set NEW NOTE alert |
Company Profile |
SEC
News |
Chart |
Request a new note
C
A
S
I |
VEEV
-
NYSE
Veeva Systems Inc Cl A
Computer Sftwr-Medical
|
$49.79
|
+0.75
1.53% |
$49.83
|
1,772,706
182.75% of 50 DAV
50 DAV is 970,000
|
$49.42
0.75%
|
3/16/2017
|
$49.00
|
PP = $48.05
|
|
MB = $50.45
|
Most Recent Note - 3/17/2017 5:07:49 PM
Y - Finished strong and near the session high today while posting a 3rd consecutive volume-driven gain. Highlighted in yellow with new pivot point cited based on its 11/30/16 high plus 10 cents in the 3/16/17 mid-day report. It triggered a technical buy signal as it hit a new 52-week high with 3 times average volume. Reported earnings +47% on +31% sales revenues for the Jan '17 quarter, and 3 of the past 4 quarterly comparisons were above the +25% minimum earnings guideline (C criteria). Its annual earnings (A criteria) history has been strong. See the latest FSU analysis for more details and an annotated graph.
>>> FEATURED STOCK ARTICLE : Breakout Gain for New Highs Backed by Three Times Average Volume - 3/16/2017 |
View all notes |
Set NEW NOTE alert |
Company Profile |
SEC
News |
Chart |
Request a new note
C
A
S
I |
ANET
-
NYSE
Arista Networks Inc
TELECOMMUNICATIONS - Communication Equipment
|
$128.10
|
+0.96
0.76% |
$128.56
|
1,025,457
112.19% of 50 DAV
50 DAV is 914,000
|
$128.93
-0.64%
|
3/6/2017
|
$119.43
|
PP = $123.22
|
|
MB = $129.38
|
Most Recent Note - 3/13/2017 6:26:30 PM
Y - Hit another new high today with a big gain on +29% above average volume. Hovered near its all-time high and formed an advanced "3-weeks tight" base pattern while holding its ground stubbornly following a big "breakaway gap" on 2/17/17. Color code was changed to yellow with new pivot point cited based on its 2/21/17 high plus 10 cents. Subsequent volume-driven gains for new highs may trigger a new (or add-on) technical buy signal.
>>> FEATURED STOCK ARTICLE : Stubbornly Holding Ground After Breakaway Gap - 3/1/2017 |
View all notes |
Set NEW NOTE alert |
Company Profile |
SEC
News |
Chart |
Request a new note
C
A
S
I |
Symbol/Exchange
Company Name
Industry Group |
PRICE |
CHANGE
(%Change) |
Day High |
Volume
(% DAV)
(% 50 day avg vol) |
52 Wk Hi
% From Hi |
Featured
Date |
Price
Featured |
Pivot Featured |
|
Max Buy |
VBTX
-
NASDAQ
Veritex Holdings Inc
BANKING - Regional - Southwest Banks
|
$28.25
|
+0.36
1.29% |
$28.54
|
172,676
203.15% of 50 DAV
50 DAV is 85,000
|
$29.43
-4.01%
|
1/23/2017
|
$27.30
|
PP = $27.87
|
|
MB = $29.26
|
Most Recent Note - 3/17/2017 5:05:26 PM
Y - Consolidating above its pivot point but below its "max buy" level. Posted a gain today with higher volume as prior highs in the $27 area and its 50 DMA line acted as important technical support.
>>> FEATURED STOCK ARTICLE : Hovering Near Highs But Latest Earnings Were Below Guidelines - 3/8/2017 |
View all notes |
Set NEW NOTE alert |
Company Profile |
SEC
News |
Chart |
Request a new note
C
A
S
I |
IBP
-
NYSE
Installed Building Prod
DIVERSIFIED SERVICES - Business/Management Services
|
$52.45
|
+0.30
0.58% |
$52.60
|
398,274
260.31% of 50 DAV
50 DAV is 153,000
|
$52.40
0.10%
|
2/27/2017
|
$44.83
|
PP = $44.40
|
|
MB = $46.62
|
Most Recent Note - 3/15/2017 8:29:48 PM
G - Hit another new high with today's gain on higher volume, getting very extended from its prior base. Stubbornly held its ground after an impressive streak of volume-driven gains. Prior highs in the $44 area define initial support to watch.
>>> FEATURED STOCK ARTICLE : Big Breakout Followed Solid Earnings News - 2/28/2017 |
View all notes |
Set NEW NOTE alert |
Company Profile |
SEC
News |
Chart |
Request a new note
C
A
S
I |
SFBS
-
NASDAQ
Servisfirst Bancshares
BANKING - Regional - Southeast Banks
|
$39.26
|
-0.89
-2.22% |
$40.20
|
1,672,945
961.46% of 50 DAV
50 DAV is 174,000
|
$42.66
-7.97%
|
7/19/2016
|
$26.64
|
PP = $26.41
|
|
MB = $27.73
|
Most Recent Note - 3/17/2017 5:40:34 PM
G - Slumped below its 50 DMA line and finished at a 5-week low with a loss on above average volume triggering a technical sell signal. Recently reported earnings +8% on +20% sales revenues for the Dec '16 quarter, below the +25% minimum guideline (C criteria), raising fundamental concerns.
>>> FEATURED STOCK ARTICLE : Perched Near All-Time High After Concerns Raised by Latest Earnings - 2/22/2017 |
View all notes |
Set NEW NOTE alert |
Company Profile |
SEC
News |
Chart |
Request a new note
C
A
S
I |
INGN
-
NASDAQ
Inogen Inc
HEALTH SERVICES - Medical Instruments and Supplies
|
$76.13
|
+1.21
1.62% |
$76.33
|
355,682
223.70% of 50 DAV
50 DAV is 159,000
|
$79.94
-4.77%
|
2/27/2017
|
$68.69
|
PP = $69.94
|
|
MB = $73.44
|
Most Recent Note - 3/13/2017 6:24:41 PM
G - Posted a solid gain on 3 times average volume and finished near the session high. Color code is changed to green after rallying above its "max buy" level. Prior highs in the $69 area define initial support to watch.
>>> FEATURED STOCK ARTICLE : Formed Orderly Base With Earnings News Due After Tuesday's Close - 2/27/2017 |
View all notes |
Set NEW NOTE alert |
Company Profile |
SEC
News |
Chart |
Request a new note
C
A
S
I |
PLAY
-
NASDAQ
Dave & Buster's Ent Inc
Retail-Restaurants
|
$59.93
|
-0.24
-0.40% |
$60.26
|
864,040
142.82% of 50 DAV
50 DAV is 605,000
|
$61.20
-2.08%
|
2/23/2017
|
$55.41
|
PP = $58.35
|
|
MB = $61.27
|
Most Recent Note - 3/15/2017 8:38:46 PM
Y - Posted a solid volume-driven gain for a best-ever close today. Held its ground after a 2nd consecutive volume-driven gain on 3/10/17 triggered a technical buy signal. Its 50 DMA line ($56) has recently acted as a support level.
>>> FEATURED STOCK ARTICLE : Consolidating Near 50 DMA After Recent Gains Lacked Volume - 2/23/2017 |
View all notes |
Set NEW NOTE alert |
Company Profile |
SEC
News |
Chart |
Request a new note
C
A
S
I |
Symbol/Exchange
Company Name
Industry Group |
PRICE |
CHANGE
(%Change) |
Day High |
Volume
(% DAV)
(% 50 day avg vol) |
52 Wk Hi
% From Hi |
Featured
Date |
Price
Featured |
Pivot Featured |
|
Max Buy |
LITE
-
NASDAQ
Lumentum Holdings Inc
TELECOMMUNICATIONS - Cables / Satalite Equipment
|
$49.45
|
+0.55
1.12% |
$49.80
|
2,042,358
126.31% of 50 DAV
50 DAV is 1,617,000
|
$53.70
-7.91%
|
2/8/2017
|
$44.60
|
PP = $44.80
|
|
MB = $47.04
|
Most Recent Note - 3/16/2017 12:57:45 PM
Y - Rebounding toward prior highs with a 2nd big gain today on heavier volume. Subsequent damaging losses below the 50 DMA line ($42.50) would trigger a more worrisome technical sell signal. See the latest FSU analysis for more details and an annotated graph.
>>> FEATURED STOCK ARTICLE : Support Elusive Following Prior Demand - 3/14/2017 |
View all notes |
Set NEW NOTE alert |
Company Profile |
SEC
News |
Chart |
Request a new note
C
A
S
I |
MOMO
-
NASDAQ
Momo Inc Ads Cl A
INTERNET - Content
|
$35.01
|
+0.28
0.81% |
$35.73
|
3,709,513
112.04% of 50 DAV
50 DAV is 3,311,000
|
$35.22
-0.60%
|
3/7/2017
|
$29.71
|
PP = $27.83
|
|
MB = $29.22
|
Most Recent Note - 3/16/2017 1:02:51 PM
G - Hitting new highs while posting a 5th consecutive gain today with above average volume. It has been noted - "Too extended from its prior base to be buyable under the fact-based investment system's guidelines. Prior highs in the $27-28 area define initial support to watch on pullbacks."
>>> FEATURED STOCK ARTICLE : Breakaway Gap Followed Very Strong Earnings Report - 3/7/2017 |
View all notes |
Set NEW NOTE alert |
Company Profile |
SEC
News |
Chart |
Request a new note
C
A
S
I |