***Last / Change / Volume data in this table is the closing quote data***
Symbol/Exchange
Company Name
Industry Group |
PRICE |
CHANGE
(%Change) |
Day High |
Volume
(% DAV)
(% 50 day avg vol) |
52 Wk Hi
% From Hi |
Featured
Date |
Price
Featured |
Pivot Featured |
|
Max Buy |
SBCF
-
NASDAQ
Seacoast Banking Corp Fl
BANKING - Regional - Mid-Atlantic Banks
|
$23.64
|
-0.14
-0.59% |
$23.94
|
186,990
48.82% of 50 DAV
50 DAV is 383,000
|
$25.13
-5.93%
|
2/13/2017
|
$24.84
|
PP = $23.10
|
|
MB = $24.26
|
 Most Recent Note - 3/13/2017 6:15:22 PM
Y - Stubbornly holding its ground above its pivot point. Prior highs and its 50 DMA line in the $23 area define important near-term support to watch.
>>> FEATURED STOCK ARTICLE : Gap Up Gain and Strong Finish Triggered Technical Buy Signal - 2/13/2017 |
View all notes |
Set NEW NOTE alert |
Company Profile |
SEC
News |
Chart |
Request a new note
C
A
S
I |
CSFL
-
NASDAQ
Centerstate Banks Inc
Banks-Southeast
|
$25.54
|
+0.23
0.89% |
$25.68
|
386,770
137.15% of 50 DAV
50 DAV is 282,000
|
$26.30
-2.91%
|
3/13/2017
|
$25.54
|
PP = $26.40
|
|
MB = $27.72
|
Most Recent Note - 3/13/2017 6:06:27 PM
Y - Color code is changed to yellow with new pivot point cited based on its 1/26/17 high plus 10 cents. Subsequent volume-driven gains for new highs may trigger a new (or add-on) technical buy signal. Recently churning above average volume while consolidating above its 50 DMA line ($25). Recent low ($23.80 on 2/08/17) defines important near-term support where further deterioration would trigger a technical sell signal. Completed a new Public Offering of shares on 1/10/17.
>>> FEATURED STOCK ARTICLE : Found Support Near 50-Day Average Following Offering - 2/6/2017 |
View all notes |
Set NEW NOTE alert |
Company Profile |
SEC
News |
Chart |
Request a new note
C
A
S
I |
IESC
-
NASDAQ
Integrated Electric Svcs
Bldg-Maintenance and Svc
|
$19.10
|
+0.05
0.26% |
$19.30
|
43,352
81.49% of 50 DAV
50 DAV is 53,200
|
$23.00
-16.96%
|
11/23/2016
|
$19.35
|
PP = $18.26
|
|
MB = $19.17
|
Most Recent Note - 3/9/2017 1:51:10 PM
G - Still consolidating just below its 50 DMA line ($19.50) with volume totals cooling. Its Relative Strength rating of 66 is below the 80+ minimum guideline for buy candidates. Prior low ($18.05 on 1/18/17) defines important support near prior highs. Recently reported Dec '16 quarterly earnings -33% on +27% sales revenues, below the +25% minimum earnings guideline (C criteria), raising fundamental concerns.
>>> FEATURED STOCK ARTICLE : Recent Low Defines Support Near Prior Highs - 3/3/2017 |
View all notes |
Set NEW NOTE alert |
Company Profile |
SEC
News |
Chart |
Request a new note
C
A
S
I |
NSP
-
NYSE
Insperity Inc
Comml Svcs-Outsourcing
|
$88.85
|
+0.05
0.06% |
$89.20
|
110,959
72.05% of 50 DAV
50 DAV is 154,000
|
$88.95
-0.11%
|
2/14/2017
|
$84.30
|
PP = $82.28
|
|
MB = $86.39
|
Most Recent Note - 3/10/2017 4:15:14 PM
G - Wedged higher today and hit another new 52-week high with a gain lacking volume conviction, getting more more extended from prior highs. The recent low ($79.97 on 2/24/17) defines important near-term support.
>>> FEATURED STOCK ARTICLE : Big Volume-Driven Gains Indicative of Institutional Demand - 2/14/2017 |
View all notes |
Set NEW NOTE alert |
Company Profile |
SEC
News |
Chart |
Request a new note
C
A
S
I |
BERY
-
NYSE
Berry Plastics Group Inc
CONSUMER NON-DURABLES - Packaging and Containers
|
$50.09
|
+0.18
0.36% |
$50.20
|
419,638
35.09% of 50 DAV
50 DAV is 1,196,000
|
$52.97
-5.44%
|
11/30/2016
|
$50.26
|
PP = $46.47
|
|
MB = $48.79
|
Most Recent Note - 3/10/2017 3:46:16 PM
G - Relative Strength Rating is 84, above the 80+ minimum for buy candidates under the fact-based investment system, but it has recently been consolidating just below its 50 DMA line ($50.38). Recent lows in the $48.50 area define near-term support. Damaging losses and violations would trigger a more worrisome technical sell signal. Reported earnings +43% on -7% sales revenues for the Dec '16 quarter.
>>> FEATURED STOCK ARTICLE : Recent 50-Day Violation Raised Concerns - 2/7/2017 |
View all notes |
Set NEW NOTE alert |
Company Profile |
SEC
News |
Chart |
Request a new note
C
A
S
I |
Symbol/Exchange
Company Name
Industry Group |
PRICE |
CHANGE
(%Change) |
Day High |
Volume
(% DAV)
(% 50 day avg vol) |
52 Wk Hi
% From Hi |
Featured
Date |
Price
Featured |
Pivot Featured |
|
Max Buy |
EVR
-
NYSE
Evercore Partners Inc
FINANCIAL SERVICES - Investment Banking
|
$82.30
|
+0.50
0.61% |
$82.85
|
318,436
74.75% of 50 DAV
50 DAV is 426,000
|
$82.45
-0.18%
|
1/5/2017
|
$71.40
|
PP = $72.07
|
|
MB = $75.67
|
Most Recent Note - 3/13/2017 6:07:58 PM
G - Inched to another new high with light volume behind today's 3rd consecutive gain. Holding its ground stubbornly, extended from its prior base. Its 50 DMA line and prior low ($74.75 on 2/08/17) define near-term support to watch. Recently reported Dec '16 quarterly earnings +17% on +9% sales revenues, below the +25% minimum earnings guideline (C criteria), raising fundamental concerns.
>>> FEATURED STOCK ARTICLE : Holding Ground After Latest Earnings Were Below +25% Guideline - 2/17/2017 |
View all notes |
Set NEW NOTE alert |
Company Profile |
SEC
News |
Chart |
Request a new note
C
A
S
I |
NTES
-
NASDAQ
Netease Inc Adr
INTERNET - Internet Information Providers
|
$289.85
|
+0.45
0.16% |
$290.99
|
996,472
87.64% of 50 DAV
50 DAV is 1,137,000
|
$308.66
-6.09%
|
2/10/2017
|
$259.30
|
PP = $272.68
|
|
MB = $286.31
|
Most Recent Note - 3/8/2017 5:47:26 PM
G - Extended from its prior base and consolidating following a big "breakaway gap" on 2/16/17. Prior highs in the $272 area define initial support to watch above its 50 DMA line.
>>> FEATURED STOCK ARTICLE : Rebounding With Earnings News Due Soon - 2/10/2017 |
View all notes |
Set NEW NOTE alert |
Company Profile |
SEC
News |
Chart |
Request a new note
C
A
S
I |
STMP
-
NASDAQ
Stamps.com Inc
INTERNET - Internet Software and Services
|
$131.10
|
+1.10
0.85% |
$132.30
|
207,415
85.71% of 50 DAV
50 DAV is 242,000
|
$136.00
-3.60%
|
2/16/2017
|
$129.45
|
PP = $123.85
|
|
MB = $130.04
|
Most Recent Note - 3/8/2017 5:50:53 PM
Y - Found prompt support at its 50 DMA line ($122) and its color code is changed to yellow while consolidating above its pivot point yet below its "max buy" level. Deterioration below the recent low ($120.11 on 3/02/17) would trigger a more worrisome technical sell signal.
>>> FEATURED STOCK ARTICLE : Recent Gains Have Lacked Heavy Volume Indicative of Accumulation - 2/16/2017 |
View all notes |
Set NEW NOTE alert |
Company Profile |
SEC
News |
Chart |
Request a new note
C
A
S
I |
HTHT
-
NASDAQ
China Lodging Group Ads
LEISURE - Lodging
|
$57.58
|
-0.42
-0.72% |
$58.44
|
166,285
130.93% of 50 DAV
50 DAV is 127,000
|
$60.92
-5.48%
|
9/29/2016
|
$46.12
|
PP = $47.82
|
|
MB = $50.21
|
Most Recent Note - 3/13/2017 6:12:09 PM
G - Perched near its all-time high, extended from any sound base. Its 50 DMA line ($54.19) defines important near-term support to watch. Due to report earnings for the Dec '16 quarter after the close on Tuesday. Volume and volatility often increase near earnings news. Earnings were +10% on +6% sales revenues for the Sep '16 quarter, below the +25% minimum earnings guideline (C criteria).
>>> FEATURED STOCK ARTICLE : Mostly Bullish Action Continues Since Latest Earnings Report - 2/9/2017 |
View all notes |
Set NEW NOTE alert |
Company Profile |
SEC
News |
Chart |
Request a new note
C
A
S
I |
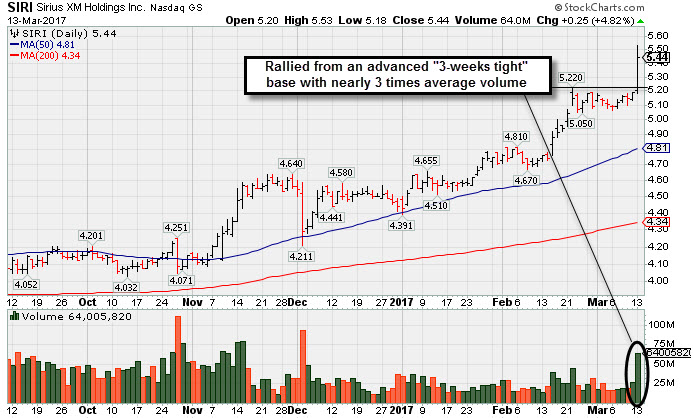
SIRI
-
NASDAQ
Sirius X M Holdings Inc
MEDIA - Broadcasting - Radio
|
$5.44
|
+0.25
4.82% |
$5.53
|
64,011,542
280.95% of 50 DAV
50 DAV is 22,784,000
|
$5.22
4.21%
|
3/13/2017
|
$5.48
|
PP = $5.32
|
|
MB = $5.59
|
Most Recent Note - 3/13/2017 6:19:54 PM
Y - Finished strong after highlighted in yellow with pivot point cited based on its 2/22/17 high plus 10 cents in the earlier mid-day report (read here). Technically, it broke out of an advanced "3-weeks tight" base pattern with today's gain backed by nearly 3 times average volume. Earnings increases have been above the +25% minimum guideline (C criteria) in 3 of the past 4 quarterly comparisons through Dec '16 while sales revenues growth was in the +9-11% range. Its annual earnings history (A criteria) has been improving since a downturn in FY '13. It has a large supply of 4.71 billion shares outstanding. See the latest FSU analysis for more details and a new annotated graph.
>>> FEATURED STOCK ARTICLE : Breakout From Advanced Base Pattern Backed By Very Heavy Volume - 3/13/2017 |
View all notes |
Set NEW NOTE alert |
Company Profile |
SEC
News |
Chart |
Request a new note
C
A
S
I |
Symbol/Exchange
Company Name
Industry Group |
PRICE |
CHANGE
(%Change) |
Day High |
Volume
(% DAV)
(% 50 day avg vol) |
52 Wk Hi
% From Hi |
Featured
Date |
Price
Featured |
Pivot Featured |
|
Max Buy |
BEAT
-
NASDAQ
BioTelemetry Inc
Medical-Services
|
$27.50
|
+0.65
2.42% |
$27.55
|
468,829
151.24% of 50 DAV
50 DAV is 310,000
|
$27.30
0.73%
|
2/14/2017
|
$25.10
|
PP = $24.55
|
|
MB = $25.78
|
Most Recent Note - 3/13/2017 6:27:22 PM
G - Hit another new high with today's 3rd consecutive volume-driven gain. Prior highs in the $24 area and its 50 DMA line ($23.91) define important near-term support.
>>> FEATURED STOCK ARTICLE : Perched Near All-Time High With Earnings Report Due - 2/21/2017 |
View all notes |
Set NEW NOTE alert |
Company Profile |
SEC
News |
Chart |
Request a new note
C
A
S
I |
ULTA
-
NASDAQ
Ulta Beauty Inc
SPECIALTY RETAIL - Specialty Retail, Other
|
$286.91
|
+0.49
0.17% |
$288.59
|
1,083,699
160.55% of 50 DAV
50 DAV is 675,000
|
$287.19
-0.10%
|
3/6/2017
|
$274.96
|
PP = $278.73
|
|
MB = $292.67
|
Most Recent Note - 3/10/2017 1:19:49 PM
Y - Reported earnings +33% on +25% sales revenues for the Jan '17 quarter. Hitting a new all-time high with today's volume-driven gain. Its 50 DMA line ($269.42) defines near term support to watch on pullbacks. Highlighted in yellow in the 3/06/17 mid-day report with new pivot point cited based on its 8/24/16 high plus 10 cents while noted - "A volume-driven gain for new highs may trigger a new technical buy signal. Prior earnings history satisfied the C and A criteria."
>>> FEATURED STOCK ARTICLE : Earnings News Due as Good Looking Candidate Hovers Near Highs - 3/6/2017 |
View all notes |
Set NEW NOTE alert |
Company Profile |
SEC
News |
Chart |
Request a new note
C
A
S
I |
ESNT
-
NYSE
Essent Group Ltd
Finance-MrtgandRel Svc
|
$36.12
|
+1.02
2.91% |
$36.18
|
729,969
114.06% of 50 DAV
50 DAV is 640,000
|
$38.10
-5.20%
|
1/25/2017
|
$34.09
|
PP = $34.04
|
|
MB = $35.74
|
Most Recent Note - 3/13/2017 6:21:46 PM
G - Color code is changed to green after rallying above its "max buy" level. Its 50 DMA line and prior highs define important near-term support in the $33-34 area. Subsequent losses leading to violations may trigger technical sell signals.
>>> FEATURED STOCK ARTICLE : Consolidating Above Support Following Breakout - 3/10/2017 |
View all notes |
Set NEW NOTE alert |
Company Profile |
SEC
News |
Chart |
Request a new note
C
A
S
I |
ANET
-
NYSE
Arista Networks Inc
TELECOMMUNICATIONS - Communication Equipment
|
$127.47
|
+3.30
2.66% |
$127.64
|
1,119,992
129.33% of 50 DAV
50 DAV is 866,000
|
$125.00
1.98%
|
3/6/2017
|
$119.43
|
PP = $123.22
|
|
MB = $129.38
|
Most Recent Note - 3/13/2017 6:26:30 PM
Y - Hit another new high today with a big gain on +29% above average volume. Hovered near its all-time high and formed an advanced "3-weeks tight" base pattern while holding its ground stubbornly following a big "breakaway gap" on 2/17/17. Color code was changed to yellow with new pivot point cited based on its 2/21/17 high plus 10 cents. Subsequent volume-driven gains for new highs may trigger a new (or add-on) technical buy signal.
>>> FEATURED STOCK ARTICLE : Stubbornly Holding Ground After Breakaway Gap - 3/1/2017 |
View all notes |
Set NEW NOTE alert |
Company Profile |
SEC
News |
Chart |
Request a new note
C
A
S
I |
VBTX
-
NASDAQ
Veritex Holdings Inc
BANKING - Regional - Southwest Banks
|
$27.55
|
+0.10
0.36% |
$27.88
|
36,653
41.18% of 50 DAV
50 DAV is 89,000
|
$29.43
-6.39%
|
1/23/2017
|
$27.30
|
PP = $27.87
|
|
MB = $29.26
|
Most Recent Note - 3/10/2017 3:20:39 PM
Y - Volume-driven losses are testing prior highs in the $27 area and its 50 DMA line ($27.56) defining important support. See the latest FSU analysis for more details and an annotated graph.
>>> FEATURED STOCK ARTICLE : Hovering Near Highs But Latest Earnings Were Below Guidelines - 3/8/2017 |
View all notes |
Set NEW NOTE alert |
Company Profile |
SEC
News |
Chart |
Request a new note
C
A
S
I |
Symbol/Exchange
Company Name
Industry Group |
PRICE |
CHANGE
(%Change) |
Day High |
Volume
(% DAV)
(% 50 day avg vol) |
52 Wk Hi
% From Hi |
Featured
Date |
Price
Featured |
Pivot Featured |
|
Max Buy |
IBP
-
NYSE
Installed Building Prod
DIVERSIFIED SERVICES - Business/Management Services
|
$49.95
|
+0.30
0.60% |
$50.25
|
185,659
121.35% of 50 DAV
50 DAV is 153,000
|
$50.05
-0.20%
|
2/27/2017
|
$44.83
|
PP = $44.40
|
|
MB = $46.62
|
Most Recent Note - 3/13/2017 6:13:46 PM
G - Touched a new high today. Stubbornly holding its ground after an impressive streak of volume-driven gains, very extended from its prior base. Prior highs in the $44 area define initial support to watch.
>>> FEATURED STOCK ARTICLE : Big Breakout Followed Solid Earnings News - 2/28/2017 |
View all notes |
Set NEW NOTE alert |
Company Profile |
SEC
News |
Chart |
Request a new note
C
A
S
I |
SFBS
-
NASDAQ
Servisfirst Bancshares
BANKING - Regional - Southeast Banks
|
$40.29
|
+0.29
0.73% |
$41.06
|
213,787
123.58% of 50 DAV
50 DAV is 173,000
|
$42.66
-5.56%
|
7/19/2016
|
$26.64
|
PP = $26.41
|
|
MB = $27.73
|
Most Recent Note - 3/13/2017 6:16:41 PM
G - Consolidating above its 50 DMA line ($39.71) defining important near-term support. A subsequent violation would trigger a technical sell signal. Recently reported earnings +8% on +20% sales revenues for the Dec '16 quarter, below the +25% minimum guideline (C criteria), raising fundamental concerns.
>>> FEATURED STOCK ARTICLE : Perched Near All-Time High After Concerns Raised by Latest Earnings - 2/22/2017 |
View all notes |
Set NEW NOTE alert |
Company Profile |
SEC
News |
Chart |
Request a new note
C
A
S
I |
INGN
-
NASDAQ
Inogen Inc
HEALTH SERVICES - Medical Instruments and Supplies
|
$75.61
|
+4.18
5.85% |
$75.74
|
471,272
316.29% of 50 DAV
50 DAV is 149,000
|
$79.94
-5.42%
|
2/27/2017
|
$68.69
|
PP = $69.94
|
|
MB = $73.44
|
Most Recent Note - 3/13/2017 6:24:41 PM
G - Posted a solid gain on 3 times average volume and finished near the session high. Color code is changed to green after rallying above its "max buy" level. Prior highs in the $69 area define initial support to watch.
>>> FEATURED STOCK ARTICLE : Formed Orderly Base With Earnings News Due After Tuesday's Close - 2/27/2017 |
View all notes |
Set NEW NOTE alert |
Company Profile |
SEC
News |
Chart |
Request a new note
C
A
S
I |
PLAY
-
NASDAQ
Dave & Buster's Ent Inc
Retail-Restaurants
|
$58.53
|
-1.09
-1.83% |
$60.50
|
843,248
141.01% of 50 DAV
50 DAV is 598,000
|
$60.50
-3.26%
|
2/23/2017
|
$55.41
|
PP = $58.35
|
|
MB = $61.27
|
Most Recent Note - 3/10/2017 12:58:48 PM
Y - Hitting a new high with today's 2nd consecutive volume-driven gain. Its 50 DMA line ($56) has recently acted as a support level. Gains had lacked great volume conviction since first highlighted in yellow in the 2/23/17 mid-day report (read here).
>>> FEATURED STOCK ARTICLE : Consolidating Near 50 DMA After Recent Gains Lacked Volume - 2/23/2017 |
View all notes |
Set NEW NOTE alert |
Company Profile |
SEC
News |
Chart |
Request a new note
C
A
S
I |
LITE
-
NASDAQ
Lumentum Holdings Inc
TELECOMMUNICATIONS - Cables / Satalite Equipment
|
$44.85
|
-0.95
-2.07% |
$46.80
|
1,769,008
119.04% of 50 DAV
50 DAV is 1,486,000
|
$53.70
-16.47%
|
2/8/2017
|
$44.60
|
PP = $44.80
|
|
MB = $47.04
|
Most Recent Note - 3/10/2017 4:11:27 PM
Y - Holding its ground near prior highs in the $44-45 area previously noted as important support to watch. Subsequent damaging losses would raise concerns and trigger a technical sell signal.
>>> FEATURED STOCK ARTICLE : Gap Up Gain and Strong Finish Triggered Technical Buy Signal - 2/8/2017 |
View all notes |
Set NEW NOTE alert |
Company Profile |
SEC
News |
Chart |
Request a new note
C
A
S
I |
Symbol/Exchange
Company Name
Industry Group |
PRICE |
CHANGE
(%Change) |
Day High |
Volume
(% DAV)
(% 50 day avg vol) |
52 Wk Hi
% From Hi |
Featured
Date |
Price
Featured |
Pivot Featured |
|
Max Buy |
MOMO
-
NASDAQ
Momo Inc Ads Cl A
INTERNET - Content
|
$31.38
|
+0.60
1.95% |
$31.50
|
5,223,311
178.64% of 50 DAV
50 DAV is 2,924,000
|
$34.35
-8.65%
|
3/7/2017
|
$29.71
|
PP = $27.83
|
|
MB = $29.22
|
Most Recent Note - 3/13/2017 12:27:49 PM
G - It remains too extended from its prior base to be buyable under the fact-based investment system's guidelines. Prior highs in the $27-28 area define initial support to watch on pullbacks.
>>> FEATURED STOCK ARTICLE : Breakaway Gap Followed Very Strong Earnings Report - 3/7/2017 |
View all notes |
Set NEW NOTE alert |
Company Profile |
SEC
News |
Chart |
Request a new note
C
A
S
I |