You are not logged in.
This means you
CAN ONLY VIEW reports that were published prior to Friday, March 28, 2025.
You
MUST UPGRADE YOUR MEMBERSHIP if you want to see any current reports.
AFTER MARKET UPDATE - FRIDAY, MARCH 31ST, 2017
Previous After Market Report Next After Market Report >>>
|
|
|
|
DOW |
-65.27 |
20,663.22 |
-0.31% |
|
Volume |
1,345,003,610 |
+45% |
|
Volume |
1,719,437,920 |
+9% |
|
NASDAQ |
-2.60 |
5,911.74 |
-0.04% |
|
Advancers |
1,749 |
60% |
|
Advancers |
1,544 |
54% |
|
S&P 500 |
-5.34 |
2,362.72 |
-0.23% |
|
Decliners |
1,176 |
40% |
|
Decliners |
1,292 |
46% |
|
Russell 2000 |
+3.57 |
1,385.92 |
+0.26% |
|
52 Wk Highs |
87 |
|
|
52 Wk Highs |
116 |
|
|
S&P 600 |
+1.75 |
844.17 |
+0.21% |
|
52 Wk Lows |
5 |
|
|
52 Wk Lows |
22 |
|
|
 |
Indices Pulled Back Yet Ended First Quarter With Solid Gains
Kenneth J. Gruneisen - Passed the CAN SLIM® Master's Exam
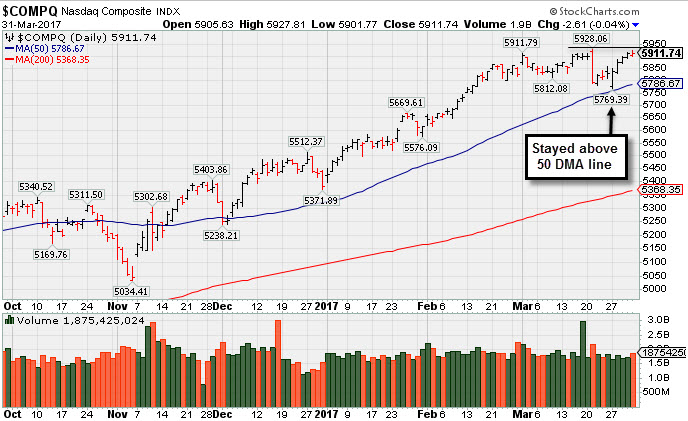
For the week, the Dow added 0.3%, the S&P 500 gained 0.8%, and the Nasdaq climbed 1.4%. In March, the Dow lost 0.7%, the S&P 500 was essentially flat, while the Nasdaq advanced 1.5%. In the First quarter, the Dow climbed 4.6%, the S&P 500 added 5.5%, and the Nasdaq jumped 9.8%, its best quarter since 2013. Stocks finished lower on Friday. The Dow slid 65 points to 20663. The S&P 500 was off 5 points to 2362 while the Nasdaq Composite dipped 2 points to 5911. The volume totals reported were higher than the prior session totals on the NYSE and on the Nasdaq exchange. Breadth was positive as advancers led decliners by 3-2 on the NYSE and 7-6 on the Nasdaq exchange. There were 35 high-ranked companies from the Leaders List that made new 52-week highs and were listed on the BreakOuts Page, versus the total of 41 on the prior session. New 52-week highs totals outnumbered new 52-week lows on both the Nasdaq exchange and the NYSE.
PICTURED: The Nasdaq Composite Index found support above its 50-day moving average (DMA) line. Subsequent losses leading to a 50 DMA line violation would raise concerns regarding the market rally's health.
Leadership has remained healthy with respect to the number of high-ranked stocks hitting new highs, although the major averages' (M criteria) uptrend recently came under pressure. New buying efforts should only be made in candidates with superior fundamental and technical characteristics. The Featured Stocks Page lists noteworthy high-ranked leaders.
The major averages fluctuated on the final trading day of the first quarter as investors weighed a flurry of economic data. Before the open, reports showed consumer spending rose 0.1%, versus a projected 0.2% increase, and personal income grew 0.4%, in line with estimates. A separate release showed that the PCE Deflator, the Fed’s preferred proxy for inflation, rose 2.1% year-over-year in February. Finally, the University of Michigan revised its March sentiment reading down to 96.9 from 97.6. On the Fed front, New York Regional President William Dudley said during an interview on Bloomberg TV that three interest rates hikes in 2017 appears reasonable.
Eight of 11 sectors in the S&P 500 finished lower with Financials lagging while Real Estate outperformed. Breadth was positive on issues by 4-3 on the NYSE and was flat on the Nasdaq. Composite NYSE volume was more than 3.2 billion shares. In M&A news, FMC Corp (FMC +13.15%) gapped up after it agreed to an asset swap with DuPont (DD -1.60%).
Treasuries were higher along the curve with the benchmark 10-year up 7/32 to yield 2.40%. In commodities, NYMEX WTI crude rallied late to close 0.7% higher at $50.70/barrel. |
 Kenneth J. Gruneisen started out as a licensed stockbroker in August 1987, a couple of months prior to the historic stock market crash that took the Dow Jones Industrial Average down -22.6% in a single day. He has published daily fact-based fundamental and technical analysis on high-ranked stocks online for two decades. Through FACTBASEDINVESTING.COM, Kenneth provides educational articles, news, market commentary, and other information regarding proven investment systems that work in good times and bad.
Comments contained in the body of this report are technical opinions only and are not necessarily those of Gruneisen Growth Corp. The material herein has been obtained from sources believed to be reliable and accurate, however, its accuracy and completeness cannot be guaranteed. Our firm, employees, and customers may effect transactions, including transactions contrary to any recommendation herein, or have positions in the securities mentioned herein or options with respect thereto. Any recommendation contained in this report may not be suitable for all investors and it is not to be deemed an offer or solicitation on our part with respect to the purchase or sale of any securities. |
|
 |
Commodity-Linked Groups and Biotech Index Edged Higher
Kenneth J. Gruneisen - Passed the CAN SLIM® Master's Exam
The Bank Index ($BKX -1.07%) outpaced the Broker/Dealer Index ($XBD -0.18%) to the downside while the Retail Index ($RLX +0.08%) eked out a tiny gain on Friday. The Gold & Silver Index ($XAU +0.59%) and Oil Services Index ($OSX +0.53%) both edged higher while the Integrated Oil Index ($XOI -0.29%) ended slightly lower. The tech sector was led by a small gain from the Biotechnology Index ($BTK +0.25%), meanwhile the Semiconductor Index ($SOX -0.04%) finished flat and the Networking Index ($NWX -0.20%) inched lower. Charts courtesy www.stockcharts.com
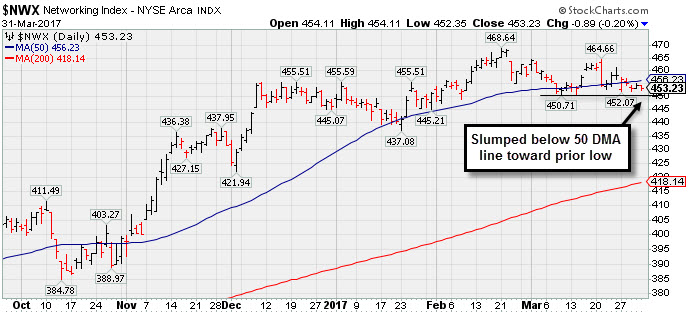 PICTURED: The Networking Index ($NWX -0.20%) is below its 50-day moving average (DMA) line, slumping toward a prior low.
| Oil Services |
$OSX |
169.76 |
+0.90 |
+0.53% |
-7.63% |
| Integrated Oil |
$XOI |
1,182.27 |
-3.43 |
-0.29% |
-6.76% |
| Semiconductor |
$SOX |
1,011.40 |
-0.41 |
-0.04% |
+11.58% |
| Networking |
$NWX |
453.23 |
-0.89 |
-0.20% |
+1.60% |
| Broker/Dealer |
$XBD |
215.96 |
-0.38 |
-0.18% |
+5.20% |
| Retail |
$RLX |
1,454.85 |
+1.11 |
+0.08% |
+8.33% |
| Gold & Silver |
$XAU |
83.77 |
+0.50 |
+0.60% |
+6.23% |
| Bank |
$BKX |
92.05 |
-1.00 |
-1.07% |
+0.28% |
| Biotech |
$BTK |
3,566.02 |
+8.98 |
+0.25% |
+15.97% |
|
|
|
 |
Best Ever Close For High-Ranked Medical Product Maker
Kenneth J. Gruneisen - Passed the CAN SLIM® Master's Exam
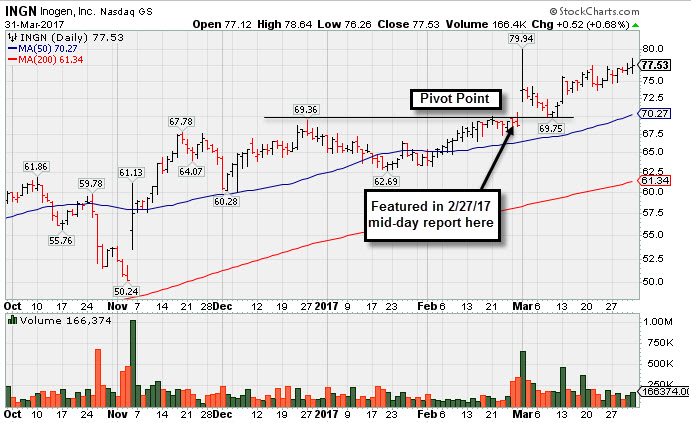
Inogen Inc (INGN +$0.55 or +0.71% to $77.56) inched higher with average volume today for a best-ever close. It has been stubbornly holding its ground and making steady progress near its all-time high. Its 50-day moving average (DMA) line ($70.27) and prior highs in the $69 area define important near-term support to watch on pullbacks. The company reported earnings +70% on +26% sales revenues for the Dec'16 quarter, and the stock's reaction to the news was a big gap up and volume-driven gain on 3/01/17 for new highs.
INGN was highlighted in yellow with pivot point cited based on its 2/21/17 high in the mid-day report (read here), perched near all-time highs after a saucer-with-handle base. In this FSU section on 2/27/17 an annotated graph was included under the headline, "Formed Orderly Base With Earnings News Due After Tuesday's Close", just ahead of its earnings announcement. It was noted - "Subsequent volume-driven gains for new highs coupled with strong earnings may clinch a technical buy signal. Reported earnings +23% on +33% sales revenues for the Sep '16 quarter, slightly below the +25% minimum guideline. Due to report Dec '16 earnings news on 2/28/17, and volume and volatility often increase near earnings news. Rebounded and made gradual progress since dropped from the Featured Stocks list on 10/27/16."
INGN currently has an A Timeliness Rating and a B Sponsorship Rating. Its current Up/Down Volume ratio of 1.5 is an unbiased indication that its shares were under accumulation over the past 50 days. The number of top-rated funds owning its share rose from 302 in Mar '16 to 339 in Dec '16, a reassuring sign concerning the I criteria. Its small supply of 15.6 million shares (S criteria) in the public float can contribute to greater price volatility in the event of institutional buying or selling.
The high-ranked Medical - Products firm makes portable oxygen concentrators for people with chronic respiratory conditions. It went through a deeper correction and rebounded since first highlighted in yellow with new pivot point cited based on its 9/14/15 high plus 10 cents in 8/05/16 mid-day report (read here). |
|
|
Color Codes Explained :
Y - Better candidates highlighted by our
staff of experts.
G - Previously featured
in past reports as yellow but may no longer be buyable under the
guidelines.
***Last / Change / Volume data in this table is the closing quote data***
Symbol/Exchange
Company Name
Industry Group |
PRICE |
CHANGE
(%Change) |
Day High |
Volume
(% DAV)
(% 50 day avg vol) |
52 Wk Hi
% From Hi |
Featured
Date |
Price
Featured |
Pivot Featured |
|
Max Buy |
SBCF
-
NASDAQ
Seacoast Banking Corp Fl
BANKING - Regional - Mid-Atlantic Banks
|
$23.98
|
-0.27
-1.11% |
$24.38
|
404,475
94.72% of 50 DAV
50 DAV is 427,000
|
$25.13
-4.58%
|
2/13/2017
|
$24.84
|
PP = $23.10
|
|
MB = $24.26
|
Most Recent Note - 3/30/2017 5:20:22 PM
Y - Finished near the session high with below average volume behind today's gain for its 2nd best close ever. Subsequent deterioration below the 50 DMA line and recent low ($21.89 on 3/22/17) would raise more serious concerns and trigger worrisome technical sell signals. See the latest FSU analysis for more details and an annotated graph.
>>> FEATURED STOCK ARTICLE : Rebound After Slump Below 50-Day Average Into Prior Base - 3/28/2017 |
View all notes |
Set NEW NOTE alert |
Company Profile |
SEC
News |
Chart |
Request a new note
C
A
S
I |
CSFL
-
NASDAQ
Centerstate Banks Inc
Banks-Southeast
|
$25.90
|
-0.14
-0.54% |
$26.24
|
404,791
133.59% of 50 DAV
50 DAV is 303,000
|
$26.94
-3.85%
|
3/13/2017
|
$25.54
|
PP = $26.40
|
|
MB = $27.72
|
Most Recent Note - 3/30/2017 5:23:18 PM
Y - Rose near prior highs with today's 3rd consecutive gain after finding prompt support near its 50 DMA line and its color code is changed to yellow. Subsequent losses below its recent low ($23.70 on 3/27/17) would raise greater concerns.
>>> FEATURED STOCK ARTICLE : Gain Backed By Volume For Best Ever Close - 3/15/2017 |
View all notes |
Set NEW NOTE alert |
Company Profile |
SEC
News |
Chart |
Request a new note
C
A
S
I |
NSP
-
NYSE
Insperity Inc
Comml Svcs-Outsourcing
|
$88.65
|
+1.80
2.07% |
$88.65
|
188,562
120.87% of 50 DAV
50 DAV is 156,000
|
$90.55
-2.10%
|
2/14/2017
|
$84.30
|
PP = $82.28
|
|
MB = $86.39
|
Most Recent Note - 3/28/2017 5:23:24 PM
G - Color code is changed to green after light volume gains above its "max buy" level. Prior highs in the $86 area and old highs the $82 area define initial support levels to watch above its 50 DMA line ($80.48).
>>> FEATURED STOCK ARTICLE : Ordinary Pullback From Highs With Lighter Volume - 3/22/2017 |
View all notes |
Set NEW NOTE alert |
Company Profile |
SEC
News |
Chart |
Request a new note
C
A
S
I |
EVR
-
NYSE
Evercore Partners Inc
FINANCIAL SERVICES - Investment Banking
|
$77.90
|
+0.20
0.26% |
$78.30
|
298,215
68.24% of 50 DAV
50 DAV is 437,000
|
$83.30
-6.48%
|
1/5/2017
|
$71.40
|
PP = $72.07
|
|
MB = $75.67
|
Most Recent Note - 3/30/2017 5:16:35 PM
G - Posted a gain today with higher volume but still below average volume. Halted its slide after triggering technical sell signals and undercutting the prior low ($74.75 on 2/08/17), but a rebound above the 50-day moving average (DMA) line ($78.86) is still needed for its outlook to improve. See the latest FSU analysis for more details and a new annotated graph.
>>> FEATURED STOCK ARTICLE : Outlook Hurt By 50-Day Moving Average Breach and Fundamentals - 3/30/2017 |
View all notes |
Set NEW NOTE alert |
Company Profile |
SEC
News |
Chart |
Request a new note
C
A
S
I |
NTES
-
NASDAQ
Netease Inc Adr
INTERNET - Internet Information Providers
|
$284.00
|
+1.65
0.58% |
$285.69
|
794,269
69.73% of 50 DAV
50 DAV is 1,139,000
|
$308.66
-7.99%
|
2/10/2017
|
$259.30
|
PP = $272.68
|
|
MB = $286.31
|
Most Recent Note - 3/29/2017 5:10:54 PM
Y - Color code is changed to yellow after a loss with below average volume led to a pullback below its "max buy" level. Volume totals have been cooling while consolidating in a tight trading range following a big "breakaway gap" on 2/16/17. Prior highs in the $272 area define initial support to watch along with its 50 DMA line ($276).
>>> FEATURED STOCK ARTICLE : Consolidating in Tight Range Following Breakaway Gap - 3/23/2017 |
View all notes |
Set NEW NOTE alert |
Company Profile |
SEC
News |
Chart |
Request a new note
C
A
S
I |
Symbol/Exchange
Company Name
Industry Group |
PRICE |
CHANGE
(%Change) |
Day High |
Volume
(% DAV)
(% 50 day avg vol) |
52 Wk Hi
% From Hi |
Featured
Date |
Price
Featured |
Pivot Featured |
|
Max Buy |
HTHT
-
NASDAQ
China Lodging Group Ads
LEISURE - Lodging
|
$62.05
|
-0.35
-0.56% |
$62.69
|
114,381
78.34% of 50 DAV
50 DAV is 146,000
|
$64.32
-3.53%
|
9/29/2016
|
$46.12
|
PP = $47.82
|
|
MB = $50.21
|
Most Recent Note - 3/27/2017 6:41:31 PM
G - Hovering near all-time highs with volume totals cooling, holding its ground following volume-driven gains, Previously noted with caution - "Reported earnings +0% on +4% sales revenues for the Dec '16 quarter versus the year ago period, marking a 2nd comparison below the +25% minimum earnings guideline (C criteria), and its waning sales revenues growth rate is also a concern." See the latest FSU analysis for more details and an annotated graph.
>>> FEATURED STOCK ARTICLE : Bullish Action Led to +54% Rally Since First Featured - 3/17/2017 |
View all notes |
Set NEW NOTE alert |
Company Profile |
SEC
News |
Chart |
Request a new note
C
A
S
I |
SIRI
-
NASDAQ
Sirius X M Holdings Inc
MEDIA - Broadcasting - Radio
|
$5.15
|
-0.06
-1.15% |
$5.22
|
13,464,358
57.47% of 50 DAV
50 DAV is 23,427,000
|
$5.53
-6.87%
|
3/13/2017
|
$5.48
|
PP = $5.32
|
|
MB = $5.59
|
Most Recent Note - 3/30/2017 5:18:36 PM
Y - Below average volume was behind today's 4th consecutive gain. Volume totals have been cooling since its powerful breakout, but its slump into the previous short base raised concerns. Disciplined investors always limit losses by selling any stock that falls more than -7% from their purchase price. First highlighted in the 3/13/17 mid-day report (read here) in yellow with pivot point cited based on its 2/22/17 high plus 10 cents.
>>> FEATURED STOCK ARTICLE : Breakout From Advanced Base Pattern Backed By Very Heavy Volume - 3/13/2017 |
View all notes |
Set NEW NOTE alert |
Company Profile |
SEC
News |
Chart |
Request a new note
C
A
S
I |
BEAT
-
NASDAQ
BioTelemetry Inc
Medical-Services
|
$28.95
|
-0.10
-0.34% |
$29.23
|
248,878
69.71% of 50 DAV
50 DAV is 357,000
|
$29.50
-1.86%
|
2/14/2017
|
$25.10
|
PP = $24.55
|
|
MB = $25.78
|
Most Recent Note - 3/29/2017 12:18:46 PM
G - Powering further into new all-time high territory with a streak of volume-driven gains, getting more extended from its prior base. Disciplined investors avoid chasing extended stocks. Prior highs in the $24 area and its 50 DMA line ($25.09) define important near-term support to watch.
>>> FEATURED STOCK ARTICLE : Perched Near All-Time High With Earnings Report Due - 2/21/2017 |
View all notes |
Set NEW NOTE alert |
Company Profile |
SEC
News |
Chart |
Request a new note
C
A
S
I |
ULTA
-
NASDAQ
Ulta Beauty Inc
SPECIALTY RETAIL - Specialty Retail, Other
|
$285.23
|
-0.28
-0.10% |
$285.96
|
428,312
62.80% of 50 DAV
50 DAV is 682,000
|
$289.27
-1.40%
|
3/6/2017
|
$274.96
|
PP = $278.73
|
|
MB = $292.67
|
Most Recent Note - 3/28/2017 5:18:20 PM
Y - Consolidating with lighter volume totals. Prior highs in the $278 area define support along with its 50 DMA line ($275). Subsequent losses leading to violations would raise concerns and trigger technical sell signals.
>>> FEATURED STOCK ARTICLE : Earnings News Due as Good Looking Candidate Hovers Near Highs - 3/6/2017 |
View all notes |
Set NEW NOTE alert |
Company Profile |
SEC
News |
Chart |
Request a new note
C
A
S
I |
ESNT
-
NYSE
Essent Group Ltd
Finance-MrtgandRel Svc
|
$36.17
|
+0.16
0.44% |
$36.48
|
825,511
120.51% of 50 DAV
50 DAV is 685,000
|
$38.10
-5.07%
|
1/25/2017
|
$34.09
|
PP = $34.04
|
|
MB = $35.74
|
Most Recent Note - 3/28/2017 5:13:32 PM
Y - Finished at the session high and near its "max buy" level with higher (near average) volume behind today's gain. Its 50 DMA line ($35.05) defines important near-term support above prior highs in the $33-34 area. Subsequent losses leading to violations may trigger technical sell signals.
>>> FEATURED STOCK ARTICLE : Consolidating Above Support Following Breakout - 3/10/2017 |
View all notes |
Set NEW NOTE alert |
Company Profile |
SEC
News |
Chart |
Request a new note
C
A
S
I |
Symbol/Exchange
Company Name
Industry Group |
PRICE |
CHANGE
(%Change) |
Day High |
Volume
(% DAV)
(% 50 day avg vol) |
52 Wk Hi
% From Hi |
Featured
Date |
Price
Featured |
Pivot Featured |
|
Max Buy |
VEEV
-
NYSE
Veeva Systems Inc Cl A
Computer Sftwr-Medical
|
$51.28
|
+0.43
0.85% |
$51.67
|
923,654
80.11% of 50 DAV
50 DAV is 1,153,000
|
$51.48
-0.39%
|
3/16/2017
|
$49.00
|
PP = $48.05
|
|
MB = $50.45
|
Most Recent Note - 3/27/2017 1:00:12 PM
Y - After a noted spurt of volume-driven gains it is still stubbornly holding its ground perched near its "max buy" level and near all-time highs. Prior highs in the $47-48 area define initial support to watch on pullbacks.
>>> FEATURED STOCK ARTICLE : Breakout Gain for New Highs Backed by Three Times Average Volume - 3/16/2017 |
View all notes |
Set NEW NOTE alert |
Company Profile |
SEC
News |
Chart |
Request a new note
C
A
S
I |
ANET
-
NYSE
Arista Networks Inc
TELECOMMUNICATIONS - Communication Equipment
|
$132.27
|
-0.54
-0.41% |
$133.15
|
737,668
90.29% of 50 DAV
50 DAV is 817,000
|
$134.65
-1.77%
|
3/6/2017
|
$119.43
|
PP = $123.22
|
|
MB = $129.38
|
Most Recent Note - 3/28/2017 5:20:33 PM
G - Hit another new high with below average volume behind today's 3rd consecutive gain, getting more extended from any sound base. Disciplined investors avoid chasing extended stocks.
>>> FEATURED STOCK ARTICLE : Stubbornly Holding Ground After Breakaway Gap - 3/1/2017 |
View all notes |
Set NEW NOTE alert |
Company Profile |
SEC
News |
Chart |
Request a new note
C
A
S
I |
VBTX
-
NASDAQ
Veritex Holdings Inc
BANKING - Regional - Southwest Banks
|
$28.12
|
-0.25
-0.88% |
$28.49
|
53,566
58.86% of 50 DAV
50 DAV is 91,000
|
$29.43
-4.45%
|
1/23/2017
|
$27.30
|
PP = $27.87
|
|
MB = $29.26
|
Most Recent Note - 3/29/2017 5:08:48 PM
G - Retreated today on lighter volume and closed near its 50 DMA line. Subsequent losses below the prior low ($26.82 on 3/10/17) would raise more serious concerns and trigger a worrisome technical sell signal.
>>> FEATURED STOCK ARTICLE : Hovering Near Highs But Latest Earnings Were Below Guidelines - 3/8/2017 |
View all notes |
Set NEW NOTE alert |
Company Profile |
SEC
News |
Chart |
Request a new note
C
A
S
I |
IBP
-
NYSE
Installed Building Prod
DIVERSIFIED SERVICES - Business/Management Services
|
$52.75
|
+0.50
0.96% |
$53.00
|
130,447
81.53% of 50 DAV
50 DAV is 160,000
|
$52.70
0.09%
|
2/27/2017
|
$44.83
|
PP = $44.40
|
|
MB = $46.62
|
Most Recent Note - 3/28/2017 5:15:16 PM
G - Hovering near its all-time high, very extended from its prior base following an impressive streak of volume-driven gains. Its 50 DMA line and prior highs in the $44 area define support to watch.
>>> FEATURED STOCK ARTICLE : Big Breakout Followed Solid Earnings News - 2/28/2017 |
View all notes |
Set NEW NOTE alert |
Company Profile |
SEC
News |
Chart |
Request a new note
C
A
S
I |
INGN
-
NASDAQ
Inogen Inc
HEALTH SERVICES - Medical Instruments and Supplies
|
$77.56
|
+0.55
0.71% |
$78.65
|
166,374
101.45% of 50 DAV
50 DAV is 164,000
|
$79.94
-2.98%
|
2/27/2017
|
$68.69
|
PP = $69.94
|
|
MB = $73.44
|
 Most Recent Note - 3/31/2017 5:01:58 PM
G - Traded average volume while inching to a best-ever close, extended from its prior base. Its 50 DMA line ($70.27) and prior highs in the $69 area define important near-term support to watch. See the latest FSU analysis for more details and a new annotated graph.
>>> FEATURED STOCK ARTICLE : Best Ever Close For High-Ranked Medical Product Maker - 3/31/2017 |
View all notes |
Set NEW NOTE alert |
Company Profile |
SEC
News |
Chart |
Request a new note
C
A
S
I |
Symbol/Exchange
Company Name
Industry Group |
PRICE |
CHANGE
(%Change) |
Day High |
Volume
(% DAV)
(% 50 day avg vol) |
52 Wk Hi
% From Hi |
Featured
Date |
Price
Featured |
Pivot Featured |
|
Max Buy |
PLAY
-
NASDAQ
Dave & Busters Ent Inc
Retail-Restaurants
|
$61.09
|
-0.79
-1.28% |
$61.88
|
1,043,819
132.30% of 50 DAV
50 DAV is 789,000
|
$63.12
-3.22%
|
2/23/2017
|
$55.41
|
PP = $58.35
|
|
MB = $61.27
|
Most Recent Note - 3/31/2017 12:58:41 PM
G - Color code was changed to green after rallying above its "max buy" level with volume-driven gains for new all-time highs. Reported earnings +19% on +15% sales revenues for the Jan '17 quarter, below the +25% minimum guideline (C criteria). Its 50 DMA line ($57.32) defines near-term support to watch. See the latest FSU analysis for more details and an annotated graph.
>>> FEATURED STOCK ARTICLE : Retreated From All-Time High Following Earnings Report - 3/29/2017 |
View all notes |
Set NEW NOTE alert |
Company Profile |
SEC
News |
Chart |
Request a new note
C
A
S
I |
OLLI
-
NASDAQ
Ollies Bargain Outlet
Retail-DiscountandVariety
|
$33.50
|
-0.50
-1.47% |
$34.25
|
620,347
110.97% of 50 DAV
50 DAV is 559,000
|
$35.80
-6.42%
|
3/27/2017
|
$32.80
|
PP = $33.55
|
|
MB = $35.23
|
Most Recent Note - 3/30/2017 1:05:35 PM
Y - Perched at its all-time high today while on track for a 4th consecutive volume-driven gain. Reported earnings +22% on +16% sales revenues for the Jan '17 quarter, below the +25% minimum earnings guideline (C criteria). OLLI was highlighted in yellow with new pivot point cited based on its 2/21/17 high plus 10 cents in the 3/27/17 mid-day report (read here) and it was recently noted - "A volume-driven gain for new highs may trigger a technical buy signal. Due to report Jan '17 quarterly results on Tuesday, March 28, 2017 after the market closes. Volume and volatility often increase near earnings news. Found support near its 50 DMA line ($31.68) during its orderly consolidation. Fundamentals remain strong and its Relative Strength rating has improved to 86. See the latest FSU analysis for more details and an annotated graph."
>>> FEATURED STOCK ARTICLE : No Resistance Remains and Earnings News is Due - 3/27/2017 |
View all notes |
Set NEW NOTE alert |
Company Profile |
SEC
News |
Chart |
Request a new note
C
A
S
I |
LITE
-
NASDAQ
Lumentum Holdings Inc
TELECOMMUNICATIONS - Cables / Satalite Equipment
|
$53.35
|
-0.35
-0.65% |
$53.65
|
1,100,411
60.70% of 50 DAV
50 DAV is 1,813,000
|
$55.92
-4.60%
|
2/8/2017
|
$44.60
|
PP = $44.80
|
|
MB = $47.04
|
Most Recent Note - 3/29/2017 12:49:03 PM
G - Perched at its all-time high following a streak of gains. Recently noted - "A valid 'secondary buy point' exists up to +5% above the prior high ($53.70 X 1.05 = $56.38) after finding support at the 10 WMA line following a recent breakout. Found prompt support near prior highs in the $44-45 area and stayed well above its 50 DMA line ($43)."
>>> FEATURED STOCK ARTICLE : Support Elusive Following Prior Demand - 3/14/2017 |
View all notes |
Set NEW NOTE alert |
Company Profile |
SEC
News |
Chart |
Request a new note
C
A
S
I |
MOMO
-
NASDAQ
Momo Inc Ads Cl A
INTERNET - Content
|
$34.07
|
-1.45
-4.08% |
$35.25
|
10,469,723
261.42% of 50 DAV
50 DAV is 4,005,000
|
$36.18
-5.83%
|
3/7/2017
|
$29.71
|
PP = $27.83
|
|
MB = $29.22
|
Most Recent Note - 3/31/2017 12:57:15 PM
G - Retreating from a new all-time high hit on the prior session with a loss today on higher volume. It is extended from the previously noted base. Prior highs in the $27-28 area and its 50 DMA line coincide defining important support to watch on pullbacks.
>>> FEATURED STOCK ARTICLE : Breakaway Gap Followed Very Strong Earnings Report - 3/7/2017 |
View all notes |
Set NEW NOTE alert |
Company Profile |
SEC
News |
Chart |
Request a new note
C
A
S
I |
|
|
|
THESE ARE NOT BUY RECOMMENDATIONS!
Comments contained in the body of this report are technical
opinions only. The material herein has been obtained
from sources believed to be reliable and accurate, however,
its accuracy and completeness cannot be guaranteed.
This site is not an investment advisor, hence it does
not endorse or recommend any securities or other investments.
Any recommendation contained in this report may not
be suitable for all investors and it is not to be deemed
an offer or solicitation on our part with respect to
the purchase or sale of any securities. All trademarks,
service marks and trade names appearing in this report
are the property of their respective owners, and are
likewise used for identification purposes only.
This report is a service available
only to active Paid Premium Members.
You may opt-out of receiving report notifications
at any time. Questions or comments may be submitted
by writing to Premium Membership Services 665 S.E. 10 Street, Suite 201 Deerfield Beach, FL 33441-5634 or by calling 1-800-965-8307
or 954-785-1121.
|
|
|