You are not logged in.
This means you
CAN ONLY VIEW reports that were published prior to Thursday, April 10, 2025.
You
MUST UPGRADE YOUR MEMBERSHIP if you want to see any current reports.
AFTER MARKET UPDATE - TUESDAY, APRIL 4TH, 2017
Previous After Market Report Next After Market Report >>>
|
|
|
|
DOW |
+39.03 |
20,689.24 |
+0.19% |
|
Volume |
982,070,190 |
-17% |
|
Volume |
1,637,101,620 |
-3% |
|
NASDAQ |
+3.93 |
5,898.61 |
+0.07% |
|
Advancers |
1,449 |
50% |
|
Advancers |
1,171 |
41% |
|
S&P 500 |
+1.32 |
2,360.16 |
+0.06% |
|
Decliners |
1,445 |
50% |
|
Decliners |
1,652 |
58% |
|
Russell 2000 |
-1.49 |
1,368.18 |
-0.11% |
|
52 Wk Highs |
65 |
|
|
52 Wk Highs |
46 |
|
|
S&P 600 |
+0.42 |
828.79 |
+0.05% |
|
52 Wk Lows |
27 |
|
|
52 Wk Lows |
43 |
|
|
 |
Waning Leadership a Concern as Major Indices Sputter
Kenneth J. Gruneisen - Passed the CAN SLIM® Master's Exam
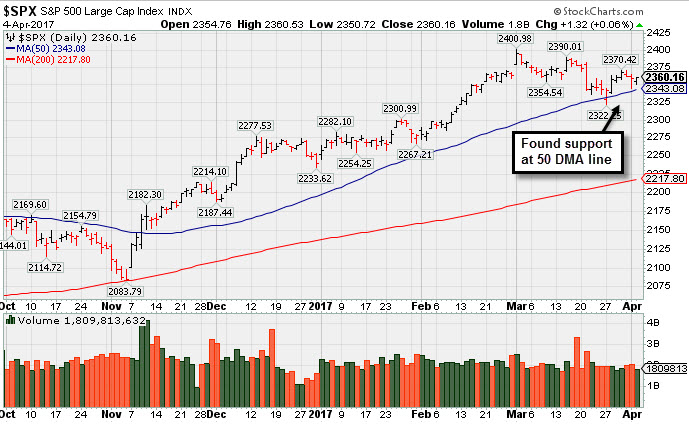
Stocks finished little changed on Tuesday. The Dow was up 39 points to 20689. The S&P 500 added a point to 2360 and the Nasdaq Composite gained 3 points to 5898. The volume totals reported were lighter than the prior session totals on the NYSE and on the Nasdaq exchange. Breadth was even on the NYSE, meanwhile decliners led advancers by a 4-3 margin on the Nasdaq exchange. Leadership waned as there were 12 high-ranked companies from the Leaders List that made new 52-week highs and were listed on the BreakOuts Page, less than half the total of 26 on the prior session. New 52-week highs totals contracted yet still outnumbered new 52-week lows on both the Nasdaq exchange and the NYSE.
PICTURED: The benchmark S&P 500 Index found support at its 50-day moving average (DMA) line during its recent consolidation. Subsequent losses leading to a 50 DMA line violation would raise concerns regarding the market rally's health.
Leadership has been thinning again with respect to the number of high-ranked stocks hitting new highs, and the major averages' (M criteria) uptrend recently came under pressure. New buying efforts should only be made in candidates with superior fundamental and technical characteristics. The Featured Stocks Page lists noteworthy high-ranked leaders.
The major averages fluctuated in a choppy session as investors digested economic releases and commentary from President Donald Trump. On Tuesday, President Trump stated his administration will make it easier for banks to lend money, saying they will do a “massive haircut” to the Dodd-Frank legislation. On the data front, factory orders rose 1% in February, in-line with expectations. Separately, durable goods orders increased 1.8%, above analyst estimates of a 1.7% gain.
Five of 11 sectors in the S&P 500 declined with Financials finishing lower despite President Trump’s hints at deregulation for banks. Shares of Bank of America (BAC -0.64%) fell after being the subject of negative analyst commentary. In earnings, Acuity Brands (AYI -14.77%) declined as the company reported weaker-than-expected quarterly sales. AmTrust Financial (AFSI +20.11%) rose after filing delayed 10-K with restated 2014-2015 results. In M&A news, Kate Spade (KATE -14.65%) slid amid reports the handbag maker needs more time to evaluate a buyout bid from Coach (COH -2.61%). Staples (SPLS +9.82%) rallied with news the company is exploring a possible sale.
Treasuries declined with the benchmark 10-year note down 10/32 to yield 2.36%. In commodities, NYMEX WTI crude added 1.6% to $51.04/barrel. COMEX gold gained 0.3% to $1255.00/ounce. |
 Kenneth J. Gruneisen started out as a licensed stockbroker in August 1987, a couple of months prior to the historic stock market crash that took the Dow Jones Industrial Average down -22.6% in a single day. He has published daily fact-based fundamental and technical analysis on high-ranked stocks online for two decades. Through FACTBASEDINVESTING.COM, Kenneth provides educational articles, news, market commentary, and other information regarding proven investment systems that work in good times and bad.
Comments contained in the body of this report are technical opinions only and are not necessarily those of Gruneisen Growth Corp. The material herein has been obtained from sources believed to be reliable and accurate, however, its accuracy and completeness cannot be guaranteed. Our firm, employees, and customers may effect transactions, including transactions contrary to any recommendation herein, or have positions in the securities mentioned herein or options with respect thereto. Any recommendation contained in this report may not be suitable for all investors and it is not to be deemed an offer or solicitation on our part with respect to the purchase or sale of any securities. |
|
 |
Commodity-Linked Groups Led Gainers
Kenneth J. Gruneisen - Passed the CAN SLIM® Master's Exam
The Bank Index ($BKX -0.29%) and the Broker/Dealer Index ($XBD -0.77%) both fell while the Retail Index ($RLX -0.01%) finished flat on Tuesday. The Gold & Silver Index ($XAU +1.15%) was a standout gainer, meanwhile, the Oil Services Index ($OSX +0.77%) and the Integrated Oil Index ($XOI +0.79%) both posted smaller gains. The tech sector saw small losses from the Networking Index ($NWX -0.22%) and the Semiconductor Index ($SOX -0.35%) while the Biotechnology Index ($BTK +0.04%) finished flat. Charts courtesy www.stockcharts.com
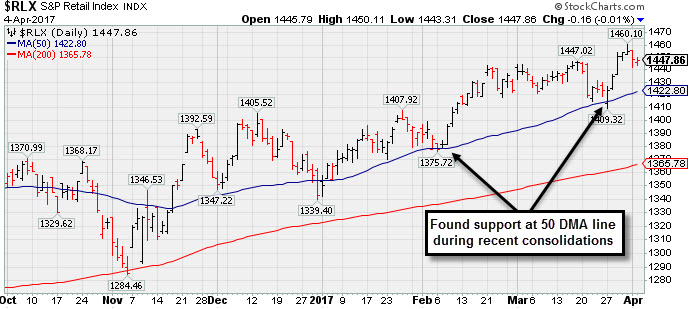 PICTURED: The Retail Index ($RLX -0.01%) found support near its 50-day moving average (DMA) line during recent consolidations.
| Oil Services |
$OSX |
169.23 |
+1.29 |
+0.77% |
-7.92% |
| Integrated Oil |
$XOI |
1,186.96 |
+9.28 |
+0.79% |
-6.39% |
| Semiconductor |
$SOX |
1,000.48 |
-5.32 |
-0.53% |
+10.37% |
| Networking |
$NWX |
447.66 |
-1.01 |
-0.22% |
+0.35% |
| Broker/Dealer |
$XBD |
212.27 |
-1.66 |
-0.77% |
+3.41% |
| Retail |
$RLX |
1,447.86 |
-0.16 |
-0.01% |
+7.81% |
| Gold & Silver |
$XAU |
86.28 |
+0.98 |
+1.15% |
+9.41% |
| Bank |
$BKX |
91.57 |
-0.26 |
-0.28% |
-0.24% |
| Biotech |
$BTK |
3,520.34 |
+1.47 |
+0.04% |
+14.48% |
|
|
|
 |
Hovering Near All-Time High Following Volume-Driven Gains
Kenneth J. Gruneisen - Passed the CAN SLIM® Master's Exam
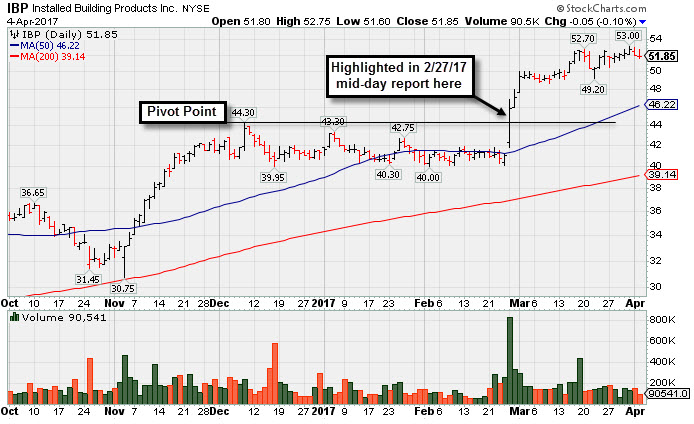
Installed Building Products' (IBP -$0.05 or -0.10% to $51.85) is hovering near its all-time high, very extended from its prior base following impressive volume-driven gains. No resistance remains due to overhead supply. Its 50-day moving average (DMA) line ($46.22) and prior highs in the $44 area define near-term support to watch on pullbacks.
IBP was last shown in this FSU section on 2/28/17 with an annotated graph under the headline, "Big Breakout Followed Solid Earnings News", after rallying above its "max buy" level. It was highlighted in the 2/27/17 mid-day report in yellow with pivot point cited based on its 12/08/16 high plus 10 cents (read here). Disciplined investors avoid chasing stocks extended more than 5% above prior highs.
The high-ranked Building - Maintenance & Service firm reported earnings +29% on +22% sales revenues for the Dec '16 quarter, and 3 of the 4 prior quarterly comparisons had earnings increases well above the +25% minimum guideline (C criteria). Its annual earnings (A criteria) history has been strong since its $11 IPO on 2/13/14.
The number of top-rated funds owning its shares rose from 226 in Mar '16 to 275 in Dec '16, a reassuring sign concerning the I criteria. Its small supply of only 31.8 million shares outstanding (S criteria) can contribute to greater price volatility in the event of institutional buying or selling. It currently has a Timeliness Rating of A and a Sponsorship Rating of B.
|
|
|
Color Codes Explained :
Y - Better candidates highlighted by our
staff of experts.
G - Previously featured
in past reports as yellow but may no longer be buyable under the
guidelines.
***Last / Change / Volume data in this table is the closing quote data***
Symbol/Exchange
Company Name
Industry Group |
PRICE |
CHANGE
(%Change) |
Day High |
Volume
(% DAV)
(% 50 day avg vol) |
52 Wk Hi
% From Hi |
Featured
Date |
Price
Featured |
Pivot Featured |
|
Max Buy |
SBCF
-
NASDAQ
Seacoast Banking Corp Fl
BANKING - Regional - Mid-Atlantic Banks
|
$23.77
|
-0.14
-0.59% |
$23.95
|
245,477
57.49% of 50 DAV
50 DAV is 427,000
|
$25.13
-5.41%
|
2/13/2017
|
$24.84
|
PP = $23.10
|
|
MB = $24.26
|
Most Recent Note - 3/30/2017 5:20:22 PM
Y - Finished near the session high with below average volume behind today's gain for its 2nd best close ever. Subsequent deterioration below the 50 DMA line and recent low ($21.89 on 3/22/17) would raise more serious concerns and trigger worrisome technical sell signals. See the latest FSU analysis for more details and an annotated graph.
>>> FEATURED STOCK ARTICLE : Rebound After Slump Below 50-Day Average Into Prior Base - 3/28/2017 |
View all notes |
Set NEW NOTE alert |
Company Profile |
SEC
News |
Chart |
Request a new note
C
A
S
I |
CSFL
-
NASDAQ
Centerstate Banks Inc
Banks-Southeast
|
$25.32
|
-0.31
-1.21% |
$25.67
|
210,385
69.43% of 50 DAV
50 DAV is 303,000
|
$26.94
-6.00%
|
3/13/2017
|
$25.54
|
PP = $26.40
|
|
MB = $27.72
|
Most Recent Note - 3/30/2017 5:23:18 PM
Y - Rose near prior highs with today's 3rd consecutive gain after finding prompt support near its 50 DMA line and its color code is changed to yellow. Subsequent losses below its recent low ($23.70 on 3/27/17) would raise greater concerns.
>>> FEATURED STOCK ARTICLE : Gain Backed By Volume For Best Ever Close - 3/15/2017 |
View all notes |
Set NEW NOTE alert |
Company Profile |
SEC
News |
Chart |
Request a new note
C
A
S
I |
NSP
-
NYSE
Insperity Inc
Comml Svcs-Outsourcing
|
$85.65
|
+0.65
0.76% |
$85.95
|
108,619
68.31% of 50 DAV
50 DAV is 159,000
|
$90.55
-5.41%
|
2/14/2017
|
$84.30
|
PP = $82.28
|
|
MB = $86.39
|
Most Recent Note - 4/3/2017 5:49:03 PM
Y - Color code is changed to yellow after slumping to a close below its "max buy" level. Old highs the $82 area define support along with its 50 DMA line ($81.78).
>>> FEATURED STOCK ARTICLE : Ordinary Pullback From Highs With Lighter Volume - 3/22/2017 |
View all notes |
Set NEW NOTE alert |
Company Profile |
SEC
News |
Chart |
Request a new note
C
A
S
I |
EVR
-
NYSE
Evercore Partners Inc
FINANCIAL SERVICES - Investment Banking
|
$75.95
|
+0.05
0.07% |
$76.50
|
582,908
134.62% of 50 DAV
50 DAV is 433,000
|
$83.30
-8.82%
|
1/5/2017
|
$71.40
|
PP = $72.07
|
|
MB = $75.67
|
Most Recent Note - 3/30/2017 5:16:35 PM
G - Posted a gain today with higher volume but still below average volume. Halted its slide after triggering technical sell signals and undercutting the prior low ($74.75 on 2/08/17), but a rebound above the 50-day moving average (DMA) line ($78.86) is still needed for its outlook to improve. See the latest FSU analysis for more details and a new annotated graph.
>>> FEATURED STOCK ARTICLE : Outlook Hurt By 50-Day Moving Average Breach and Fundamentals - 3/30/2017 |
View all notes |
Set NEW NOTE alert |
Company Profile |
SEC
News |
Chart |
Request a new note
C
A
S
I |
NTES
-
NASDAQ
Netease Inc Adr
INTERNET - Internet Information Providers
|
$273.09
|
-12.13
-4.25% |
$286.30
|
1,647,712
144.54% of 50 DAV
50 DAV is 1,140,000
|
$308.66
-11.52%
|
2/10/2017
|
$259.30
|
PP = $272.68
|
|
MB = $286.31
|
 Most Recent Note - 4/4/2017 5:29:06 PM
G - Color code is changed to green after violating its 50 DMA line ($279.26) today with a volume-driven loss triggering a technical sell signal. Testing prior highs in the $272 area defining important chart support to watch.
>>> FEATURED STOCK ARTICLE : Consolidating in Tight Range Following Breakaway Gap - 3/23/2017 |
View all notes |
Set NEW NOTE alert |
Company Profile |
SEC
News |
Chart |
Request a new note
C
A
S
I |
Symbol/Exchange
Company Name
Industry Group |
PRICE |
CHANGE
(%Change) |
Day High |
Volume
(% DAV)
(% 50 day avg vol) |
52 Wk Hi
% From Hi |
Featured
Date |
Price
Featured |
Pivot Featured |
|
Max Buy |
HTHT
-
NASDAQ
China Lodging Group Ads
LEISURE - Lodging
|
$61.66
|
-0.38
-0.61% |
$62.77
|
58,244
39.35% of 50 DAV
50 DAV is 148,000
|
$64.32
-4.14%
|
9/29/2016
|
$46.12
|
PP = $47.82
|
|
MB = $50.21
|
Most Recent Note - 4/4/2017 5:35:32 PM
G - Pulled back for a 5th consecutive small loss on light volume, remaining very near its all-time highs with volume totals cooling, holding its ground following volume-driven gains, Previously noted with caution - "Reported earnings +0% on +4% sales revenues for the Dec '16 quarter versus the year ago period, marking a 2nd comparison below the +25% minimum earnings guideline (C criteria), and its waning sales revenues growth rate is also a concern." See the latest FSU analysis for more details and an annotated graph.
>>> FEATURED STOCK ARTICLE : Bullish Action Led to +54% Rally Since First Featured - 3/17/2017 |
View all notes |
Set NEW NOTE alert |
Company Profile |
SEC
News |
Chart |
Request a new note
C
A
S
I |
SIRI
-
NASDAQ
Sirius X M Holdings Inc
MEDIA - Broadcasting - Radio
|
$5.11
|
+0.01
0.12% |
$5.15
|
18,314,788
77.76% of 50 DAV
50 DAV is 23,552,000
|
$5.53
-7.67%
|
3/13/2017
|
$5.48
|
PP = $5.32
|
|
MB = $5.59
|
Most Recent Note - 3/30/2017 5:18:36 PM
Y - Below average volume was behind today's 4th consecutive gain. Volume totals have been cooling since its powerful breakout, but its slump into the previous short base raised concerns. Disciplined investors always limit losses by selling any stock that falls more than -7% from their purchase price. First highlighted in the 3/13/17 mid-day report (read here) in yellow with pivot point cited based on its 2/22/17 high plus 10 cents.
>>> FEATURED STOCK ARTICLE : Breakout From Advanced Base Pattern Backed By Very Heavy Volume - 3/13/2017 |
View all notes |
Set NEW NOTE alert |
Company Profile |
SEC
News |
Chart |
Request a new note
C
A
S
I |
BEAT
-
NASDAQ
BioTelemetry Inc
Medical-Services
|
$28.60
|
+0.25
0.88% |
$28.80
|
302,566
84.28% of 50 DAV
50 DAV is 359,000
|
$29.50
-3.05%
|
2/14/2017
|
$25.10
|
PP = $24.55
|
|
MB = $25.78
|
Most Recent Note - 4/3/2017 5:44:01 PM
G - Pulled back from its all-time high with a 3rd consecutive small loss on near average volume. Extended from its prior base, and disciplined investors avoid chasing extended stocks. Prior highs in the $24 area and its 50 DMA line define important near-term support to watch. See the latest FSU analysis for more details and a new annotated graph.
>>> FEATURED STOCK ARTICLE : Perched Near High, Extended From Prior Base - 4/3/2017 |
View all notes |
Set NEW NOTE alert |
Company Profile |
SEC
News |
Chart |
Request a new note
C
A
S
I |
ULTA
-
NASDAQ
Ulta Beauty Inc
SPECIALTY RETAIL - Specialty Retail, Other
|
$281.57
|
-0.46
-0.16% |
$284.04
|
397,317
58.95% of 50 DAV
50 DAV is 674,000
|
$289.27
-2.66%
|
3/6/2017
|
$274.96
|
PP = $278.73
|
|
MB = $292.67
|
Most Recent Note - 4/4/2017 5:47:27 PM
Y - Consolidating near its all-time high with volume totals cooling. Prior highs in the $278 area define support along with its 50 DMA line ($277). Subsequent losses leading to violations would raise concerns and trigger technical sell signals.
>>> FEATURED STOCK ARTICLE : Earnings News Due as Good Looking Candidate Hovers Near Highs - 3/6/2017 |
View all notes |
Set NEW NOTE alert |
Company Profile |
SEC
News |
Chart |
Request a new note
C
A
S
I |
ESNT
-
NYSE
Essent Group Ltd
Finance-MrtgandRel Svc
|
$36.38
|
+0.35
0.97% |
$36.48
|
401,004
57.29% of 50 DAV
50 DAV is 700,000
|
$38.10
-4.51%
|
4/4/2017
|
$36.38
|
PP = $36.81
|
|
MB = $38.65
|
Most Recent Note - 4/4/2017 5:44:39 PM
Y - New pivot point is cited based on its 3/16/17 high while it has formed a "double bottom" base over the past 8 weeks. Subsequent volume-driven gains above the pivot point may trigger a new (or add-on) technical buy signal. Its 50 DMA line and recent lows define important near-term support. Subsequent losses leading to violations may trigger technical sell signals.
>>> FEATURED STOCK ARTICLE : Consolidating Above Support Following Breakout - 3/10/2017 |
View all notes |
Set NEW NOTE alert |
Company Profile |
SEC
News |
Chart |
Request a new note
C
A
S
I |
Symbol/Exchange
Company Name
Industry Group |
PRICE |
CHANGE
(%Change) |
Day High |
Volume
(% DAV)
(% 50 day avg vol) |
52 Wk Hi
% From Hi |
Featured
Date |
Price
Featured |
Pivot Featured |
|
Max Buy |
VEEV
-
NYSE
Veeva Systems Inc Cl A
Computer Sftwr-Medical
|
$50.97
|
-0.36
-0.70% |
$51.71
|
852,310
72.60% of 50 DAV
50 DAV is 1,174,000
|
$51.90
-1.79%
|
3/16/2017
|
$49.00
|
PP = $48.05
|
|
MB = $50.45
|
Most Recent Note - 4/4/2017 5:37:06 PM
G - Color code is changed to green while quietly perched above its "max buy" level and near all-time highs. Prior highs in the $47-48 area define initial support to watch on pullbacks.
>>> FEATURED STOCK ARTICLE : Breakout Gain for New Highs Backed by Three Times Average Volume - 3/16/2017 |
View all notes |
Set NEW NOTE alert |
Company Profile |
SEC
News |
Chart |
Request a new note
C
A
S
I |
ANET
-
NYSE
Arista Networks Inc
TELECOMMUNICATIONS - Communication Equipment
|
$133.20
|
+1.50
1.14% |
$133.71
|
1,021,258
123.79% of 50 DAV
50 DAV is 825,000
|
$134.65
-1.08%
|
3/6/2017
|
$119.43
|
PP = $123.22
|
|
MB = $129.38
|
Most Recent Note - 4/4/2017 5:38:52 PM
G - Perched near its all-time highs and it rallied with above average volume behind today's gain, getting more extended from any sound base. Disciplined investors avoid chasing extended stocks.
>>> FEATURED STOCK ARTICLE : Stubbornly Holding Ground After Breakaway Gap - 3/1/2017 |
View all notes |
Set NEW NOTE alert |
Company Profile |
SEC
News |
Chart |
Request a new note
C
A
S
I |
VBTX
-
NASDAQ
Veritex Holdings Inc
BANKING - Regional - Southwest Banks
|
$27.59
|
-0.03
-0.11% |
$27.80
|
57,390
63.07% of 50 DAV
50 DAV is 91,000
|
$29.43
-6.25%
|
1/23/2017
|
$27.30
|
PP = $27.87
|
|
MB = $29.26
|
Most Recent Note - 4/3/2017 12:07:52 PM
G - Sputtering below its 50 DMA line ($28.10) with higher volume behind today's loss. Subsequent losses below the prior low ($26.82 on 3/10/17) would raise more serious concerns and trigger a worrisome technical sell signal.
>>> FEATURED STOCK ARTICLE : Hovering Near Highs But Latest Earnings Were Below Guidelines - 3/8/2017 |
View all notes |
Set NEW NOTE alert |
Company Profile |
SEC
News |
Chart |
Request a new note
C
A
S
I |
IBP
-
NYSE
Installed Building Prod
DIVERSIFIED SERVICES - Business/Management Services
|
$51.85
|
-0.05
-0.10% |
$52.75
|
90,541
56.24% of 50 DAV
50 DAV is 161,000
|
$53.00
-2.17%
|
2/27/2017
|
$44.83
|
PP = $44.40
|
|
MB = $46.62
|
Most Recent Note - 4/4/2017 5:46:03 PM
G - Quietly hovering near its all-time high, very extended from its prior base following an impressive streak of volume-driven gains. Its 50 DMA line and prior highs in the $44 area define support to watch. See the latest FSU analysis for more details and a new annotated graph.
>>> FEATURED STOCK ARTICLE : Hovering Near All-Time High Following Volume-Driven Gains - 4/4/2017 |
View all notes |
Set NEW NOTE alert |
Company Profile |
SEC
News |
Chart |
Request a new note
C
A
S
I |
INGN
-
NASDAQ
Inogen Inc
HEALTH SERVICES - Medical Instruments and Supplies
|
$76.72
|
-1.60
-2.04% |
$78.73
|
111,079
67.73% of 50 DAV
50 DAV is 164,000
|
$79.94
-4.03%
|
2/27/2017
|
$68.69
|
PP = $69.94
|
|
MB = $73.44
|
Most Recent Note - 4/4/2017 5:30:52 PM
G - Traded light volume today while remaining perched near its all-time high, extended from its prior base. Its 50 DMA line ($70.83) and prior highs in the $69 area define important near-term support to watch.
>>> FEATURED STOCK ARTICLE : Best Ever Close For High-Ranked Medical Product Maker - 3/31/2017 |
View all notes |
Set NEW NOTE alert |
Company Profile |
SEC
News |
Chart |
Request a new note
C
A
S
I |
Symbol/Exchange
Company Name
Industry Group |
PRICE |
CHANGE
(%Change) |
Day High |
Volume
(% DAV)
(% 50 day avg vol) |
52 Wk Hi
% From Hi |
Featured
Date |
Price
Featured |
Pivot Featured |
|
Max Buy |
PLAY
-
NASDAQ
Dave & Buster's Ent Inc
Retail-Restaurants
|
$60.19
|
-0.44
-0.73% |
$60.75
|
525,475
64.95% of 50 DAV
50 DAV is 809,000
|
$63.12
-4.64%
|
2/23/2017
|
$55.41
|
PP = $58.35
|
|
MB = $61.27
|
Most Recent Note - 3/31/2017 12:58:41 PM
G - Color code was changed to green after rallying above its "max buy" level with volume-driven gains for new all-time highs. Reported earnings +19% on +15% sales revenues for the Jan '17 quarter, below the +25% minimum guideline (C criteria). Its 50 DMA line ($57.32) defines near-term support to watch. See the latest FSU analysis for more details and an annotated graph.
>>> FEATURED STOCK ARTICLE : Retreated From All-Time High Following Earnings Report - 3/29/2017 |
View all notes |
Set NEW NOTE alert |
Company Profile |
SEC
News |
Chart |
Request a new note
C
A
S
I |
OLLI
-
NASDAQ
Ollie's Bargain Outlet
Retail-DiscountandVariety
|
$33.30
|
-0.05
-0.15% |
$33.70
|
413,750
73.88% of 50 DAV
50 DAV is 560,000
|
$35.80
-6.98%
|
3/27/2017
|
$32.80
|
PP = $33.55
|
|
MB = $35.23
|
Most Recent Note - 3/30/2017 1:05:35 PM
Y - Perched at its all-time high today while on track for a 4th consecutive volume-driven gain. Reported earnings +22% on +16% sales revenues for the Jan '17 quarter, below the +25% minimum earnings guideline (C criteria). OLLI was highlighted in yellow with new pivot point cited based on its 2/21/17 high plus 10 cents in the 3/27/17 mid-day report (read here) and it was recently noted - "A volume-driven gain for new highs may trigger a technical buy signal. Due to report Jan '17 quarterly results on Tuesday, March 28, 2017 after the market closes. Volume and volatility often increase near earnings news. Found support near its 50 DMA line ($31.68) during its orderly consolidation. Fundamentals remain strong and its Relative Strength rating has improved to 86. See the latest FSU analysis for more details and an annotated graph."
>>> FEATURED STOCK ARTICLE : No Resistance Remains and Earnings News is Due - 3/27/2017 |
View all notes |
Set NEW NOTE alert |
Company Profile |
SEC
News |
Chart |
Request a new note
C
A
S
I |
LITE
-
NASDAQ
Lumentum Holdings Inc
TELECOMMUNICATIONS - Cables / Satalite Equipment
|
$50.45
|
-1.05
-2.04% |
$52.00
|
1,530,901
83.75% of 50 DAV
50 DAV is 1,828,000
|
$55.92
-9.79%
|
2/8/2017
|
$44.60
|
PP = $44.80
|
|
MB = $47.04
|
Most Recent Note - 4/4/2017 5:32:13 PM
G - Quietly consolidating near its all-time high. Its 50 DMA line ($46.64) defines near-term support to watch.
>>> FEATURED STOCK ARTICLE : Support Elusive Following Prior Demand - 3/14/2017 |
View all notes |
Set NEW NOTE alert |
Company Profile |
SEC
News |
Chart |
Request a new note
C
A
S
I |
MOMO
-
NASDAQ
Momo Inc Ads Cl A
INTERNET - Content
|
$33.97
|
-0.87
-2.50% |
$34.84
|
2,666,034
62.42% of 50 DAV
50 DAV is 4,271,000
|
$36.18
-6.11%
|
3/7/2017
|
$29.71
|
PP = $27.83
|
|
MB = $29.22
|
Most Recent Note - 4/4/2017 5:33:49 PM
G - Pulled back today with lighter than average volume, remaining perched near its all-time high. It is extended from the previously noted base. Prior highs in the $27-28 area and its 50 DMA line coincide defining important support to watch.
>>> FEATURED STOCK ARTICLE : Breakaway Gap Followed Very Strong Earnings Report - 3/7/2017 |
View all notes |
Set NEW NOTE alert |
Company Profile |
SEC
News |
Chart |
Request a new note
C
A
S
I |
|
|
|
THESE ARE NOT BUY RECOMMENDATIONS!
Comments contained in the body of this report are technical
opinions only. The material herein has been obtained
from sources believed to be reliable and accurate, however,
its accuracy and completeness cannot be guaranteed.
This site is not an investment advisor, hence it does
not endorse or recommend any securities or other investments.
Any recommendation contained in this report may not
be suitable for all investors and it is not to be deemed
an offer or solicitation on our part with respect to
the purchase or sale of any securities. All trademarks,
service marks and trade names appearing in this report
are the property of their respective owners, and are
likewise used for identification purposes only.
This report is a service available
only to active Paid Premium Members.
You may opt-out of receiving report notifications
at any time. Questions or comments may be submitted
by writing to Premium Membership Services 665 S.E. 10 Street, Suite 201 Deerfield Beach, FL 33441-5634 or by calling 1-800-965-8307
or 954-785-1121.
|
|
|