***Last / Change / Volume data in this table is the closing quote data***
Symbol/Exchange
Company Name
Industry Group |
PRICE |
CHANGE
(%Change) |
Day High |
Volume
(% DAV)
(% 50 day avg vol) |
52 Wk Hi
% From Hi |
Featured
Date |
Price
Featured |
Pivot Featured |
|
Max Buy |
SBCF
-
NASDAQ
Seacoast Banking Corp Fl
BANKING - Regional - Mid-Atlantic Banks
|
$23.78
|
+0.02
0.08% |
$23.93
|
309,066
80.91% of 50 DAV
50 DAV is 382,000
|
$25.13
-5.37%
|
2/13/2017
|
$24.84
|
PP = $23.10
|
|
MB = $24.26
|
Most Recent Note - 3/6/2017 7:07:31 PM
Y - Still holding its ground above its pivot point, consolidating after its gap up and big volume-driven gain on 2/13/17 clinched a technical buy signal. Completed a new Public Offering on 2/15/17. Prior highs and its 50 DMA line in the $23 area define important near-term support to watch.
>>> FEATURED STOCK ARTICLE : Gap Up Gain and Strong Finish Triggered Technical Buy Signal - 2/13/2017 |
View all notes |
Set NEW NOTE alert |
Company Profile |
SEC
News |
Chart |
Request a new note
C
A
S
I |
CSFL
-
NASDAQ
Centerstate Banks Inc
Banks-Southeast
|
$25.37
|
+0.19
0.75% |
$25.42
|
348,282
125.73% of 50 DAV
50 DAV is 277,000
|
$26.30
-3.54%
|
10/10/2016
|
$18.20
|
PP = $18.37
|
|
MB = $19.29
|
Most Recent Note - 3/6/2017 6:54:39 PM
G - Consolidating above its 50 DMA line ($25). Recent low ($23.80 on 2/08/17) defines important near-term support where further deterioration would trigger a technical sell signal. Completed a new Public Offering of shares on 1/10/17.
>>> FEATURED STOCK ARTICLE : Found Support Near 50-Day Average Following Offering - 2/6/2017 |
View all notes |
Set NEW NOTE alert |
Company Profile |
SEC
News |
Chart |
Request a new note
C
A
S
I |
IESC
-
NASDAQ
Integrated Electric Svcs
Bldg-Maintenance and Svc
|
$19.05
|
+0.15
0.79% |
$19.15
|
46,523
87.45% of 50 DAV
50 DAV is 53,200
|
$23.00
-17.17%
|
11/23/2016
|
$19.35
|
PP = $18.26
|
|
MB = $19.17
|
Most Recent Note - 3/9/2017 1:51:10 PM
G - Still consolidating just below its 50 DMA line ($19.50) with volume totals cooling. Its Relative Strength rating of 66 is below the 80+ minimum guideline for buy candidates. Prior low ($18.05 on 1/18/17) defines important support near prior highs. Recently reported Dec '16 quarterly earnings -33% on +27% sales revenues, below the +25% minimum earnings guideline (C criteria), raising fundamental concerns.
>>> FEATURED STOCK ARTICLE : Recent Low Defines Support Near Prior Highs - 3/3/2017 |
View all notes |
Set NEW NOTE alert |
Company Profile |
SEC
News |
Chart |
Request a new note
C
A
S
I |
NSP
-
NYSE
Insperity Inc
Comml Svcs-Outsourcing
|
$88.80
|
+1.55
1.78% |
$88.95
|
122,705
80.20% of 50 DAV
50 DAV is 153,000
|
$88.50
0.34%
|
2/14/2017
|
$84.30
|
PP = $82.28
|
|
MB = $86.39
|
 Most Recent Note - 3/10/2017 4:15:14 PM
G - Wedged higher today and hit another new 52-week high with a gain lacking volume conviction, getting more more extended from prior highs. The recent low ($79.97 on 2/24/17) defines important near-term support.
>>> FEATURED STOCK ARTICLE : Big Volume-Driven Gains Indicative of Institutional Demand - 2/14/2017 |
View all notes |
Set NEW NOTE alert |
Company Profile |
SEC
News |
Chart |
Request a new note
C
A
S
I |
BERY
-
NYSE
Berry Plastics Group Inc
CONSUMER NON-DURABLES - Packaging and Containers
|
$49.91
|
+0.07
0.14% |
$50.29
|
804,043
67.40% of 50 DAV
50 DAV is 1,193,000
|
$52.97
-5.78%
|
11/30/2016
|
$50.26
|
PP = $46.47
|
|
MB = $48.79
|
Most Recent Note - 3/10/2017 3:46:16 PM
G - Relative Strength Rating is 84, above the 80+ minimum for buy candidates under the fact-based investment system, but it has recently been consolidating just below its 50 DMA line ($50.38). Recent lows in the $48.50 area define near-term support. Damaging losses and violations would trigger a more worrisome technical sell signal. Reported earnings +43% on -7% sales revenues for the Dec '16 quarter.
>>> FEATURED STOCK ARTICLE : Recent 50-Day Violation Raised Concerns - 2/7/2017 |
View all notes |
Set NEW NOTE alert |
Company Profile |
SEC
News |
Chart |
Request a new note
C
A
S
I |
Symbol/Exchange
Company Name
Industry Group |
PRICE |
CHANGE
(%Change) |
Day High |
Volume
(% DAV)
(% 50 day avg vol) |
52 Wk Hi
% From Hi |
Featured
Date |
Price
Featured |
Pivot Featured |
|
Max Buy |
EVR
-
NYSE
Evercore Partners Inc
FINANCIAL SERVICES - Investment Banking
|
$81.80
|
+0.45
0.55% |
$82.30
|
425,332
101.27% of 50 DAV
50 DAV is 420,000
|
$82.45
-0.79%
|
1/5/2017
|
$71.40
|
PP = $72.07
|
|
MB = $75.67
|
Most Recent Note - 3/6/2017 6:56:37 PM
G - Still holding its ground stubbornly, extended from its prior base. Its 50 DMA line and prior low ($74.75 on 2/08/17) define near-term support to watch. Recently reported Dec '16 quarterly earnings +17% on +9% sales revenues, below the +25% minimum earnings guideline (C criteria), raising fundamental concerns.
>>> FEATURED STOCK ARTICLE : Holding Ground After Latest Earnings Were Below +25% Guideline - 2/17/2017 |
View all notes |
Set NEW NOTE alert |
Company Profile |
SEC
News |
Chart |
Request a new note
C
A
S
I |
NTES
-
NASDAQ
Netease Inc Adr
INTERNET - Internet Information Providers
|
$289.40
|
-1.87
-0.64% |
$291.62
|
678,260
59.76% of 50 DAV
50 DAV is 1,135,000
|
$308.66
-6.24%
|
2/10/2017
|
$259.30
|
PP = $272.68
|
|
MB = $286.31
|
Most Recent Note - 3/8/2017 5:47:26 PM
G - Extended from its prior base and consolidating following a big "breakaway gap" on 2/16/17. Prior highs in the $272 area define initial support to watch above its 50 DMA line.
>>> FEATURED STOCK ARTICLE : Rebounding With Earnings News Due Soon - 2/10/2017 |
View all notes |
Set NEW NOTE alert |
Company Profile |
SEC
News |
Chart |
Request a new note
C
A
S
I |
STMP
-
NASDAQ
Stamps.com Inc
INTERNET - Internet Software and Services
|
$130.00
|
+1.10
0.85% |
$131.25
|
337,720
141.90% of 50 DAV
50 DAV is 238,000
|
$136.00
-4.41%
|
2/16/2017
|
$129.45
|
PP = $123.85
|
|
MB = $130.04
|
Most Recent Note - 3/8/2017 5:50:53 PM
Y - Found prompt support at its 50 DMA line ($122) and its color code is changed to yellow while consolidating above its pivot point yet below its "max buy" level. Deterioration below the recent low ($120.11 on 3/02/17) would trigger a more worrisome technical sell signal.
>>> FEATURED STOCK ARTICLE : Recent Gains Have Lacked Heavy Volume Indicative of Accumulation - 2/16/2017 |
View all notes |
Set NEW NOTE alert |
Company Profile |
SEC
News |
Chart |
Request a new note
C
A
S
I |
HTHT
-
NASDAQ
China Lodging Group Ads
LEISURE - Lodging
|
$58.00
|
+0.34
0.59% |
$58.49
|
70,718
55.25% of 50 DAV
50 DAV is 128,000
|
$60.92
-4.79%
|
9/29/2016
|
$46.12
|
PP = $47.82
|
|
MB = $50.21
|
Most Recent Note - 3/6/2017 6:58:53 PM
G - Pulled back from its all-time high with another loss today backed by above average volume. The recent low ($53.12 on 2/15/17) and its 50 DMA line ($53.12) coincide defining important near-term support to watch. Repeatedly noted with caution in prior reports - "Reported earnings +10% on +6% sales revenues for the Sep '16 quarter, below the +25% minimum earnings guideline (C criteria), raising concerns."
>>> FEATURED STOCK ARTICLE : Mostly Bullish Action Continues Since Latest Earnings Report - 2/9/2017 |
View all notes |
Set NEW NOTE alert |
Company Profile |
SEC
News |
Chart |
Request a new note
C
A
S
I |
BEAT
-
NASDAQ
BioTelemetry Inc
Medical-Services
|
$26.85
|
+0.60
2.29% |
$27.05
|
453,893
148.33% of 50 DAV
50 DAV is 306,000
|
$27.30
-1.65%
|
2/14/2017
|
$25.10
|
PP = $24.55
|
|
MB = $25.78
|
Most Recent Note - 3/10/2017 3:22:53 PM
G - Challenging prior highs with volume-driven gains. Prior highs in the $24 area and its 50 DMA line ($23.82) define important near-term support.
>>> FEATURED STOCK ARTICLE : Perched Near All-Time High With Earnings Report Due - 2/21/2017 |
View all notes |
Set NEW NOTE alert |
Company Profile |
SEC
News |
Chart |
Request a new note
C
A
S
I |
Symbol/Exchange
Company Name
Industry Group |
PRICE |
CHANGE
(%Change) |
Day High |
Volume
(% DAV)
(% 50 day avg vol) |
52 Wk Hi
% From Hi |
Featured
Date |
Price
Featured |
Pivot Featured |
|
Max Buy |
ULTA
-
NASDAQ
Ulta Beauty Inc
SPECIALTY RETAIL - Specialty Retail, Other
|
$286.42
|
+12.65
4.62% |
$287.19
|
4,571,259
773.48% of 50 DAV
50 DAV is 591,000
|
$281.17
1.87%
|
3/6/2017
|
$274.96
|
PP = $278.73
|
|
MB = $292.67
|
Most Recent Note - 3/10/2017 1:19:49 PM
Y - Reported earnings +33% on +25% sales revenues for the Jan '17 quarter. Hitting a new all-time high with today's volume-driven gain. Its 50 DMA line ($269.42) defines near term support to watch on pullbacks. Highlighted in yellow in the 3/06/17 mid-day report with new pivot point cited based on its 8/24/16 high plus 10 cents while noted - "A volume-driven gain for new highs may trigger a new technical buy signal. Prior earnings history satisfied the C and A criteria."
>>> FEATURED STOCK ARTICLE : Earnings News Due as Good Looking Candidate Hovers Near Highs - 3/6/2017 |
View all notes |
Set NEW NOTE alert |
Company Profile |
SEC
News |
Chart |
Request a new note
C
A
S
I |
ESNT
-
NYSE
Essent Group Ltd
Finance-MrtgandRel Svc
|
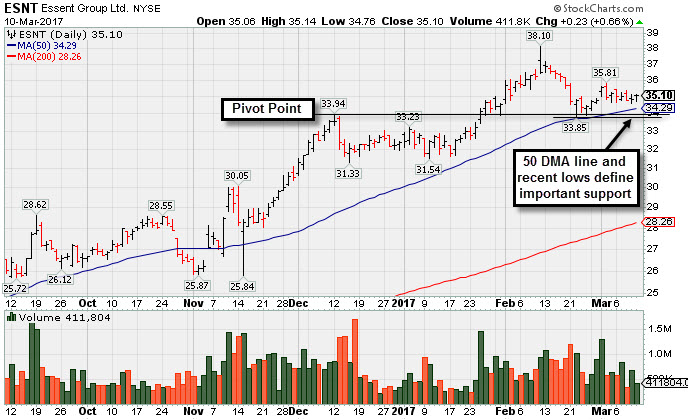
$35.10
|
+0.23
0.66% |
$35.14
|
411,804
64.55% of 50 DAV
50 DAV is 638,000
|
$38.10
-7.87%
|
1/25/2017
|
$34.09
|
PP = $34.04
|
|
MB = $35.74
|
Most Recent Note - 3/10/2017 4:44:08 PM
Y - Still consolidating below its "max buy" level, staying above its 50 DMA line and prior highs defining important near-term support in the $33-34 area. Subsequent losses leading to violations may trigger technical sell signals. See the latest FSU analysis for more details and a new annotated graph.
>>> FEATURED STOCK ARTICLE : Consolidating Above Support Following Breakout - 3/10/2017 |
View all notes |
Set NEW NOTE alert |
Company Profile |
SEC
News |
Chart |
Request a new note
C
A
S
I |
ANET
-
NYSE
Arista Networks Inc
TELECOMMUNICATIONS - Communication Equipment
|
$124.17
|
+1.08
0.88% |
$124.49
|
580,416
67.26% of 50 DAV
50 DAV is 863,000
|
$125.00
-0.66%
|
3/6/2017
|
$119.43
|
PP = $123.22
|
|
MB = $129.38
|
Most Recent Note - 3/8/2017 11:57:49 AM
Y - Touched a new high today then reversed into the red. Hovered near its all-time high and formed an advanced "3-weeks tight" base pattern while holding its ground stubbornly following a big "breakaway gap" on 2/17/17. Color code was changed to yellow with new pivot point cited based on its 2/21/17 high plus 10 cents. Subsequent volume-driven gains for new highs may trigger a new (or add-on) technical buy signal.
>>> FEATURED STOCK ARTICLE : Stubbornly Holding Ground After Breakaway Gap - 3/1/2017 |
View all notes |
Set NEW NOTE alert |
Company Profile |
SEC
News |
Chart |
Request a new note
C
A
S
I |
VBTX
-
NASDAQ
Veritex Holdings Inc
BANKING - Regional - Southwest Banks
|
$27.45
|
-0.44
-1.58% |
$28.25
|
122,493
140.80% of 50 DAV
50 DAV is 87,000
|
$29.43
-6.73%
|
1/23/2017
|
$27.30
|
PP = $27.87
|
|
MB = $29.26
|
Most Recent Note - 3/10/2017 3:20:39 PM
Y - Volume-driven losses are testing prior highs in the $27 area and its 50 DMA line ($27.56) defining important support. See the latest FSU analysis for more details and an annotated graph.
>>> FEATURED STOCK ARTICLE : Hovering Near Highs But Latest Earnings Were Below Guidelines - 3/8/2017 |
View all notes |
Set NEW NOTE alert |
Company Profile |
SEC
News |
Chart |
Request a new note
C
A
S
I |
IBP
-
NYSE
Installed Building Prod
DIVERSIFIED SERVICES - Business/Management Services
|
$49.65
|
+0.55
1.12% |
$50.00
|
146,675
97.14% of 50 DAV
50 DAV is 151,000
|
$50.05
-0.80%
|
2/27/2017
|
$44.83
|
PP = $44.40
|
|
MB = $46.62
|
Most Recent Note - 3/6/2017 7:00:23 PM
G - Stubbornly holding its ground after an impressive streak of volume-driven gains, very extended from its prior base. No resistance remains due to overhead supply. Prior highs in the $44 area define initial support to watch. First highlighted in the 2/27/17 mid-day report with pivot point cited based on its 12/08/16 high plus 10 cents (read here).
>>> FEATURED STOCK ARTICLE : Big Breakout Followed Solid Earnings News - 2/28/2017 |
View all notes |
Set NEW NOTE alert |
Company Profile |
SEC
News |
Chart |
Request a new note
C
A
S
I |
Symbol/Exchange
Company Name
Industry Group |
PRICE |
CHANGE
(%Change) |
Day High |
Volume
(% DAV)
(% 50 day avg vol) |
52 Wk Hi
% From Hi |
Featured
Date |
Price
Featured |
Pivot Featured |
|
Max Buy |
SFBS
-
NASDAQ
Servisfirst Bancshares
BANKING - Regional - Southeast Banks
|
$40.00
|
-0.20
-0.50% |
$40.43
|
189,276
110.69% of 50 DAV
50 DAV is 171,000
|
$42.66
-6.24%
|
7/19/2016
|
$26.64
|
PP = $26.41
|
|
MB = $27.73
|
Most Recent Note - 3/6/2017 7:08:39 PM
G - Still holding its ground stubbornly and perched near all-time highs. Recently reported earnings +8% on +20% sales revenues for the Dec '16 quarter, below the +25% minimum guideline (C criteria), raising fundamental concerns. Its 50 DMA line ($39.45) defines important near-term support where a subsequent violation would trigger a technical sell signal.
>>> FEATURED STOCK ARTICLE : Perched Near All-Time High After Concerns Raised by Latest Earnings - 2/22/2017 |
View all notes |
Set NEW NOTE alert |
Company Profile |
SEC
News |
Chart |
Request a new note
C
A
S
I |
INGN
-
NASDAQ
Inogen Inc
HEALTH SERVICES - Medical Instruments and Supplies
|
$71.43
|
+0.94
1.33% |
$71.86
|
173,213
117.04% of 50 DAV
50 DAV is 148,000
|
$79.94
-10.65%
|
2/27/2017
|
$68.69
|
PP = $69.94
|
|
MB = $73.44
|
Most Recent Note - 3/10/2017 4:12:55 PM
Y - Posted a gain today on near average volume. Stalled after its gap up for new all-time highs on 3/01/17. Consolidating above prior highs in the $69 area defining initial support to watch.
>>> FEATURED STOCK ARTICLE : Formed Orderly Base With Earnings News Due After Tuesday's Close - 2/27/2017 |
View all notes |
Set NEW NOTE alert |
Company Profile |
SEC
News |
Chart |
Request a new note
C
A
S
I |
PLAY
-
NASDAQ
Dave & Buster's Ent Inc
Retail-Restaurants
|
$59.62
|
+1.06
1.81% |
$60.50
|
1,336,434
231.22% of 50 DAV
50 DAV is 578,000
|
$59.63
-0.02%
|
2/23/2017
|
$55.41
|
PP = $58.35
|
|
MB = $61.27
|
Most Recent Note - 3/10/2017 12:58:48 PM
Y - Hitting a new high with today's 2nd consecutive volume-driven gain. Its 50 DMA line ($56) has recently acted as a support level. Gains had lacked great volume conviction since first highlighted in yellow in the 2/23/17 mid-day report (read here).
>>> FEATURED STOCK ARTICLE : Consolidating Near 50 DMA After Recent Gains Lacked Volume - 2/23/2017 |
View all notes |
Set NEW NOTE alert |
Company Profile |
SEC
News |
Chart |
Request a new note
C
A
S
I |
LITE
-
NASDAQ
Lumentum Holdings Inc
TELECOMMUNICATIONS - Cables / Satalite Equipment
|
$45.80
|
-0.05
-0.11% |
$46.95
|
2,526,112
174.94% of 50 DAV
50 DAV is 1,444,000
|
$53.70
-14.70%
|
2/8/2017
|
$44.60
|
PP = $44.80
|
|
MB = $47.04
|
Most Recent Note - 3/10/2017 4:11:27 PM
Y - Holding its ground near prior highs in the $44-45 area previously noted as important support to watch. Subsequent damaging losses would raise concerns and trigger a technical sell signal.
>>> FEATURED STOCK ARTICLE : Gap Up Gain and Strong Finish Triggered Technical Buy Signal - 2/8/2017 |
View all notes |
Set NEW NOTE alert |
Company Profile |
SEC
News |
Chart |
Request a new note
C
A
S
I |
MOMO
-
NASDAQ
Momo Inc Ads Cl A
INTERNET - Content
|
$30.78
|
+0.73
2.43% |
$31.59
|
6,977,182
248.83% of 50 DAV
50 DAV is 2,804,000
|
$34.35
-10.39%
|
3/7/2017
|
$29.71
|
PP = $27.83
|
|
MB = $29.22
|
Most Recent Note - 3/10/2017 12:33:15 PM
G - Extended from prior highs following a "breakaway gap" on 3/07/17 that cleared a cup-with-handle base. Prior highs in the $27-28 area define initial support to watch on pullbacks. See the latest FSU analysis for more details and an annotated graph.
>>> FEATURED STOCK ARTICLE : Breakaway Gap Followed Very Strong Earnings Report - 3/7/2017 |
View all notes |
Set NEW NOTE alert |
Company Profile |
SEC
News |
Chart |
Request a new note
C
A
S
I |
Symbol/Exchange
Company Name
Industry Group |
PRICE |
CHANGE
(%Change) |
Day High |
Volume
(% DAV)
(% 50 day avg vol) |
52 Wk Hi
% From Hi |
Featured
Date |
Price
Featured |
Pivot Featured |
|
Max Buy |