You are not logged in.
This means you
CAN ONLY VIEW reports that were published prior to Sunday, April 6, 2025.
You
MUST UPGRADE YOUR MEMBERSHIP if you want to see any current reports.
AFTER MARKET UPDATE - TUESDAY, DECEMBER 7TH, 2021
Previous After Market Report Next After Market Report >>>
|
|
|
|
DOW |
+492.40 |
35,719.43 |
+1.40% |
|
Volume |
1,017,737,217 |
-3% |
|
Volume |
5,030,546,800 |
-1% |
|
NASDAQ |
+461.76 |
15,686.92 |
+3.03% |
|
Advancers |
2,590 |
79% |
|
Advancers |
3,439 |
75% |
|
S&P 500 |
+95.08 |
4,686.75 |
+2.07% |
|
Decliners |
690 |
21% |
|
Decliners |
1,116 |
24% |
|
Russell 2000 |
+50.31 |
2,253.79 |
+2.28% |
|
52 Wk Highs |
90 |
|
|
52 Wk Highs |
72 |
|
|
S&P 600 |
+19.86 |
1,394.02 |
+1.45% |
|
52 Wk Lows |
23 |
|
|
52 Wk Lows |
66 |
|
|
Concerns have grown as the major indices are now in a market correction (M criteria). Disciplined investors know to preserve capital by following sell rules designed to lock in gains and limit losses. New buying efforts should be avoided until a new confirmed rally is noted marked by a solid follow-through day.
|
 |
Indices' Rise on Lighter Volume Shows Tame Institutional Buying
Kenneth J. Gruneisen - Passed the CAN SLIM® Master's Exam
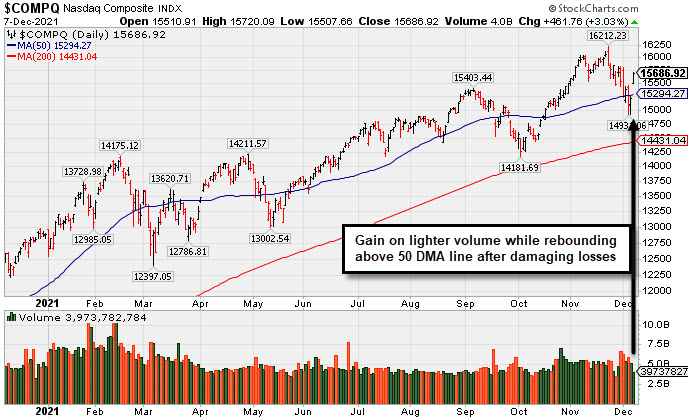
The Dow climbed 492 points, notching its largest two-day advance since November 2020 (+3.3%). The S&P 500 jumped 2.1%, while the Nasdaq Composite rallied 3%, with both benchmarks logging their best daily performances since the beginning of March amid strength in tech shares. The small-cap Russell 2000 added 1.9%. The volume totals were reported lower than the prior session on the NYSE and on the Nasdaq exchange, revealing lackluster institutional buying demand. Breadth was positive as advancers led decliners by almost a 3-1 margin on the NYSE and 7-4 on the Nasdaq exchange. There were 48 high-ranked companies from the Leaders List that hit new 52-week highs and were listed on the BreakOuts Page more than doubling the 19 on the prior session. New 52-week highs improved and outnumbered shrinking new 52-week lows totals on the NYSE and on the Nasdaq exchange. Recent weakness signaled a more worrisome market correction (M criteria). A proper follow-through day requires a solid gain from at least one of the major averages backed by higher volume coupled with an increase in the number of stocks hitting new 52-week highs over the prior session. Until then, investors are reminded to avoid new buying efforts and raise cash levels by selling stocks that weaken on a case-by-case basis as dictated by the rules of the fact-based investment system.
PICTURED: The Nasdaq Composite posted a gain on Tuesday with lighter volume while it promptly rebounded above its 50-day moving average (DMA) line. Gains have been backed by lighter volume after damaging volume-driven losses.
U.S. stocks finished firmly higher on Tuesday, with the S&P 500 back within 0.4% of a fresh record level. Risk appetite was bolstered as Wall Street continued to reevaluate the economic impact of the Omicron coronavirus variant. The new strain appears milder than originally thought, raising hope that consumer demand will remain intact. Also buoying the mood were results of a laboratory study that showed the GlaxoSmithKline (GSK +1.48%) and Vir Biotechnology’s (VIR +11.96%) joint antibody treatment (which blunts more severe disease of COVID-19) was effective against the Omicron variant. Meanwhile, in Washington, Senate leaders negotiated a deal that could raise the debt ceiling as soon as this evening by majority vote.
Mega-cap names Apple (AAPL +3.54%) and Tesla (TSLA +4.24%) surged following separate analyst price target increases. Chipmakers were also among the standouts, with the Philadelphia Semiconductor Index soaring 5% for its strongest session in nine months. Elsewhere, AutoZone (AZO +7.64%) rose on the heels of positive quarterly results.
Treasuries declined, with the yield curve flattening. The yield on the 10-year note was up four basis points (0.04%) to 1.48%, while the two-year note yield spiked six basis points (0.06%) to 0.69%, the highest level since March 2020. In commodities, WTI crude extended a rebound, adding 2.8% to $71.46/barrel. |
 Kenneth J. Gruneisen started out as a licensed stockbroker in August 1987, a couple of months prior to the historic stock market crash that took the Dow Jones Industrial Average down -22.6% in a single day. He has published daily fact-based fundamental and technical analysis on high-ranked stocks online for two decades. Through FACTBASEDINVESTING.COM, Kenneth provides educational articles, news, market commentary, and other information regarding proven investment systems that work in good times and bad.
Comments contained in the body of this report are technical opinions only and are not necessarily those of Gruneisen Growth Corp. The material herein has been obtained from sources believed to be reliable and accurate, however, its accuracy and completeness cannot be guaranteed. Our firm, employees, and customers may effect transactions, including transactions contrary to any recommendation herein, or have positions in the securities mentioned herein or options with respect thereto. Any recommendation contained in this report may not be suitable for all investors and it is not to be deemed an offer or solicitation on our part with respect to the purchase or sale of any securities. |
|
 |
Tech, Financial, Retail, and Commodity-Linked Groups Rose
Kenneth J. Gruneisen - Passed the CAN SLIM® Master's Exam
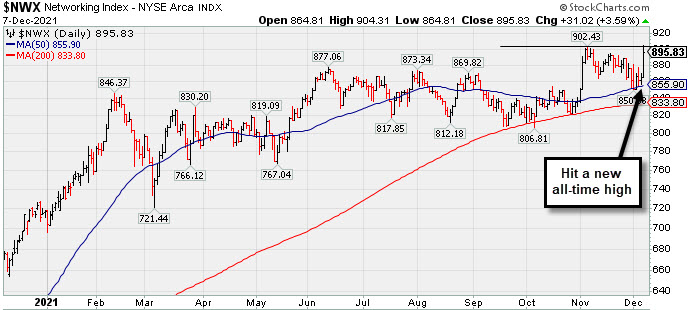
The Retail Index ($RLX +2.17%), Broker/Dealer Index ($XBD +2.09%), and Bank Index ($BKX +1.51%) posted unanimous gains and had a positive influence on the major averages. Commodity-linked groups had a positive bias as the Oil Services Index ($OSX +3.34%) and Integrated Oil Index ($XOI +1.81%) both outpaced the Gold & Silver Index ($XAU +1.07%). The tech sector saw big gains from the Semiconductor Index ($SOX +4.97%) leading the Biotech Index ($BTK +3.02%) and Networking Index ($NWX +3.59%) higher.
PICTURED: The Networking Index ($NWX +3.59%) posted a solid gain on Tuesday hitting a new all-time high.
| Oil Services |
$OSX |
53.88 |
+1.74 |
+3.34% |
+21.53% |
| Integrated Oil |
$XOI |
1,185.75 |
+21.04 |
+1.81% |
+49.62% |
| Semiconductor |
$SOX |
3,988.75 |
+188.68 |
+4.97% |
+42.68% |
| Networking |
$NWX |
895.83 |
+31.02 |
+3.59% |
+24.92% |
| Broker/Dealer |
$XBD |
487.86 |
+9.99 |
+2.09% |
+29.20% |
| Retail |
$RLX |
4,358.59 |
+92.73 |
+2.17% |
+22.32% |
| Gold & Silver |
$XAU |
128.60 |
+1.37 |
+1.07% |
-10.81% |
| Bank |
$BKX |
134.93 |
+2.00 |
+1.51% |
+37.81% |
| Biotech |
$BTK |
5,375.40 |
+157.63 |
+3.02% |
-6.34% |
|
|
|
 |
Perched at All Time High After Tight Consolidation Several Weeks
Kenneth J. Gruneisen - Passed the CAN SLIM® Master's Exam
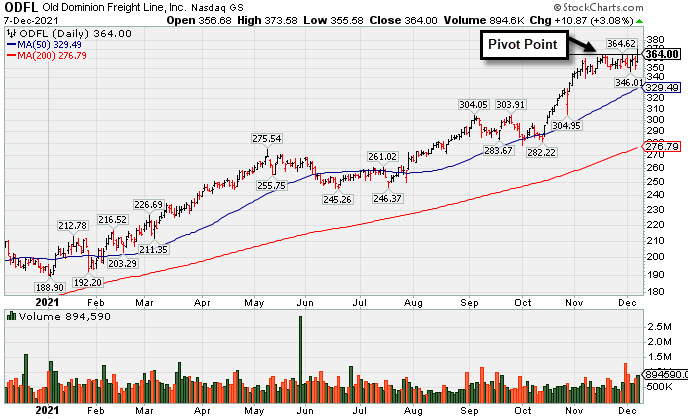
Old Dominion Freight Lines (ODFL +$10.87 or +3.08% to $364.00) finished in the middle of its intra-day range after hitting a new all-time high today. It was highlighted in yellow in the earlier mid-day report (read here) following more than 3 weeks tight with pivot point cited based on its 11/16/21 high plus 10 cents. Subsequent gains and a close above the pivot point backed by at least +40% above average volume may help clinch a convincing technical buy signal. The market direction (M criteria) remains a concern regarding any new buying until a new confirmed rally with a follow-through day.
It has a 97 Earnings Per Share Rating. Earnings rose +44% on +32% sales revenues for the Sep '21 quarter, its 5th consecutive comparison above the +25% minimum guideline (C criteria). Its annual earnings growth (A criteria) remained strong while it went through a deep and choppy consolidation then rebounded and rallied impressively since dropped from the Featured Stocks list on 10/10/18.
The number of top-rated funds owning its shares rose from 1,608 in Dec '20 to 1,756 in Sep '21, a reassuring sign concerning the I criteria. Its current Up/Down Volume Ratio of 1.3 is an unbiased indication its shares have been under accumulation over the past 50 days. It has a Timeliness Rating of A and a Sponsorship Rating of B. |
|
|
Color Codes Explained :
Y - Better candidates highlighted by our
staff of experts.
G - Previously featured
in past reports as yellow but may no longer be buyable under the
guidelines.
***Last / Change / Volume data in this table is the closing quote data***
Symbol/Exchange
Company Name
Industry Group |
PRICE |
CHANGE
(%Change) |
Day High |
Volume
(% DAV)
(% 50 day avg vol) |
52 Wk Hi
% From Hi |
Featured
Date |
Price
Featured |
Pivot Featured |
|
Max Buy |
 BLDR
-
NYSE
BLDR
-
NYSE
Builders Firstsource Inc
Bldg-Constr Prds/Misc
|
$76.00
|
+2.62
3.57% |
$80.95
|
5,482,755
264.74% of 50 DAV
50 DAV is 2,071,000
|
$74.47
2.05%
|
8/12/2021
|
$52.38
|
PP = $54.09
|
|
MB = $56.79
|
 Most Recent Note - 12/7/2021 12:34:09 PM
G - Gapped up today hitting another new all-time high, getting very extended from any sound base. Reported Sep '21 quarterly earnings +308% on +140% sales revenues versus the year ago period. It is well above its 50 DMA line ($62.75).
>>> FEATURED STOCK ARTICLE : Earnings News Due Thursday for High-Ranked Building Products Firm - 11/2/2021 |
View all notes |
Set NEW NOTE alert |
Company Profile |
SEC
News |
Chart |
Request a new note
C
A
S
I |
KFRC
-
NASDAQ
Kforce Inc
Comml Svcs-Staffing
|
$73.62
|
+0.08
0.11% |
$75.18
|
59,164
56.89% of 50 DAV
50 DAV is 104,000
|
$81.47
-9.64%
|
9/10/2021
|
$59.53
|
PP = $64.48
|
|
MB = $67.70
|
Most Recent Note - 12/3/2021 5:16:56 PM
G - Pulled back with lighter volume today slumping toward its 50 DMA line ($69.86) which defines important near-term support to watch. Recently reported Sep '21 quarterly earnings +8% on +10% sales revenues versus the year ago period, below the +25% minimum earnings guideline (C criteria), raising fundamental concerns.
>>> FEATURED STOCK ARTICLE : Extended From Base and Latest Quarter Earnings Growth Sub Par - 11/19/2021 |
View all notes |
Set NEW NOTE alert |
Company Profile |
SEC
News |
Chart |
Request a new note
C
A
S
I |
CAMT
-
NASDAQ
Camtek Ltd
ELECTRONICS - Scientific and Technical Instrum
|
$45.85
|
+2.90
6.75% |
$46.30
|
312,015
123.33% of 50 DAV
50 DAV is 253,000
|
$49.60
-7.56%
|
11/9/2021
|
$45.43
|
PP = $46.11
|
|
MB = $48.42
|
Most Recent Note - 12/7/2021 5:35:15 PM
Y - Gapped up today for a solid gain after testing support near its 50 DMA line ($42.12) with 5 consecutive losses. More damaging losses would raise greater concerns. Fundamentals remain strong.
>>> FEATURED STOCK ARTICLE : Rebound Above 50-Day Moving Average Helped Outlook - 11/5/2021 |
View all notes |
Set NEW NOTE alert |
Company Profile |
SEC
News |
Chart |
Request a new note
C
A
S
I |
AMD
-
NASDAQ
Advanced Micro Devices
ELECTRONICS - Semiconductor - Broad Line
|
$144.85
|
+5.79
4.16% |
$145.76
|
52,998,645
94.87% of 50 DAV
50 DAV is 55,862,000
|
$164.46
-11.92%
|
10/27/2021
|
$124.91
|
PP = $122.59
|
|
MB = $128.72
|
Most Recent Note - 12/7/2021 5:29:31 PM
G - Posted a gain today with below average volume after 4 volume-driven losses in the prior 5 sessions, retreating from record high territory. Its 50 DMA line ($129.57) and prior high in the $122 area define important support to watch on pullbacks. Fundamentals remain strong after it reported Sep '21 quarterly earnings +78% on +54% sales revenues versus the year ago period.
>>> FEATURED STOCK ARTICLE : AMD Pulling Back After Considerable Rally - 12/1/2021 |
View all notes |
Set NEW NOTE alert |
Company Profile |
SEC
News |
Chart |
Request a new note
C
A
S
I |
UMC
-
NYSE
United Microelectrnc Adr
ELECTRONICS - Semiconductor - Integrated Cir
|
$12.54
|
+0.50
4.15% |
$12.59
|
10,026,806
125.90% of 50 DAV
50 DAV is 7,964,000
|
$12.68
-1.10%
|
12/1/2021
|
$12.60
|
PP = $12.72
|
|
MB = $13.36
|
Most Recent Note - 12/7/2021 5:48:34 PM
Y - Posted a gain today with +26% above average volume for a best-ever close. New pivot point cited was based on its 9/03/21 high plus 10 cents. Its 50 DMA line ($11.04) defines near-term support. A gain and solid close above the pivot point may clinch a new (or add-on) technical buy signal. Reported Sep '21 quarterly earnings +100% on +30% sales revenues versus the year ago period. Recently found support above its 200 DMA line ($10.12).
>>> FEATURED STOCK ARTICLE : Rebound Above 50-Day Moving Average Showed Resilience - 11/30/2021 |
View all notes |
Set NEW NOTE alert |
Company Profile |
SEC
News |
Chart |
Request a new note
C
A
S
I |
Symbol/Exchange
Company Name
Industry Group |
PRICE |
CHANGE
(%Change) |
Day High |
Volume
(% DAV)
(% 50 day avg vol) |
52 Wk Hi
% From Hi |
Featured
Date |
Price
Featured |
Pivot Featured |
|
Max Buy |
ENTG
-
NASDAQ
Entegris Inc
ELECTRONICS - Semiconductor Equipment and Mate
|
$153.20
|
+7.91
5.44% |
$154.52
|
928,657
87.53% of 50 DAV
50 DAV is 1,061,000
|
$158.00
-3.04%
|
8/4/2021
|
$125.33
|
PP = $126.51
|
|
MB = $132.84
|
Most Recent Note - 12/7/2021 5:41:31 PM
G - Posted a big gain today with below average volume. Very extended from any sound base, its 50 DMA line ($139.12) and prior high ($139) define important near-term support to watch. Fundamentals remain strong after it recently reported Sep '21 quarterly earnings +37% on +20% sales revenues versus the year ago period.
>>> FEATURED STOCK ARTICLE : Best Ever Close After Volume-Driven Gain - 11/29/2021 |
View all notes |
Set NEW NOTE alert |
Company Profile |
SEC
News |
Chart |
Request a new note
C
A
S
I |
SKY
-
NYSE
Skyline Champion Corp
Bldg-Mobile/Mfg andamp; RV
|
$83.79
|
+1.80
2.20% |
$85.33
|
502,183
128.11% of 50 DAV
50 DAV is 392,000
|
$82.90
1.07%
|
11/3/2021
|
$72.19
|
PP = $66.92
|
|
MB = $70.27
|
Most Recent Note - 12/6/2021 5:33:47 PM
G - Posted a volume-driven gain today for a best-ever close. Its 50 DMA line ($69.39) and prior highs in the $66 area define important near-term support to watch. Reported very strong Mar, Jun and Sep '21 quarterly results versus the year ago periods well above the +25% minimum earnings guideline (C criteria). Annual earnings (A criteria) history has been strong.
>>> FEATURED STOCK ARTICLE : Breakaway Gap After 10-Week Flat Base - 11/3/2021 |
View all notes |
Set NEW NOTE alert |
Company Profile |
SEC
News |
Chart |
Request a new note
C
A
S
I |
DHI
-
NYSE
D R Horton Inc
MATERIALS and CONSTRUCTION - Residential Construction
|
$106.16
|
+0.45
0.43% |
$107.03
|
2,452,146
98.48% of 50 DAV
50 DAV is 2,490,000
|
$106.89
-0.68%
|
12/6/2021
|
$104.40
|
PP = $106.99
|
|
MB = $112.34
|
Most Recent Note - 12/6/2021 5:24:53 PM
Y - Managed a best ever close today after highlighted in yellow with pivot point cited based on its 5/10/21 high plus 10 cents in the earlier mid-day report. Challenged its all-time high and no resistance remains due to overhead supply. Recently rallied from a double bottom. Reported Sep '21 earnings +68% on +27% sales revenues versus the year-ago period, its 8th strong quarterly comparison above the +25% minimum guideline (C criteria). Annual earnings growth (A criteria) has been strong. The market direction (M criteria) remains a concern regarding any new buying until a new confirmed rally with a follow-through day. See the latest FSU analysis for more details and a new annotated graph.
>>> FEATURED STOCK ARTICLE : Builder Built a Solid Base And Challenged Prior High - 12/6/2021 |
View all notes |
Set NEW NOTE alert |
Company Profile |
SEC
News |
Chart |
Request a new note
C
A
S
I |
WSM
-
NYSE
Williams Sonoma Inc
RETAIL - Home Furnishing Stores
|
$182.92
|
+5.45
3.07% |
$186.28
|
778,477
83.71% of 50 DAV
50 DAV is 930,000
|
$223.32
-18.09%
|
11/3/2021
|
$205.00
|
PP = $195.09
|
|
MB = $204.84
|
Most Recent Note - 12/7/2021 5:52:22 PM
G - Posted a gain today with lighter volume halting a streak of 5 consecutive damaging volume-driven losses. A rebound above its 50 DMA line ($191) is needed for its outlook to improve. Fundamental remain strong after it reported Oct '21 quarterly earnings +30% on +16% sales revenues versus the year ago period.
>>> FEATURED STOCK ARTICLE : Volume-Driven Gains May Signal a New Meaningful Leg Up - 11/4/2021 |
View all notes |
Set NEW NOTE alert |
Company Profile |
SEC
News |
Chart |
Request a new note
C
A
S
I |
TITN
-
NASDAQ
Titan Machinery Inc
SPECIALTY RETAIL
|
$33.76
|
+0.63
1.90% |
$34.67
|
124,557
78.83% of 50 DAV
50 DAV is 158,000
|
$38.58
-12.49%
|
11/23/2021
|
$36.22
|
PP = $35.34
|
|
MB = $37.11
|
Most Recent Note - 12/6/2021 5:39:22 PM
G - Showing resilience but gains have lacked great volume after slumping back into the prior base with volume-driven losses. Reported Oct '21 quarterly earnings +81% on +26% sales revenues over the year ago period, its 4th strong quarterly comparison.
>>> FEATURED STOCK ARTICLE : Strong Close With Gain Backed by +467% Above Average Volume - 11/23/2021 |
View all notes |
Set NEW NOTE alert |
Company Profile |
SEC
News |
Chart |
Request a new note
C
A
S
I |
Symbol/Exchange
Company Name
Industry Group |
PRICE |
CHANGE
(%Change) |
Day High |
Volume
(% DAV)
(% 50 day avg vol) |
52 Wk Hi
% From Hi |
Featured
Date |
Price
Featured |
Pivot Featured |
|
Max Buy |
CLFD
-
NASDAQ
Clearfield Inc
TELECOMMUNICATIONS - Cables / Satalite Equipment
|
$65.71
|
+4.48
7.32% |
$66.91
|
91,155
71.78% of 50 DAV
50 DAV is 127,000
|
$72.00
-8.74%
|
7/23/2021
|
$40.23
|
PP = $43.74
|
|
MB = $45.93
|
Most Recent Note - 12/7/2021 5:37:07 PM
G - Posted a solid gain on below average volume today. Still extended from the previously noted base, consolidating above its 50 DMA line ($57.95) which defines near-term support to watch on pullbacks. Reported Sep '21 quarterly earnings +141% on +66% sales revenues above the year ago period.
>>> FEATURED STOCK ARTICLE : Perched Near High Extended From Any Sound Base - 11/22/2021 |
View all notes |
Set NEW NOTE alert |
Company Profile |
SEC
News |
Chart |
Request a new note
C
A
S
I |
ODFL
-
NASDAQ
Old Dominion Fght Line
TRANSPORTATION - Trucking
|
$364.00
|
+10.87
3.08% |
$373.58
|
912,558
161.80% of 50 DAV
50 DAV is 564,000
|
$364.83
-0.23%
|
12/7/2021
|
$365.61
|
PP = $364.17
|
|
MB = $382.38
|
Most Recent Note - 12/7/2021 5:27:33 PM
Y - Finished in the middle of its intra-day range after hitting a new high today. Color code was changed to yellow after more than 3 weeks tight. Subsequent volume-driven gains are needed to clinch a buy signal, and the broader market direction (M criteria) remains a concern until a follow-through day. Reported earnings +44% on +32% sales revenues for the Sep '21 quarter, its 5th consecutive comparison above the +25% minimum guideline (C criteria). See the latest FSU analysis for more details and a new annotated graph.
>>> FEATURED STOCK ARTICLE : Perched at All Time High After Tight Consolidation Several Weeks - 12/7/2021 |
View all notes |
Set NEW NOTE alert |
Company Profile |
SEC
News |
Chart |
Request a new note
C
A
S
I |
ENPH
-
NASDAQ
Enphase Energy Inc
Energy-Solar
|
$222.56
|
+9.62
4.52% |
$230.05
|
1,945,163
80.35% of 50 DAV
50 DAV is 2,421,000
|
$282.46
-21.21%
|
10/28/2021
|
$218.00
|
PP = $229.14
|
|
MB = $240.60
|
Most Recent Note - 12/7/2021 5:40:14 PM
G - Halted its slide at its 50 DMA line ($209) with today's gain on lighter volume following 5 consecutive losses. More damaging losses would raise serious concerns and trigger a technical sell signal. Undercut the prior high ($229) raising concerns while recently slumping back into the prior base.
>>> FEATURED STOCK ARTICLE : Pullback Testing Near Prior High - 12/2/2021 |
View all notes |
Set NEW NOTE alert |
Company Profile |
SEC
News |
Chart |
Request a new note
C
A
S
I |
SMPL
-
NASDAQ
Simply Good Foods Co
Food-Confectionery
|
$38.13
|
+0.91
2.44% |
$38.44
|
276,097
75.23% of 50 DAV
50 DAV is 367,000
|
$41.35
-7.79%
|
10/25/2021
|
$38.30
|
PP = $38.60
|
|
MB = $40.53
|
Most Recent Note - 12/7/2021 5:54:07 PM
Y - Color code is changed to yellow after today's 4th consecutive gain, rebounding above its 50 DMA line ($37.57) helping its outlook improve.
>>> FEATURED STOCK ARTICLE : Consolidating Above Prior High Following Recent Technical Breakout - 11/15/2021 |
View all notes |
Set NEW NOTE alert |
Company Profile |
SEC
News |
Chart |
Request a new note
C
A
S
I |
WDAY
-
NYSE
Workday Inc Cl A
Computer Sftwr-Enterprse
|
$280.24
|
+11.15
4.14% |
$283.15
|
1,767,635
109.54% of 50 DAV
50 DAV is 1,613,700
|
$307.81
-8.96%
|
9/7/2021
|
$275.69
|
PP = $282.87
|
|
MB = $297.01
|
Most Recent Note - 12/7/2021 5:50:23 PM
Y - Color code is changed to yellow after rebounding above its 50 DMA line with today's 4th consecutive gain helping its outlook improve. Its Relative Strength Rating has improved to 81, above the 80+ minimum guideline for buy candidates. Reported Oct '21 quarterly earnings +28% on +20% sales revenues versus the year ago period. Fundamentals remain strong.
>>> FEATURED STOCK ARTICLE : Getting Extended From Previously Noted Base - 11/16/2021 |
View all notes |
Set NEW NOTE alert |
Company Profile |
SEC
News |
Chart |
Request a new note
C
A
S
I |
Symbol/Exchange
Company Name
Industry Group |
PRICE |
CHANGE
(%Change) |
Day High |
Volume
(% DAV)
(% 50 day avg vol) |
52 Wk Hi
% From Hi |
Featured
Date |
Price
Featured |
Pivot Featured |
|
Max Buy |
CTLT
-
NYSE
"Catalent, Inc"
DRUGS - Biotechnology
|
$123.49
|
+2.63
2.18% |
$125.46
|
1,055,022
114.46% of 50 DAV
50 DAV is 921,700
|
$142.64
-13.43%
|
8/25/2021
|
$128.72
|
PP = $127.78
|
|
MB = $134.17
|
Most Recent Note - 12/3/2021 5:08:23 PM
G - Slumped further below its 50 DMA line ($130.55) with todays loss. Testing near the prior low ($119) and 200 DMA line ($117.95) which define important near-term support to watch. More damaging losses would raise greater concerns. Its Relative Strength Rating is 83, above the 80+ minimum guideline for buy candidates. Fundamentals remain strong after it reported Sep '21 quarterly earnings +65% on +21% sales revenues versus the year ago period, continuing its strong earnings track record.
>>> FEATURED STOCK ARTICLE : Recent Violation of 50-Day Moving Average Triggered Sell Signal - 11/11/2021 |
View all notes |
Set NEW NOTE alert |
Company Profile |
SEC
News |
Chart |
Request a new note
C
A
S
I |
TTD
-
NASDAQ
The Trade Desk Inc Cl A
Comml Svcs-Advertising
|
$95.72
|
+6.09
6.79% |
$97.59
|
3,903,623
72.82% of 50 DAV
50 DAV is 5,361,000
|
$114.09
-16.10%
|
11/9/2021
|
$95.16
|
PP = $90.00
|
|
MB = $94.50
|
Most Recent Note - 12/7/2021 5:46:04 PM
G - Color code is changed to green after rising above its "max buy" level again with today's gain on light volume. Found support after falling near the prior high ($90). More damaging losses would raise serious concerns and its 50 DMA line ($84.70) defines additional support to watch.
>>> FEATURED STOCK ARTICLE : Powerful Volume-Driven Gains for New Highs - 11/9/2021 |
View all notes |
Set NEW NOTE alert |
Company Profile |
SEC
News |
Chart |
Request a new note
C
A
S
I |
MEDP
-
NASDAQ
Medpace Holdings Inc
Medical-Research Eqp/Svc
|
$213.68
|
+8.70
4.24% |
$213.88
|
154,985
95.08% of 50 DAV
50 DAV is 163,000
|
$231.00
-7.50%
|
9/10/2021
|
$196.32
|
PP = $196.22
|
|
MB = $206.03
|
Most Recent Note - 12/7/2021 5:43:49 PM
G - Posted a gain today with lighter volume after testing its 50 DMA line ($206). More damaging losses may trigger a technical sell signal. Below its 50 DMA line the prior highs in the $199 area define important near-term support to watch. Recently noted repeatedly - "Sep '21 earnings rose +18% on +28% sales revenues versus the year ago period, below the +25% minimum earnings guideline (C criteria), raising fundamental concerns.
>>> FEATURED STOCK ARTICLE : Medpace Hovering at High With Volume Totals Cooling - 11/17/2021 |
View all notes |
Set NEW NOTE alert |
Company Profile |
SEC
News |
Chart |
Request a new note
C
A
S
I |
JEF
-
NYSE
Jefferies Financial Grp
Finance-Invest Bnk/Bkrs
|
$39.50
|
+0.82
2.12% |
$39.88
|
994,749
58.86% of 50 DAV
50 DAV is 1,690,000
|
$44.47
-11.18%
|
6/28/2021
|
$31.81
|
PP = $34.42
|
|
MB = $36.14
|
Most Recent Note - 12/3/2021 5:15:19 PM
G - Today's loss was backed by lighter volume. A rebound above the 50 DMA line ($40.73) is needed for its outlook to improve. Reported Aug '21 quarterly earnings +40% on +20% sales revenues versus the year ago period.
>>> FEATURED STOCK ARTICLE : Extended From Prior Highs and Stubbornly Holding Ground - 11/1/2021 |
View all notes |
Set NEW NOTE alert |
Company Profile |
SEC
News |
Chart |
Request a new note
C
A
S
I |
AVTR
-
NYSE
Avantor Inc
Medical-Research Eqp/Svc
|
$39.51
|
+1.38
3.62% |
$39.99
|
3,279,310
83.63% of 50 DAV
50 DAV is 3,921,000
|
$44.37
-10.95%
|
6/10/2021
|
$32.94
|
PP = $34.09
|
|
MB = $35.79
|
Most Recent Note - 12/7/2021 5:32:10 PM
G - Posted a gain today rebounding above its 50 DMA line ($39.14) helping its technical stance improve. Faces overhead supply up to the $44 level. Prior lows in the high $36 area define important near-term support. Reported Sep '21 quarterly earnings +46% above the year ago period. Completed a Secondary Offering on 9/13/21.
>>> FEATURED STOCK ARTICLE : Faces Resistance While Sputtering Below 50 DMA Line - 11/12/2021 |
View all notes |
Set NEW NOTE alert |
Company Profile |
SEC
News |
Chart |
Request a new note
C
A
S
I |
Symbol/Exchange
Company Name
Industry Group |
PRICE |
CHANGE
(%Change) |
Day High |
Volume
(% DAV)
(% 50 day avg vol) |
52 Wk Hi
% From Hi |
Featured
Date |
Price
Featured |
Pivot Featured |
|
Max Buy |
MIME
-
NASDAQ
Mimecast Limited
Computer Sftwr-Security
|
$79.40
|
+4.40
5.87% |
$80.25
|
7,948,734
1,340.43% of 50 DAV
50 DAV is 593,000
|
$85.48
-7.11%
|
10/18/2021
|
$68.17
|
PP = $71.55
|
|
MB = $75.13
|
Most Recent Note - 12/7/2021 1:07:09 PM
G - Color code is changed to green after gapping up above its "max buy" level with today's big volume-driven gain. Found prompt support at its 50 DMA line ($73.31) and prior highs in the $71 area. More damaging losses would raise concerns and trigger technical sell signals.
>>> FEATURED STOCK ARTICLE : Extended From Latest Base While Fundamentals Remain Strong - 11/26/2021 |
View all notes |
Set NEW NOTE alert |
Company Profile |
SEC
News |
Chart |
Request a new note
C
A
S
I |
AZTA
-
NASDAQ
"Azenta, Inc."
ELECTRONICS - Semiconductor Equipment
|
$108.66
|
+3.27
3.10% |
$110.72
|
615,574
111.90% of 50 DAV
50 DAV is 550,100
|
$124.79
-12.93%
|
9/20/2021
|
$101.21
|
PP = $108.82
|
|
MB = $114.26
|
Most Recent Note - 12/7/2021 5:33:27 PM
G - Gapped up today halting its slide after slumping below prior highs and its 50 DMA line with volume-driven losses triggering technical sell signals. Only a prompt rebound above the 50 DMA line ($110.77) would help its outlook improve. Azenta Inc. (AZTA), formerly was Brooks Automation Inc., (BRKS). The company had said on Nov. 16 that it was changing its name to Azenta, following the launch of the Azenta Life Sciences brand, and after announcing in September that it was selling its semiconductor automation business to Thomas H. Lee Partners. Reported Sep 21 quarterly earnings +33% on +27% sales revenues versus the year ago period.
There are no Featured Stock Updates™ available for this stock at this time. You may request one by clicking the Request a New Note link below |
View all notes |
Set NEW NOTE alert |
Company Profile |
SEC
News |
Chart |
Request a new note
C
A
S
I |
|
|
|
THESE ARE NOT BUY RECOMMENDATIONS!
Comments contained in the body of this report are technical
opinions only. The material herein has been obtained
from sources believed to be reliable and accurate, however,
its accuracy and completeness cannot be guaranteed.
This site is not an investment advisor, hence it does
not endorse or recommend any securities or other investments.
Any recommendation contained in this report may not
be suitable for all investors and it is not to be deemed
an offer or solicitation on our part with respect to
the purchase or sale of any securities. All trademarks,
service marks and trade names appearing in this report
are the property of their respective owners, and are
likewise used for identification purposes only.
This report is a service available
only to active Paid Premium Members.
You may opt-out of receiving report notifications
at any time. Questions or comments may be submitted
by writing to Premium Membership Services 665 S.E. 10 Street, Suite 201 Deerfield Beach, FL 33441-5634 or by calling 1-800-965-8307
or 954-785-1121.
|
|
|