You are not logged in.
This means you
CAN ONLY VIEW reports that were published prior to Wednesday, April 9, 2025.
You
MUST UPGRADE YOUR MEMBERSHIP if you want to see any current reports.
AFTER MARKET UPDATE - THURSDAY, FEBRUARY 11TH, 2021
Previous After Market Report Next After Market Report >>>
|
|
|
|
DOW |
-7.10 |
31,430.70 |
-0.02% |
|
Volume |
1,015,910,514 |
+4% |
|
Volume |
10,815,467,500 |
+3% |
|
NASDAQ |
+57.56 |
14,030.10 |
+0.41% |
|
Advancers |
1,479 |
46% |
|
Advancers |
1,763 |
45% |
|
S&P 500 |
+6.50 |
3,916.38 |
+0.17% |
|
Decliners |
1,728 |
54% |
|
Decliners |
2,150 |
55% |
|
Russell 2000 |
+2.88 |
2,285.32 |
+0.13% |
|
52 Wk Highs |
242 |
|
|
52 Wk Highs |
442 |
|
|
S&P 600 |
+4.88 |
1,295.81 |
+0.38% |
|
52 Wk Lows |
8 |
|
|
52 Wk Lows |
16 |
|
|
 |
Major Indices Show Indecisiveness on Mixed Session
Kenneth J. Gruneisen - Passed the CAN SLIM® Master's Exam
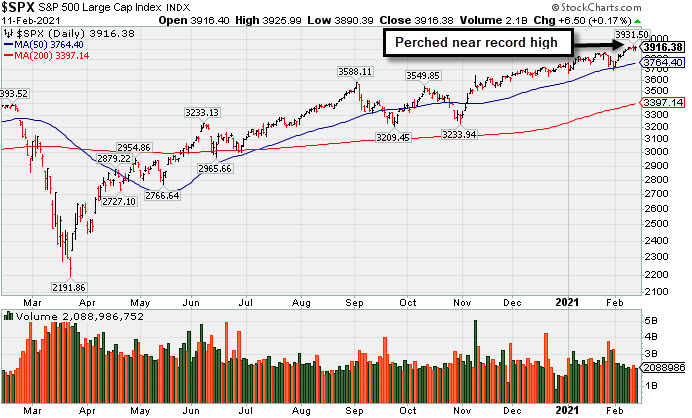
The Dow ended just below the flat line, losing 7 points, while the S&P 500 eked out a gain of 0.2%. The Nasdaq Composite added 0.4% amid strength in Tech shares. The volume totals were higher than the prior session on the NYSE and on the Nasdaq exchange. Decliners led advancers by a narrow margin on the NYSE and on the Nasdaq exchange. There were 91 high-ranked companies from the Leaders List that hit new 52-week highs and were listed on the BreakOuts Page, versus the total of 105 on the prior session. New 52-week highs totals easily outnumbered new 52-week lows totals on both exchanges. The major indices are in a confirmed uptrend (M criteria) with healthy leadership provided by many stocks hitting new highs. Investors are reminded to always make buying and selling decisions based based on the strict criteria and rules of the fact-based investment system. PICTURED: The S&P 500 Index is perched near its record high.
U.S. stocks fluctuated on Thursday, with both the S&P 500 and Nasdaq Composite closing at fresh all-time highs. Investors digested a slight uptick in weekly unemployment claims, while expectations of a sizeable stimulus package from Washington continued to buoy sentiment.
On the data front, initial jobless claims came in at 793,000 in the week ended February 6, above forecasts of 760,000 but easing from the prior upwardly revised 812,000 figure. Treasuries weakened, with the yield on the 10-year note rising four basis points to 1.16%. In commodities, WTI crude dropped 0.7% to $57.95/barrel, ending its longest winning streak in two years. Copper notched a fifth consecutive increase, hovering at its best level since 2013.
Seven of 11 S&P 500 sectors closed in negative territory, with Energy shares the largest drag as oil prices turned lower. The Technology group outperformed, with Zebra Technologies (ZBRA +9.97%) after posting a larger-than-expected profit tally. In other earnings, PepsiCo (PEP -1.98%) despite topping analyst estimates on both the top and bottom line and announcing a 5% increase to its dividend. Kraft Heinz (KHC +4.87%) rose following upbeat quarterly figures and announcing plans to sell its Planters snack unit to Hormel (HRL -3.27%) for $3.35 billion. Meanwhile, ride-hailing service Uber Technologies (UBER -3.91%) fell after its fourth-quarter revenue missed consensus forecasts. Elsewhere, Zillow Group (Z +17.79%) rose following a top and bottom line beat. |
 Kenneth J. Gruneisen started out as a licensed stockbroker in August 1987, a couple of months prior to the historic stock market crash that took the Dow Jones Industrial Average down -22.6% in a single day. He has published daily fact-based fundamental and technical analysis on high-ranked stocks online for two decades. Through FACTBASEDINVESTING.COM, Kenneth provides educational articles, news, market commentary, and other information regarding proven investment systems that work in good times and bad.
Comments contained in the body of this report are technical opinions only and are not necessarily those of Gruneisen Growth Corp. The material herein has been obtained from sources believed to be reliable and accurate, however, its accuracy and completeness cannot be guaranteed. Our firm, employees, and customers may effect transactions, including transactions contrary to any recommendation herein, or have positions in the securities mentioned herein or options with respect thereto. Any recommendation contained in this report may not be suitable for all investors and it is not to be deemed an offer or solicitation on our part with respect to the purchase or sale of any securities. |
|
 |
Big Gain for Semiconductor Index; Commodity-Linked Groups Fell
Kenneth J. Gruneisen - Passed the CAN SLIM® Master's Exam
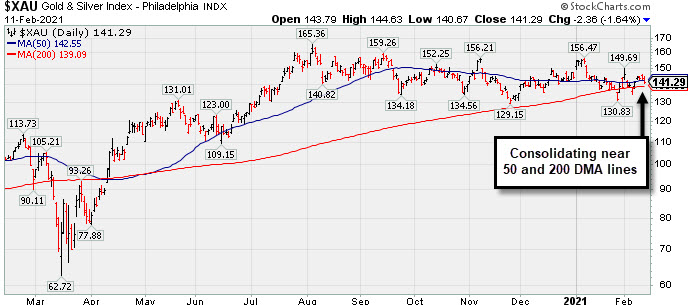
Commodity-linked groups had a clearly negative bias as the Oil Services Index ($OSX -2.91%), Integrated Oil Index ($XOI -1.07%), and Gold & Silver Index ($XAU -1.64%) ended unanimously lower. The Semiconductor Index ($SOX +3.48%) led the tech sector while the Networking Index ($NWX -0.08%) finished flat and the Biotech Index ($BTK -0.99%) fell. The Broker/Dealer Index ($XBD +0.55%) posted a modest gain while the Bank Index ($BKX -0.64%) and the Retail Index ($RLX -0.67%) each ended modestly lower.
PICTURED: The Gold & Silver Index ($XAU -1.64%) is consolidating near its 50-day and 200-day moving average (DMA) lines.
| Oil Services |
$OSX |
51.13 |
-1.53 |
-2.91% |
+15.35% |
| Integrated Oil |
$XOI |
900.23 |
-9.74 |
-1.07% |
+13.60% |
| Semiconductor |
$SOX |
3,181.74 |
+106.88 |
+3.48% |
+13.82% |
| Networking |
$NWX |
835.04 |
-0.64 |
-0.08% |
+16.44% |
| Broker/Dealer |
$XBD |
422.59 |
+2.30 |
+0.55% |
+11.92% |
| Retail |
$RLX |
3,647.94 |
-24.66 |
-0.67% |
+2.38% |
| Gold & Silver |
$XAU |
141.29 |
-2.36 |
-1.64% |
-2.01% |
| Bank |
$BKX |
107.37 |
-0.69 |
-0.64% |
+9.66% |
| Biotech |
$BTK |
6,225.26 |
-62.04 |
-0.99% |
+8.47% |
|
|
|
 |
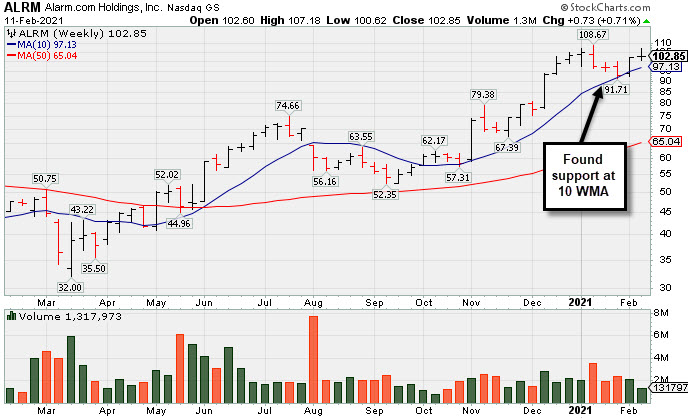
Perched Near Prior High After Finding Support at 10 WMA
Kenneth J. Gruneisen - Passed the CAN SLIM® Master's Exam
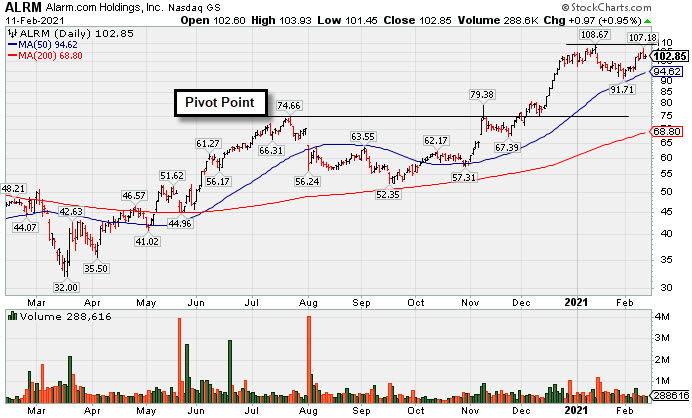
Alarm.com Holdings Inc (ALRM +$0.97 or +0.95% to $102.85) has been rebounding toward its prior high. Today's gain was backed by below average volume. Its color code was recently changed to yellow as it was noted that a valid secondary buy point exists up to 5% above the prior high since it found support at its 10 week moving average (WMA) line ($97.13). Below are weekly and daily graphs which illustrate how it stayed well above the 50-day moving average (DMA) line while it truly tested the 10 WMA line and found support.
It currently has a 91 Earnings Per Share Rating. Keep in mind the company is due to report Dec '20 quarterly results on 2/25/21. Volume and volatility often increase near earnings news. ALRM reported earnings +32% on +24% sales revenues for the Sep '20 quarter versus the year ago period, an improvement after +3% earnings in the Jun quarter. Prior quarterly comparisons were near or above the +25% minimum earnings guideline (C criteria). Annual earnings (A criteria) growth has been strong, a good match with the fact-based investment system.
ALRM has traded up as much as +51.2% since it was highlighted in yellow in the 11/06/20 mid-day report (read here). It was last shown in this FSU section on 1/20/21 with an annotated graph under the headline, "Encountered Distributional Pressure After Big Rally". The number of top-rated funds owning its shares rose from 262 in Mar '18 to 404 in Dec '20, a reassuring sign concerning the I criteria. Its current Up/Down Volume Ratio of 1.2 is an unbiased indication its shares have been under accumulation over the past 50 days. It has earned a Timeliness Rating of B and a Sponsorship Rating of C.
Charts courtesy of www.stockcharts.com
 |
|
|
Color Codes Explained :
Y - Better candidates highlighted by our
staff of experts.
G - Previously featured
in past reports as yellow but may no longer be buyable under the
guidelines.
***Last / Change / Volume data in this table is the closing quote data***
Symbol/Exchange
Company Name
Industry Group |
PRICE |
CHANGE
(%Change) |
Day High |
Volume
(% DAV)
(% 50 day avg vol) |
52 Wk Hi
% From Hi |
Featured
Date |
Price
Featured |
Pivot Featured |
|
Max Buy |
 CRL
-
NYSE
CRL
-
NYSE
Charles River Labs Intl
DRUGS - Biotechnology
|
$289.25
|
+8.70
3.10% |
$289.59
|
459,378
157.86% of 50 DAV
50 DAV is 291,000
|
$286.87
0.83%
|
12/17/2020
|
$247.06
|
PP = $257.98
|
|
MB = $270.88
|
Most Recent Note - 2/8/2021 2:43:52 PM
G - Rebounded above its "max buy" level near its prior high and its color code is changed to green. Recently tested and found prompt support at the prior high ($257) and its 50 DMA line ($255). Reported Sep '20 quarterly earnings +38% on +11% sales revenues versus the year ago period, above the +25% minimum earnings guideline (C criteria).
>>> FEATURED STOCK ARTICLE : Testing Important Support on Pullback - 1/29/2021 |
View all notes |
Set NEW NOTE alert |
Company Profile |
SEC
News |
Chart |
Request a new note
C
A
S
I |
AMD
-
NYSE
Advanced Micro Devices
ELECTRONICS - Semiconductor - Broad Line
|
$92.66
|
+0.31
0.34% |
$93.65
|
35,363,648
79.33% of 50 DAV
50 DAV is 44,578,800
|
$99.23
-6.62%
|
11/18/2020
|
$82.54
|
PP = $88.72
|
|
MB = $93.16
|
Most Recent Note - 2/10/2021 5:42:05 PM
G - Quietly rebounded to close above its 50 DMA line ($92.00) which has been acting as resistance. Its current Relative Strength rating of 66 is still below the 80+ minimum guideline for buy candidates. Fundamentals remain strong after it reported Dec '20 quarterly earnings +63% on +53% sales revenues versus the year ago period. See the latest FSU analysis for more details and a new annotated graph.
>>> FEATURED STOCK ARTICLE : Close Above 50-Day Moving Average But Relative Strength a Concern - 2/10/2021 |
View all notes |
Set NEW NOTE alert |
Company Profile |
SEC
News |
Chart |
Request a new note
C
A
S
I |
AMRC
-
NYSE
Ameresco Inc Cl A
ENERGY - Alternative
|
$66.53
|
-0.65
-0.97% |
$67.87
|
344,768
74.95% of 50 DAV
50 DAV is 460,000
|
$70.26
-5.31%
|
12/15/2020
|
$46.72
|
PP = $47.10
|
|
MB = $49.46
|
Most Recent Note - 2/10/2021 5:44:18 PM
G - Reversed after hitting a new all-time high today. Extended from any sound base. Its 50-day moving average (DMA) line ($53.89) defines near-term support to watch..
>>> FEATURED STOCK ARTICLE : Rebounding After Retreat From Record High - 2/1/2021 |
View all notes |
Set NEW NOTE alert |
Company Profile |
SEC
News |
Chart |
Request a new note
C
A
S
I |
TREX
-
NYSE
Trex Company Inc
MATERIALS and CONSTRUCTION - General Building Materials
|
$104.00
|
+2.24
2.20% |
$104.16
|
590,015
84.89% of 50 DAV
50 DAV is 695,000
|
$105.79
-1.69%
|
6/26/2020
|
$54.53
|
PP = $66.47
|
|
MB = $69.79
|
Most Recent Note - 2/8/2021 2:45:50 PM
G - Touched a new all-time high with today's 3rd consecutive gain backed by below average volume. Its 50 DMA line ($86.55) and prior highs in the $80-81 area define important support to watch on pullbacks. Sep '20 quarterly earnings were +14% on +19% sales revenues versus the year ago period, below the +25% minimum guideline (C criteria) raising fundamental concerns.
>>> FEATURED STOCK ARTICLE : Hit New All-Time High With Gain Backed by Average Volume - 1/19/2021 |
View all notes |
Set NEW NOTE alert |
Company Profile |
SEC
News |
Chart |
Request a new note
C
A
S
I |
CLFD
-
NASDAQ
Clearfield Inc
TELECOMMUNICATIONS - Cables / Satalite Equipment
|
$34.97
|
+1.19
3.52% |
$35.97
|
236,247
166.37% of 50 DAV
50 DAV is 142,000
|
$37.54
-6.85%
|
1/20/2021
|
$31.38
|
PP = $28.42
|
|
MB = $29.84
|
 Most Recent Note - 2/11/2021 12:53:00 PM
G - Very extended from any sound base. Prior highs in the $28 area define important support to watch coinciding with its 50 DMA line ($28.13). Reported Dec '20 quarterly earnings +475% on +40% sales revenues versus the year ago period, continuing its strong earning track record.
>>> FEATURED STOCK ARTICLE : Perched Near Record High With Earnings Report Due Soon - 1/27/2021 |
View all notes |
Set NEW NOTE alert |
Company Profile |
SEC
News |
Chart |
Request a new note
C
A
S
I |
Symbol/Exchange
Company Name
Industry Group |
PRICE |
CHANGE
(%Change) |
Day High |
Volume
(% DAV)
(% 50 day avg vol) |
52 Wk Hi
% From Hi |
Featured
Date |
Price
Featured |
Pivot Featured |
|
Max Buy |
NOW
-
NYSE
Servicenow Inc
Computer Sftwr-Enterprse
|
$594.47
|
+5.11
0.87% |
$595.00
|
726,516
52.52% of 50 DAV
50 DAV is 1,383,400
|
$598.37
-0.65%
|
8/20/2020
|
$453.34
|
PP = $454.79
|
|
MB = $477.53
|
Most Recent Note - 2/11/2021 6:59:20 PM
G - Holding its ground stubbornly near its all-time high with volume totals cooling. A new pivot point was not cited due to fundamental concerns noted as its impressive rally has continued. Gapped up on 1/28/21 promptly rebounding above its 50 DMA line ($544). Fundamental concerns remain after it reported Dec '20 quarterly earnings +22% on +31% sales revenues versus the year ago period, its 2nd consecutive comparison below the +25% minimum guideline (C criteria) of the fact-based investment system.
>>> FEATURED STOCK ARTICLE : Hit New Highs With Latest Gains Backed by Light Volume - 2/5/2021 |
View all notes |
Set NEW NOTE alert |
Company Profile |
SEC
News |
Chart |
Request a new note
C
A
S
I |
SMPL
-
NASDAQ
Simply Good Foods Co
Food-Confectionery
|
$30.33
|
+0.34
1.13% |
$30.43
|
436,381
36.83% of 50 DAV
50 DAV is 1,184,700
|
$32.03
-5.31%
|
12/28/2020
|
$30.40
|
PP = $31.44
|
|
MB = $33.01
|
Most Recent Note - 2/8/2021 3:07:20 PM
G - Posting a gain today with lighter than average volume. Its Relative Strength Rating is 64, still below the 80+ minimum guideline. Its 50 DMA line ($27.23) and prior low ($26.78) define near term support to watch.
>>> FEATURED STOCK ARTICLE : Relative Strength Rating Suffered During Stalling Action - 1/21/2021 |
View all notes |
Set NEW NOTE alert |
Company Profile |
SEC
News |
Chart |
Request a new note
C
A
S
I |
ALRM
-
NASDAQ
Alarm.com Holdings Inc
Security/Sfty
|
$102.85
|
+0.97
0.95% |
$103.93
|
283,978
61.60% of 50 DAV
50 DAV is 461,000
|
$108.67
-5.36%
|
2/9/2021
|
$71.88
|
PP = $108.67
|
|
MB = $114.10
|
Most Recent Note - 2/11/2021 6:56:42 PM
Y - Rebounding toward its prior high with today's gain backed by below average volume. Color code was recently changed to yellow as it was noted that a valid secondary buy point exists up to 5% above the prior high since it found support at its 10 week moving averag3e (WMA) line ($97.13). See the latest FSU analysis for more details and a new annotated graph.
>>> FEATURED STOCK ARTICLE : Perched Near Prior High After Finding Support at 10 WMA - 2/11/2021 |
View all notes |
Set NEW NOTE alert |
Company Profile |
SEC
News |
Chart |
Request a new note
C
A
S
I |
TEAM
-
NASDAQ
Atlassian Corp Plc Cl A
Comp Sftwr-Spec Enterprs
|
$252.80
|
+0.34
0.13% |
$257.01
|
608,346
42.22% of 50 DAV
50 DAV is 1,441,000
|
$256.05
-1.27%
|
10/12/2020
|
$193.77
|
PP = $199.60
|
|
MB = $209.58
|
Most Recent Note - 2/8/2021 5:17:07 PM
G - Quietly touched a new high today. Rebounded impressively from a brief dip below its 50 DMA line ($232.94). Recent low ($208.62 on 1/27/21) defines important near-term support to watch. Its current Relative Strength Rating is 72, below the +80 minimum guideline for buy candidates. Fundamental concerns remain after earnings rose +0% on +23% sales revenues for the Dec '20 quarter versus the year ago period, its 2nd comparison below the +25% minimum earnings guideline (C criteria). See the latest FSU analysis for more details and a new annotated graph.
>>> FEATURED STOCK ARTICLE : Quietly Touched a New High Despite Fundamental Concerns Noted - 2/8/2021 |
View all notes |
Set NEW NOTE alert |
Company Profile |
SEC
News |
Chart |
Request a new note
C
A
S
I |
SHOP
-
NYSE
Shopify Inc Cl A
Computer Sftwr-Enterprse
|
$1,463.31
|
+0.89
0.06% |
$1,481.97
|
918,687
70.02% of 50 DAV
50 DAV is 1,312,000
|
$1,499.75
-2.43%
|
2/2/2021
|
$1,218.72
|
PP = $1,285.28
|
|
MB = $1,349.54
|
Most Recent Note - 2/10/2021 1:00:36 PM
G - Extended from any sound base, it has rallied well above its "max buy" level and hit yet another new all-time high with above average volume behind today's 5th consecutive gain. Prior high ($1,285 on 12/22/20) defines important support to watch above its 50 DMA line ($1,164).
>>> FEATURED STOCK ARTICLE : Perched Within Striking Distance of New Pivot Point - 2/3/2021 |
View all notes |
Set NEW NOTE alert |
Company Profile |
SEC
News |
Chart |
Request a new note
C
A
S
I |
Symbol/Exchange
Company Name
Industry Group |
PRICE |
CHANGE
(%Change) |
Day High |
Volume
(% DAV)
(% 50 day avg vol) |
52 Wk Hi
% From Hi |
Featured
Date |
Price
Featured |
Pivot Featured |
|
Max Buy |
YETI
-
NYSE
Yeti Holdings Inc
Leisure-Products
|
$71.78
|
-6.22
-7.97% |
$75.47
|
3,428,959
256.66% of 50 DAV
50 DAV is 1,336,000
|
$80.89
-11.26%
|
11/5/2020
|
$57.25
|
PP = $55.14
|
|
MB = $57.90
|
Most Recent Note - 2/11/2021 1:39:59 PM
G - Reported Dec '20 quarterly earnings +72% on +26% sales revenues versus the year ago period. Gapped down today testing the 50 DMA line ($70.66) with a volume-driven loss. It has not formed a sound base of sufficient length. Prior low ($64.80) on 2/01/21) defines important near term support below its 50 DMA line.
>>> FEATURED STOCK ARTICLE : 50-Day Moving Average and Prior Lows Define Near-Term Support - 1/22/2021 |
View all notes |
Set NEW NOTE alert |
Company Profile |
SEC
News |
Chart |
Request a new note
C
A
S
I |
BJ
-
NYSE
BJs Wholesale Club Hldgs
Retail-DiscountandVariety
|
$42.86
|
-0.83
-1.90% |
$44.20
|
1,202,691
50.41% of 50 DAV
50 DAV is 2,385,800
|
$50.18
-14.59%
|
1/28/2021
|
$44.74
|
PP = $47.56
|
|
MB = $49.94
|
Most Recent Note - 2/10/2021 5:48:18 PM
Y - Volume totals have been cooling while stubbornly holding its ground. The prior low and 50 DMA line define important near term support in the $40 area.
>>> FEATURED STOCK ARTICLE : Pulled Back After Breakout Capped 7-Day Winning Streak - 1/28/2021 |
View all notes |
Set NEW NOTE alert |
Company Profile |
SEC
News |
Chart |
Request a new note
C
A
S
I |
DOCU
-
NASDAQ
Docusign Inc
Computer Sftwr-Enterprse
|
$256.27
|
+1.02
0.40% |
$259.04
|
1,381,502
38.59% of 50 DAV
50 DAV is 3,580,000
|
$290.23
-11.70%
|
1/12/2021
|
$253.50
|
PP = $256.10
|
|
MB = $268.91
|
Most Recent Note - 2/9/2021 5:34:06 PM
Y - Wedging higher since its rebound above the 50 DMA line ($238) helped its outlook improve. Faces little resistance due to overhead supply. The prior low ($216.50 on 1/04/21) defines the next important support to watch. Fundamentals remain strong. See the latest FSU analysis for more details and a new annotated graph.
>>> FEATURED STOCK ARTICLE : Consolidating Back Above 50-Day Moving Average Near Prior High - 2/9/2021 |
View all notes |
Set NEW NOTE alert |
Company Profile |
SEC
News |
Chart |
Request a new note
C
A
S
I |
DT
-
NYSE
Dynatrace Inc
Computer Sftwr-Enterprse
|
$54.00
|
-0.48
-0.88% |
$55.30
|
1,319,794
53.48% of 50 DAV
50 DAV is 2,468,000
|
$56.77
-4.88%
|
2/4/2021
|
$51.39
|
PP = $48.95
|
|
MB = $51.40
|
Most Recent Note - 2/10/2021 5:52:49 PM
G - Volume totals are cooling while perched near its all-time high following a streak of volume-driven gains. Prior highs in the $48 area define initial support to watch above its 50 DMA line. Fundamentals remain strong after it reported Dec '20 earnings +70% on +28% sales revenues versus the year ago period.
>>> FEATURED STOCK ARTICLE : Breakout Action Returns Dynatrace to Featured Stocks List - 2/4/2021 |
View all notes |
Set NEW NOTE alert |
Company Profile |
SEC
News |
Chart |
Request a new note
C
A
S
I |
QTWO
-
NYSE
Q2 Holdings Inc
Computer Sftwr-Financial
|
$144.73
|
-1.01
-0.69% |
$147.38
|
298,508
60.18% of 50 DAV
50 DAV is 496,000
|
$148.56
-2.58%
|
11/12/2020
|
$105.14
|
PP = $106.54
|
|
MB = $111.87
|
Most Recent Note - 2/8/2021 3:03:02 PM
G - Inching to another new high with today's gain, getting more extended from any sound base. Its 50 DMA line ($126.22) defines important near term support to watch on pullbacks.
>>> FEATURED STOCK ARTICLE : Perched Near All-Time High Stubbornly Holding Ground - 1/26/2021 |
View all notes |
Set NEW NOTE alert |
Company Profile |
SEC
News |
Chart |
Request a new note
C
A
S
I |
Symbol/Exchange
Company Name
Industry Group |
PRICE |
CHANGE
(%Change) |
Day High |
Volume
(% DAV)
(% 50 day avg vol) |
52 Wk Hi
% From Hi |
Featured
Date |
Price
Featured |
Pivot Featured |
|
Max Buy |
AXON
-
NASDAQ
Axon Enterprise Inc
Security/Sfty
|
$203.51
|
+15.53
8.26% |
$212.37
|
2,634,103
434.67% of 50 DAV
50 DAV is 606,000
|
$190.04
7.09%
|
12/22/2020
|
$127.84
|
PP = $130.51
|
|
MB = $137.04
|
Most Recent Note - 2/11/2021 12:47:22 PM
G - Very extended from any sound base, it spiked to a new high with much heavier volume behind today's 10th consecutive gain. Its 50 DMA line ($143.59) and prior high ($134) define important support to watch on pullbacks. Fundamentals remain strong. Formerly traded under the ticker symbol AAXN where prior notes and detailed analysis may be reviewed.
>>> FEATURED STOCK ARTICLE : Extended From Prior Base Following Streak fo Volume-Driven Gains - 2/2/2021 |
View all notes |
Set NEW NOTE alert |
Company Profile |
SEC
News |
Chart |
Request a new note
C
A
S
I |
|
|
|
THESE ARE NOT BUY RECOMMENDATIONS!
Comments contained in the body of this report are technical
opinions only. The material herein has been obtained
from sources believed to be reliable and accurate, however,
its accuracy and completeness cannot be guaranteed.
This site is not an investment advisor, hence it does
not endorse or recommend any securities or other investments.
Any recommendation contained in this report may not
be suitable for all investors and it is not to be deemed
an offer or solicitation on our part with respect to
the purchase or sale of any securities. All trademarks,
service marks and trade names appearing in this report
are the property of their respective owners, and are
likewise used for identification purposes only.
This report is a service available
only to active Paid Premium Members.
You may opt-out of receiving report notifications
at any time. Questions or comments may be submitted
by writing to Premium Membership Services 665 S.E. 10 Street, Suite 201 Deerfield Beach, FL 33441-5634 or by calling 1-800-965-8307
or 954-785-1121.
|
|
|