You are not logged in.
This means you
CAN ONLY VIEW reports that were published prior to Friday, April 4, 2025.
You
MUST UPGRADE YOUR MEMBERSHIP if you want to see any current reports.
AFTER MARKET UPDATE - THURSDAY, FEBRUARY 9TH, 2017
Previous After Market Report Next After Market Report >>>
|
|
|
|
DOW |
+118.06 |
20,172.40 |
+0.59% |
|
Volume |
994,982,780 |
-1% |
|
Volume |
1,754,232,440 |
-1% |
|
NASDAQ |
+32.73 |
5,715.18 |
+0.58% |
|
Advancers |
1,918 |
66% |
|
Advancers |
2,113 |
72% |
|
S&P 500 |
+13.20 |
2,307.87 |
+0.58% |
|
Decliners |
997 |
34% |
|
Decliners |
803 |
28% |
|
Russell 2000 |
+19.79 |
1,378.53 |
+1.46% |
|
52 Wk Highs |
164 |
|
|
52 Wk Highs |
192 |
|
|
S&P 600 |
+13.62 |
842.77 |
+1.64% |
|
52 Wk Lows |
7 |
|
|
52 Wk Lows |
28 |
|
|
 |
Major Indices Rally for New Record Highs
Kenneth J. Gruneisen - Passed the CAN SLIM® Master's Exam
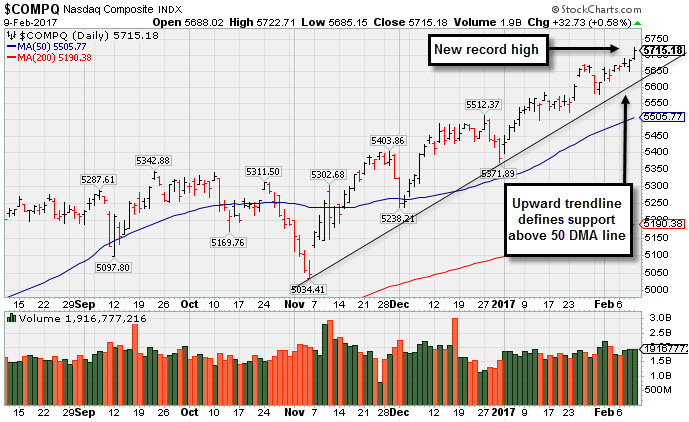
Stocks finished higher on Thursday. The Dow was up 118 points to 20172. The S&P 500 added 13 points to 2307 and the Nasdaq Composite gained 32 points to 5715. Volume totals were lighter than the prior session totals on the NYSE and on the Nasdaq exchange. Advancers led decliners by more than a 2-1 margin the NYSE and on the Nasdaq exchange. There were 52 high-ranked companies from the Leaders List that made new 52-week highs and were listed on the BreakOuts Page, versus the total of 27 on the prior session. New 52-week highs totals expanded and solidly outnumbered new 52-week lows on both the NYSE and the Nasdaq exchange.
PICTURED: The Nasdaq Composite Index hit new highs with a third consecutive gain. Its upward trendline defines near-term support above its 50-day moving average (DMA) line.
Leadership remains healthy as the major averages' (M criteria) have maintained an upward trend. New buying efforts should only be made in candidates with superior fundamental and technical characteristics. The Featured Stocks Page lists noteworthy high-ranked leaders.
The major averages advanced on Thursday, notching fresh record highs after President Trump promised an announcement in the next few weeks that will be "phenomenal" in terms of tax. In a meeting with U.S. airline executives, Trump said that lowering the overall tax burden on American business is "big league." On the data front, wholesale inventories rose 1% in December, in-line with expectations. Separately, initial jobless claims came in at 234,000, the lowest level since November.
Nine of 11 sectors in the S&P 500 ended in positive territory. Financials caught a boost amid the Trump commentary with Bank of America (BAC +1.99%) posting a gain. Prudential (PRU +3.01%) rose after solid quarterly earnings results. Materials shares fluctuated with Cliff's Natural Resources (CLF +19.43%). In the consumer space, Kellogg (K +4.01%) rose as the firm topped profit expectations. Shares of Coca-Cola (KO -1.83%) ended lower after posting its seventh straight quarterly revenue drop. Twitter (TWTR -12.34%) was a notable decliner as the company reported its lowest quarterly revenue growth since going public.
Treasuries declined with the benchmark 10-year note down 21/32 to yield 2.39%. In commodities, NYMEX WTI crude added 1.3% to $53.04/barrel. In FOREX, the Dollar Index gained 0.3%. |
 Kenneth J. Gruneisen started out as a licensed stockbroker in August 1987, a couple of months prior to the historic stock market crash that took the Dow Jones Industrial Average down -22.6% in a single day. He has published daily fact-based fundamental and technical analysis on high-ranked stocks online for two decades. Through FACTBASEDINVESTING.COM, Kenneth provides educational articles, news, market commentary, and other information regarding proven investment systems that work in good times and bad.
Comments contained in the body of this report are technical opinions only and are not necessarily those of Gruneisen Growth Corp. The material herein has been obtained from sources believed to be reliable and accurate, however, its accuracy and completeness cannot be guaranteed. Our firm, employees, and customers may effect transactions, including transactions contrary to any recommendation herein, or have positions in the securities mentioned herein or options with respect thereto. Any recommendation contained in this report may not be suitable for all investors and it is not to be deemed an offer or solicitation on our part with respect to the purchase or sale of any securities. |
|
 |
Financial, Retail, Energy, and Most Tech Groups Rose
Kenneth J. Gruneisen - Passed the CAN SLIM® Master's Exam
The Retail Index ($RLX +0.78%), Broker/Dealer Index ($XBD +1.57%) and the Bank Index ($BKX +1.56%) boosted the major indices on Thursday. The tech sector was mixed as the Biotechnology Index ($BTK +1.45%) and the Networking Index ($NWX +0.83%) both rose but the Semiconductor Index ($SOX -0.86%) was a laggard as it fell. The Oil Services Index ($OSX +0.40%) and the Integrated Oil Index ($XOI +0.93%) posted gains, meanwhile the Gold & Silver Index ($XAU -2.80%) was a standout decliner. Charts courtesy www.stockcharts.com
 PICTURED: The Semiconductor Index ($SOX -0.86%) pulled back from its record high.
| Oil Services |
$OSX |
178.20 |
+0.70 |
+0.39% |
-3.04% |
| Integrated Oil |
$XOI |
1,221.72 |
+11.21 |
+0.93% |
-3.65% |
| Semiconductor |
$SOX |
963.81 |
-8.33 |
-0.86% |
+6.33% |
| Networking |
$NWX |
455.54 |
+3.76 |
+0.83% |
+2.12% |
| Broker/Dealer |
$XBD |
221.39 |
+3.42 |
+1.57% |
+7.85% |
| Retail |
$RLX |
1,378.52 |
+10.88 |
+0.78% |
+4.71% |
| Gold & Silver |
$XAU |
94.02 |
-2.70 |
-2.79% |
+19.22% |
| Bank |
$BKX |
92.92 |
+1.42 |
+1.56% |
+1.26% |
| Biotech |
$BTK |
3,341.92 |
+47.82 |
+1.45% |
+8.68% |
|
|
|
 |
Mostly Bullish Action Continues Since Latest Earnings Report
Kenneth J. Gruneisen - Passed the CAN SLIM® Master's Exam
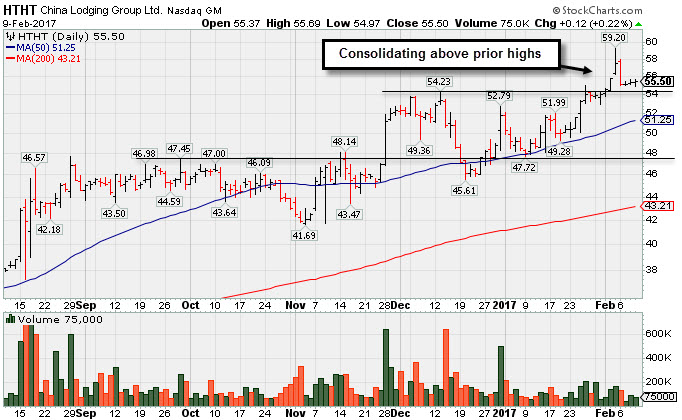
China Lodging Group Ads (HTHT +$0.12 or +0.22% to $55.50) is consolidating above prior highs after hitting a new all-time high on 2/03/17. Prior highs in the $54 area define near-term support above its 50-day moving average (DMA) line ($51.25). It has been repeatedly noted with caution in prior reports - "Reported earnings +10% on +6% sales revenues for the Sep '16 quarter, below the +25% minimum earnings guideline (C criteria), raising concerns."
HTHT is up +42.8% since first featured in yellow in the 7/13/16 mid-day report (read here). It was last shown in this FSU section on 1/06/17 with an annotated graph under the headline, "Slump Below 'Max Buy' Level But Fundamental Concerns Were Raised". Disciplined followers of the fact-based investment system know that buying efforts should only be made in fundamentally superior stocks and only after after a technical buy signal has been triggered. Selling should not be based upon a change fundamentals, but should strictly be based upon the technical action in a stock or market. Therefore, those investors will solid profits in HTHT may still be electing to give it the benefit of the doubt until any worrisome technical sell signals raise concerns.
The number of top-rated funds owing its shares rose from 87 in Sep '15 to 154 in Dec '16, a reassuring sign concerning the I criteria. Currently the high-ranked Leisure- Lodging firm has a B Timeliness rating and a D Sponsorship rating. Its small supply of 27 million shares (S criteria) in the public float may contribute to greater price volatility in the event of institutional buying or selling.
|
|
|
Color Codes Explained :
Y - Better candidates highlighted by our
staff of experts.
G - Previously featured
in past reports as yellow but may no longer be buyable under the
guidelines.
***Last / Change / Volume data in this table is the closing quote data***
Symbol/Exchange
Company Name
Industry Group |
PRICE |
CHANGE
(%Change) |
Day High |
Volume
(% DAV)
(% 50 day avg vol) |
52 Wk Hi
% From Hi |
Featured
Date |
Price
Featured |
Pivot Featured |
|
Max Buy |
THO
-
NYSE
Thor Industries Inc
AUTOMOTIVE - Recreational Vehicles
|
$110.65
|
+1.90
1.75% |
$110.80
|
715,642
101.37% of 50 DAV
50 DAV is 706,000
|
$109.85
0.73%
|
1/24/2017
|
$100.52
|
PP = $108.45
|
|
MB = $113.87
|
Most Recent Note - 2/8/2017 6:57:23 PM
Y - Gapped up and rallied above its pivot point with today's gain backed by very near the +40% above average volume needed to trigger a proper technical buy signal.
>>> FEATURED STOCK ARTICLE : Rose From Support at 50-Day Moving Average Line - 1/24/2017 |
View all notes |
Set NEW NOTE alert |
Company Profile |
SEC
News |
Chart |
Request a new note
C
A
S
I |
CSFL
-
NASDAQ
Centerstate Banks Inc
Banks-Southeast
|
$24.47
|
+0.34
1.41% |
$24.51
|
293,144
95.80% of 50 DAV
50 DAV is 306,000
|
$26.30
-6.96%
|
10/10/2016
|
$18.20
|
PP = $18.37
|
|
MB = $19.29
|
Most Recent Note - 2/6/2017 5:54:12 PM
G - Consolidating after gapping up on the prior session finding support near its 50 DMA line. Completed a new Public Offering of shares on 1/10/17. See the latest FSU analysis for more details and a new annotated graph.
>>> FEATURED STOCK ARTICLE : Found Support Near 50-Day Average Following Offering - 2/6/2017 |
View all notes |
Set NEW NOTE alert |
Company Profile |
SEC
News |
Chart |
Request a new note
C
A
S
I |
IESC
-
NASDAQ
I E S Holdings Inc
Bldg-Maintenance and Svc
|
$21.15
|
+2.55
13.71% |
$21.95
|
252,724
336.97% of 50 DAV
50 DAV is 75,000
|
$23.00
-8.04%
|
11/23/2016
|
$19.35
|
PP = $18.26
|
|
MB = $19.17
|
 Most Recent Note - 2/9/2017 12:14:27 PM
G - Reported Dec '16 quarterly earnings -33% on +27% sales revenues, below the +25% minimum earnings guideline (C criteria) raising fundamental concerns. Rallying above its 50 DMA line with a big volume-driven gain today helping its technical stance improve. Prior low ($18.05 on 1/18/17) defines important support near prior highs.
>>> FEATURED STOCK ARTICLE : Violated 50-Day Moving Average Line and Now Testing Prior Highs - 1/19/2017 |
View all notes |
Set NEW NOTE alert |
Company Profile |
SEC
News |
Chart |
Request a new note
C
A
S
I |
BERY
-
NYSE
Berry Plastics Group Inc
CONSUMER NON-DURABLES - Packaging and Containers
|
$48.96
|
-0.46
-0.93% |
$49.57
|
1,386,107
97.75% of 50 DAV
50 DAV is 1,418,000
|
$52.97
-7.57%
|
11/30/2016
|
$50.26
|
PP = $46.47
|
|
MB = $48.79
|
Most Recent Note - 2/7/2017 5:38:04 PM
G - Slumped below its 50 DMA line with damaging volume-driven losses raising concerns. Recent lows in the $48.50 area define near-term support where a violation would trigger a more worrisome technical sell signal. Reported earnings +43% on -7% sales revenues for the Dec '16 quarter. See the latest FSU analysis for more details and a new annotated graph.
>>> FEATURED STOCK ARTICLE : Recent 50-Day Violation Raised Concerns - 2/7/2017 |
View all notes |
Set NEW NOTE alert |
Company Profile |
SEC
News |
Chart |
Request a new note
C
A
S
I |
EVR
-
NYSE
Evercore Partners Inc
FINANCIAL SERVICES - Investment Banking
|
$79.00
|
+1.50
1.94% |
$79.00
|
423,220
95.53% of 50 DAV
50 DAV is 443,000
|
$81.75
-3.36%
|
1/5/2017
|
$71.40
|
PP = $72.07
|
|
MB = $75.67
|
Most Recent Note - 2/7/2017 12:21:50 PM
G - Pulling back today after 5 consecutive volume-driven gains, getting very extended from its prior base. Recently reported Dec '16 quarterly earnings +17% on +9% sales revenues, below the +25% minimum earnings guideline (C criteria), raising fundamental concerns.
>>> FEATURED STOCK ARTICLE : Perched Near All-Time High Building New Flat Base - 1/5/2017 |
View all notes |
Set NEW NOTE alert |
Company Profile |
SEC
News |
Chart |
Request a new note
C
A
S
I |
Symbol/Exchange
Company Name
Industry Group |
PRICE |
CHANGE
(%Change) |
Day High |
Volume
(% DAV)
(% 50 day avg vol) |
52 Wk Hi
% From Hi |
Featured
Date |
Price
Featured |
Pivot Featured |
|
Max Buy |
HTHT
-
NASDAQ
China Lodging Group Ads
LEISURE - Lodging
|
$55.50
|
+0.12
0.22% |
$55.69
|
75,000
45.45% of 50 DAV
50 DAV is 165,000
|
$59.20
-6.25%
|
9/29/2016
|
$46.12
|
PP = $47.82
|
|
MB = $50.21
|
Most Recent Note - 2/9/2017 6:42:45 PM
G - Consolidating above prior highs in the $54 area defining near-term support above its 50 DMA line. Repeatedly noted with caution in prior reports - "Reported earnings +10% on +6% sales revenues for the Sep '16 quarter, below the +25% minimum earnings guideline (C criteria), raising concerns." See the latest FSU analysis for more details and a new annotated graph.
>>> FEATURED STOCK ARTICLE : Mostly Bullish Action Continues Since Latest Earnings Report - 2/9/2017 |
View all notes |
Set NEW NOTE alert |
Company Profile |
SEC
News |
Chart |
Request a new note
C
A
S
I |
LMAT
-
NASDAQ
Lemaitre Vascular Inc
Medical-Products
|
$23.12
|
+0.33
1.45% |
$23.24
|
60,951
53.00% of 50 DAV
50 DAV is 115,000
|
$27.04
-14.49%
|
12/22/2016
|
$24.99
|
PP = $25.09
|
|
MB = $26.34
|
Most Recent Note - 2/6/2017 6:08:17 PM
G - Sank further below its 50 DMA line with above average volume behind today's loss. Its Relative Strength Rating has fallen to 79, below the 80+ minimum guideline for buy candidates.A rebound above its 50 DMA line ($23.82) is needed for its outlook to improve.
>>> FEATURED STOCK ARTICLE : Concerns Increase While Lingering Below 50-Day Moving Average - 1/27/2017 |
View all notes |
Set NEW NOTE alert |
Company Profile |
SEC
News |
Chart |
Request a new note
C
A
S
I |
BEAT
-
NASDAQ
BioTelemetry Inc
Medical-Services
|
$23.80
|
+0.05
0.21% |
$24.05
|
100,287
35.82% of 50 DAV
50 DAV is 280,000
|
$24.45
-2.66%
|
12/19/2016
|
$22.91
|
PP = $21.78
|
|
MB = $22.87
|
Most Recent Note - 2/9/2017 6:47:22 PM
G - Forming a saucer-with-handle base above its prior base, holding its ground stubbornly while perched at multi-year highs and volume totals have been cooling. Its 50 DMA line and prior lows define important near-term support.
>>> FEATURED STOCK ARTICLE : Volume Totals Cooling While Consolidating Above Prior Highs - 1/10/2017 |
View all notes |
Set NEW NOTE alert |
Company Profile |
SEC
News |
Chart |
Request a new note
C
A
S
I |
PATK
-
NASDAQ
Patrick Industries Inc
WHOLESALE - Building Materials Wholesale
|
$85.45
|
+3.45
4.21% |
$85.50
|
121,825
100.68% of 50 DAV
50 DAV is 121,000
|
$83.50
2.34%
|
11/29/2016
|
$72.45
|
PP = $69.63
|
|
MB = $73.11
|
Most Recent Note - 2/9/2017 6:54:00 PM
G - Gapped up today and rallied for new all-time highs, getting more extended from its prior base. Its 50 DMA line and recent lows in the $76 area define support to watch.
>>> FEATURED STOCK ARTICLE : Perched Near All-Time High Extended From Prior Base - 1/31/2017 |
View all notes |
Set NEW NOTE alert |
Company Profile |
SEC
News |
Chart |
Request a new note
C
A
S
I |
ESNT
-
NYSE
Essent Group Ltd
Finance-MrtgandRel Svc
|
$36.24
|
-0.05
-0.14% |
$36.65
|
690,322
105.72% of 50 DAV
50 DAV is 653,000
|
$36.48
-0.64%
|
1/25/2017
|
$34.09
|
PP = $34.04
|
|
MB = $35.74
|
Most Recent Note - 2/9/2017 6:48:55 PM
G - Perched above its "max buy" level after wedging higher and its color code was changed to green. Its 50 DMA line ($33) defines important near-term support above prior lows in the $31.50 area.
>>> FEATURED STOCK ARTICLE : Twice Average Volume Behind Big Breakout Gain - 1/25/2017 |
View all notes |
Set NEW NOTE alert |
Company Profile |
SEC
News |
Chart |
Request a new note
C
A
S
I |
Symbol/Exchange
Company Name
Industry Group |
PRICE |
CHANGE
(%Change) |
Day High |
Volume
(% DAV)
(% 50 day avg vol) |
52 Wk Hi
% From Hi |
Featured
Date |
Price
Featured |
Pivot Featured |
|
Max Buy |
ANET
-
NYSE
Arista Networks Inc
TELECOMMUNICATIONS - Communication Equipment
|
$97.81
|
+0.35
0.36% |
$98.98
|
461,118
64.13% of 50 DAV
50 DAV is 719,000
|
$103.00
-5.04%
|
12/30/2016
|
$96.77
|
PP = $99.00
|
|
MB = $103.95
|
Most Recent Note - 2/6/2017 5:58:26 PM
G - Consolidating near its 50 DMA line ($95.60) with volume totals cooling while rebounding after a damaging gap down on 1/17/17. Subsequent losses on above average volume would raise greater concerns.
>>> FEATURED STOCK ARTICLE : Technical Damages Raised Concern and Triggered Technical Sell Signal - 1/18/2017 |
View all notes |
Set NEW NOTE alert |
Company Profile |
SEC
News |
Chart |
Request a new note
C
A
S
I |
VBTX
-
NASDAQ
Veritex Holdings Inc
BANKING - Regional - Southwest Banks
|
$27.61
|
-0.28
-1.00% |
$28.18
|
55,574
61.07% of 50 DAV
50 DAV is 91,000
|
$29.33
-5.86%
|
1/23/2017
|
$27.30
|
PP = $27.87
|
|
MB = $29.26
|
Most Recent Note - 2/9/2017 6:51:53 PM
Y - Pulled back with lighter volume 4 days in a row since clinching a technical buy signal with its volume-driven gain on 2/03/17. Prior highs in the $27 area define initial support above its 50 DMA line ($25.58).
>>> FEATURED STOCK ARTICLE : Challenged Highs But Ended in Bottom Third of Intra-day Range - 1/23/2017 |
View all notes |
Set NEW NOTE alert |
Company Profile |
SEC
News |
Chart |
Request a new note
C
A
S
I |
SFBS
-
NASDAQ
Servisfirst Bancshares
BANKING - Regional - Southeast Banks
|
$40.80
|
+1.14
2.87% |
$40.86
|
219,267
86.67% of 50 DAV
50 DAV is 253,000
|
$41.16
-0.87%
|
7/19/2016
|
$26.64
|
PP = $26.41
|
|
MB = $27.73
|
Most Recent Note - 2/6/2017 6:11:41 PM
G - Holding its ground near all-time highs. Recently reported earnings +8% on +20% sales revenues for the Dec '16 quarter, below the +25% minimum guideline (C criteria), raising fundamental concerns. Its 50 DMA line ($37.52) defines important near-term support above recent lows in the $36 area. Subsequent violations would trigger technical sell signals.
>>> FEATURED STOCK ARTICLE : Stubbornly Holding Ground Near Highs - 1/12/2017 |
View all notes |
Set NEW NOTE alert |
Company Profile |
SEC
News |
Chart |
Request a new note
C
A
S
I |
LITE
-
NASDAQ
Lumentum Holdings Inc
TELECOMMUNICATIONS - Cables / Satalite Equipment
|
$46.60
|
+0.75
1.64% |
$49.40
|
3,645,459
341.98% of 50 DAV
50 DAV is 1,066,000
|
$46.45
0.32%
|
2/8/2017
|
$44.60
|
PP = $44.80
|
|
MB = $47.04
|
Most Recent Note - 2/9/2017 12:19:19 PM
G - Rallying further into new high territory and above its "max buy" level with today's 3rd consecutive volume-driven gain and its color code is changed to green. Finished strong after highlighted in yellow with new pivot point cited based on its 12/09/16 high plus 10 cents. The gain and strong finish above the pivot point triggered a convincing technical buy signal. Reported earnings +73% on +21% sales revenues for the Dec '16 quarter and gapped up hitting a new high. Volume and volatility often increase near earnings news. Rebound above its 50 DMA line with a volume-driven gain on 2/07/17 helping its outlook improve. Relative Strength rating has improved from 81 to 94 since 1/05/17 when dropped from the Featured Stocks list, and it stayed well above its 200 DMA line. See the latest FSU analysis for more details and an annotated graph.
>>> FEATURED STOCK ARTICLE : Gap Up Gain and Strong Finish Triggered Technical Buy Signal - 2/8/2017 |
View all notes |
Set NEW NOTE alert |
Company Profile |
SEC
News |
Chart |
Request a new note
C
A
S
I |
LCII
-
NYSE
L C I Industries
MATERIALS and CONSTRUCTION - General Building Materials
|
$112.50
|
+2.10
1.90% |
$115.30
|
291,239
166.42% of 50 DAV
50 DAV is 175,000
|
$117.15
-3.97%
|
11/29/2016
|
$106.29
|
PP = $101.00
|
|
MB = $106.05
|
Most Recent Note - 2/6/2017 6:04:54 PM
G - Sputtering just below its 50 DMA line ($109.10). Losses leading to deterioration below prior lows ($105.05 on 1/20/17) may trigger technical sell signals. Recently, Drew Industries (DW) announced a new name LCI Industries (LCII).
>>> FEATURED STOCK ARTICLE : Distributional Action While Retreating From Highs - 1/30/2017 |
View all notes |
Set NEW NOTE alert |
Company Profile |
SEC
News |
Chart |
Request a new note
C
A
S
I |
Symbol/Exchange
Company Name
Industry Group |
PRICE |
CHANGE
(%Change) |
Day High |
Volume
(% DAV)
(% 50 day avg vol) |
52 Wk Hi
% From Hi |
Featured
Date |
Price
Featured |
Pivot Featured |
|
Max Buy |
|
|
|
THESE ARE NOT BUY RECOMMENDATIONS!
Comments contained in the body of this report are technical
opinions only. The material herein has been obtained
from sources believed to be reliable and accurate, however,
its accuracy and completeness cannot be guaranteed.
This site is not an investment advisor, hence it does
not endorse or recommend any securities or other investments.
Any recommendation contained in this report may not
be suitable for all investors and it is not to be deemed
an offer or solicitation on our part with respect to
the purchase or sale of any securities. All trademarks,
service marks and trade names appearing in this report
are the property of their respective owners, and are
likewise used for identification purposes only.
This report is a service available
only to active Paid Premium Members.
You may opt-out of receiving report notifications
at any time. Questions or comments may be submitted
by writing to Premium Membership Services 665 S.E. 10 Street, Suite 201 Deerfield Beach, FL 33441-5634 or by calling 1-800-965-8307
or 954-785-1121.
|
|
|