You are not logged in.
This means you
CAN ONLY VIEW reports that were published prior to Friday, April 18, 2025.
You
MUST UPGRADE YOUR MEMBERSHIP if you want to see any current reports.
AFTER MARKET UPDATE - THURSDAY, DECEMBER 22ND, 2022
Previous After Market Report Next After Market Report >>>
|
|
|
|
DOW |
-348.99 |
33,027.49 |
-1.05% |
|
Volume |
823,300,780 |
+0% |
|
Volume |
5,046,640,100 |
+16% |
|
NASDAQ |
-233.25 |
10,476.12 |
-2.18% |
|
Advancers |
670 |
22% |
|
Advancers |
1,445 |
32% |
|
S&P 500 |
-56.05 |
3,822.39 |
-1.45% |
|
Decliners |
2,369 |
78% |
|
Decliners |
3,095 |
68% |
|
Russell 2000 |
-22.85 |
1,754.09 |
-1.29% |
|
52 Wk Highs |
47 |
|
|
52 Wk Highs |
96 |
|
|
S&P 600 |
-14.34 |
1,153.05 |
-1.23% |
|
52 Wk Lows |
201 |
|
|
52 Wk Lows |
484 |
|
|
The market is in an uptrend under pressure (M criteria) and again showing the threatening look of a more serious market correction. Thin leadership has become a warning sign that the sputtering rally is lacking what it takes to be sustained.
|
 |
Breadth Negative as Indices Slumped With Higher Volume
Kenneth J. Gruneisen - Passed the CAN SLIM® Master's Exam
The Dow lost 348 points, while the technology heavy Nasdaq Composite declined 2.2%. The S&P 500 decreased 1.5% with all S&P sectors finishing in negative territory. Volume totals were higher than the prior session on the NYSE and on the Nasdaq exchange. Decliners led advancers by more than a 3-1 margin on the NYSE and by 2-1 on the Nasdaq exchange. Leadership thinned as there were only 2 high-ranked companies from the Leaders List that hit new 52-week highs and were listed on the BreakOuts Page, versus the total of 13 on the prior session. New 52-week lows totals swelled and solidly outnumbered shrinking new 52-week highs totals on the NYSE and on the Nasdaq exchange. The market is in an uptrend under pressure (M criteria) while showing the threatening look of a more serious market correction. Healthy leadership (new 52-week highs totals) must continue for the rally be productive, but new highs totals have recently contracted. Only stocks meeting all key-criteria of the fact-based investment system should be considered as buy candidates. Chart courtesy of www.stockcharts.com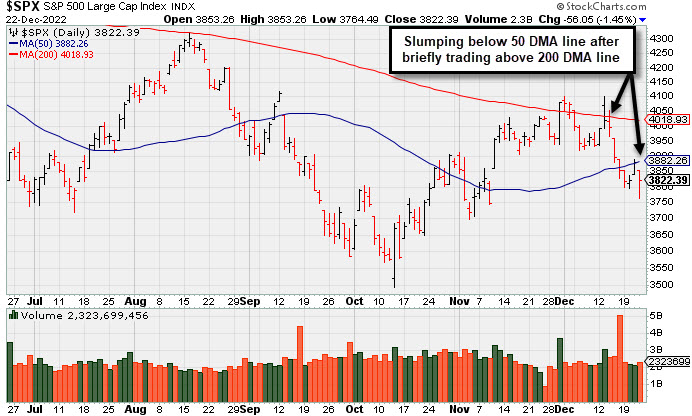 PICTURED: The S&P 500 Index has slumped below its 50-day moving average (DMA) line after briefly trading above its 200 DMA line. It is currently perched +8.7% above its October 13th low.
U.S. equities declined Thursday after today’s economic data came in better-than-expected. Initial jobless claims for the week ended December 17 increased by 2,000 from the previous week’s revised 214,000 print; however, last week’s reading still remains around historical lows as employers continue to hold on to workers despite the possibility of an economic slowdown. Meanwhile, the Commerce Department reported stronger-than-expected economic growth in its revised Gross Domestic Product (GDP) report for the third quarter. The economy grew by a seasonally adjusted 3.2%, snapping two previous quarters of contractions.
On the data front, third quarter personal consumption increased 2.3%, and core Personal Consumption Expenditures (PCE) increased 4.7%, beating analyst estimates of 1.7% and 4.6%, respectively. Also, Conference Board’s Leading Economic Index fell 1% in November, missing estimates of -0.5%.
Treasury yields increased as investors remain concerned the Federal Reserve (Fed) will continue raising rates, tipping the economy into a recession. The yield on the benchmark 10-year note gained one basis point (0.01%) to 3.68%, while the 30-year bond yield advanced one basis point (0.01%) to 3.74%. The yield on the more Fed-sensitive two-year note increased seven basis points (0.07%) to 4.28%. In commodities, West Texas Intermediate (WTI) crude dropped 0.2% to $78.15/barrel after a choppy day of trading as U.S. inventories shrunk by 5.9 million barrels last week, dropping below the five-year average. Elsewhere, traders are continuing to assess the recent sanctions on Russian oil as exports start to decrease.
|
 Kenneth J. Gruneisen started out as a licensed stockbroker in August 1987, a couple of months prior to the historic stock market crash that took the Dow Jones Industrial Average down -22.6% in a single day. He has published daily fact-based fundamental and technical analysis on high-ranked stocks online for two decades. Through FACTBASEDINVESTING.COM, Kenneth provides educational articles, news, market commentary, and other information regarding proven investment systems that work in good times and bad.
Comments contained in the body of this report are technical opinions only and are not necessarily those of Gruneisen Growth Corp. The material herein has been obtained from sources believed to be reliable and accurate, however, its accuracy and completeness cannot be guaranteed. Our firm, employees, and customers may effect transactions, including transactions contrary to any recommendation herein, or have positions in the securities mentioned herein or options with respect thereto. Any recommendation contained in this report may not be suitable for all investors and it is not to be deemed an offer or solicitation on our part with respect to the purchase or sale of any securities. |
|
 |
Semiconductor, Energy, and Retail Indexes Led Group Decliners
Kenneth J. Gruneisen - Passed the CAN SLIM® Master's Exam
The Retail Index ($RLX -2.08%), Broker/Dealer Index ($XBD -1.03%), and Bank Index ($BKX -0.45%) each lost ground and created a drag on the major averages. The Semiconductor Index ($SOX -4.20%) led the tech retreat while the Networking Index ($NWX -1.60%) also fell and the Biotech Index ($BTK +0.18%) eked out a tiny gain. Energy-linked shares had a negative bias as the Oil Services Index ($OSX -3.02%) and Integrated Oil Index ($XOI -2.53%) both outpaced the Gold & Silver Index ($XAU -0.68%) to the downside.
PICTURED: The Networking Index ($NWX -1.60%) has slumped below its 50-day ands 200-day moving average (DMA) lines after challenging its August high last week.
| Oil Services |
$OSX |
80.25 |
-2.50 |
-3.02% |
+52.21% |
| Integrated Oil |
$XOI |
1,726.03 |
-44.84 |
-2.53% |
+46.50% |
| Semiconductor |
$SOX |
2,533.33 |
-111.17 |
-4.20% |
-35.80% |
| Networking |
$NWX |
772.66 |
-12.53 |
-1.60% |
-20.43% |
| Broker/Dealer |
$XBD |
447.63 |
-4.67 |
-1.03% |
-8.06% |
| Retail |
$RLX |
2,733.78 |
-57.98 |
-2.08% |
-35.32% |
| Gold & Silver |
$XAU |
121.09 |
-0.83 |
-0.68% |
-8.58% |
| Bank |
$BKX |
98.83 |
-0.44 |
-0.45% |
-25.26% |
| Biotech |
$BTK |
5,366.93 |
+9.68 |
+0.18% |
-2.75% |
|
|
|
 |
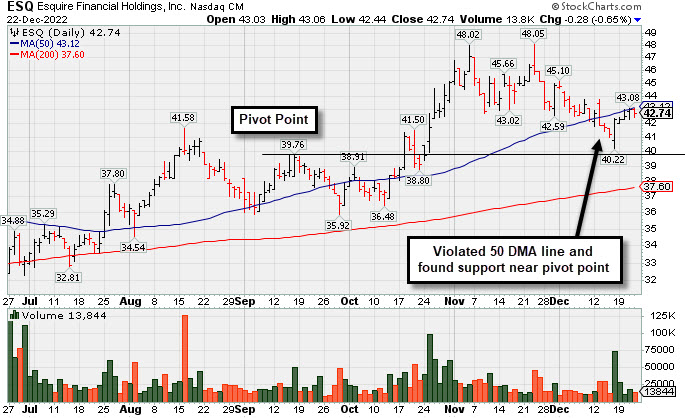
Found Support Recently Near Pivot Point and Prior Highs
Kenneth J. Gruneisen - Passed the CAN SLIM® Master's Exam
Esquire Financial Hldgs (ESQ -$0.28 or -0.65% to $42.74) managed a "positive reversal" on 12/16/22 finding support near the pivot point and prior highs. However, it has been meeting resistance when rebounding to its 50-day moving average (DMA) line ($43.16). Gains above the 50 DMA line are needed for its outlook to improve.
ESQ was highlighted in yellow with pivot point cited based on its 9/16/22 high plus 10 cents. It was last shown in this FSU section on 11/25/22 with an annotated graph under the headline, "Pulled Back Following "Negative Reversal" at All-Time High". This thinly-traded holding company in the Finance - Commercial Loans industry group has a small supply (S criteria) of only 6.5 million shares in the public float, which can contribute to greater price volatility in the event of institutional buying or selling. It completed its $14 IPO on 6/29/17. The number of top-rated funds owning its shares rose form 64 in Sep '21 to 171 in Sep '22, a reassuring sign concerning the I criteria. Its current Up/Down Volume Ratio of 1.5 is an unbiased indication its shares have been under accumulation over the past 50 days.
ESQ has a 98 Earnings Per Share Rating. It reported earnings +49% on +36% sales revenues for the Sep '22 quarter versus the year-ago period, the 5th consecutive quarterly comparison with an earnings increase above the +25% minimum guideline. Its annual earnings growth (A criteria) history has been strong.
|
|
|
Color Codes Explained :
Y - Better candidates highlighted by our
staff of experts.
G - Previously featured
in past reports as yellow but may no longer be buyable under the
guidelines.
***Last / Change / Volume data in this table is the closing quote data***
Symbol/Exchange
Company Name
Industry Group |
PRICE |
CHANGE
(%Change) |
Day High |
Volume
(% DAV)
(% 50 day avg vol) |
52 Wk Hi
% From Hi |
Featured
Date |
Price
Featured |
Pivot Featured |
|
Max Buy |
 ESQ
-
NASDAQ
ESQ
-
NASDAQ
Esquire Financial Hldgs
Finance-Commercial Loans
|
$42.74
|
-0.28
-0.65% |
$43.06
|
13,844
49.44% of 50 DAV
50 DAV is 28,000
|
$48.13
-11.20%
|
10/18/2022
|
$40.02
|
PP = $39.95
|
|
MB = $41.95
|
 Most Recent Note - 12/22/2022 6:32:13 PM
G - Managed a "positive reversal" on 12/16/22 finding support above its pivot point and near prior highs in the $41 area. Gains above the 50 DMA line are needed for its outlook to improve but that short-term average has been acting as resistance. See the latest FSU analysis for more details and a new annotated graph.
>>> FEATURED STOCK ARTICLE : Found Support Recently Near Pivot Point and Prior Highs - 12/22/2022 |
View all notes |
Set NEW NOTE alert |
Company Profile |
SEC
News |
Chart |
Request a new note
C
A
S
I |
CMC
-
NYSE
Commercial Metals Co
METALS and MINING - Steel and Iron
|
$48.96
|
-0.85
-1.71% |
$49.84
|
975,203
91.74% of 50 DAV
50 DAV is 1,063,000
|
$50.83
-3.68%
|
10/14/2022
|
$41.61
|
PP = $44.45
|
|
MB = $46.67
|
Most Recent Note - 12/21/2022 5:59:13 PM
G - Managed a best-ever close with today's gain backed by lighter than average volume. Consolidating above its 50 DMA line ($46.46) and prior highs in the $46 area defining important near-term support to watch. Fundamentals remain strong.
>>> FEATURED STOCK ARTICLE : Wedging Higher With Recent Gains Lacking Great Volume - 12/2/2022 |
View all notes |
Set NEW NOTE alert |
Company Profile |
SEC
News |
Chart |
Request a new note
C
A
S
I |
VRTX
-
NASDAQ
Vertex Pharmaceuticals
Medical-Biomed/Biotech
|
$293.92
|
+3.37
1.16% |
$294.34
|
1,164,413
76.56% of 50 DAV
50 DAV is 1,521,000
|
$324.75
-9.49%
|
10/24/2022
|
$308.47
|
PP = $306.05
|
|
MB = $321.35
|
Most Recent Note - 12/19/2022 5:48:44 PM
G - Gapped down today for a damaging loss triggering a technical sell signal and its color code is changed to green. Only a prompt rebound above the 50 DMA line ($307.76) would help its outlook improve. Recently reported Sep '22 quarterly earnings +14% on +18% sales revenues versus the year ago period, below the +25% minimum earnings guideline raising fundamental concerns (C criteria).
>>> FEATURED STOCK ARTICLE : Testing Support Near 50-Day Moving Average Line and Prior Pivot - 12/13/2022 |
View all notes |
Set NEW NOTE alert |
Company Profile |
SEC
News |
Chart |
Request a new note
C
A
S
I |
GPK
-
NYSE
Graphic Packaging Hldg
CONSUMER NON-DURABLES - Packaging and Containers
|
$21.95
|
+0.15
0.69% |
$21.99
|
4,194,113
136.53% of 50 DAV
50 DAV is 3,072,000
|
$24.07
-8.81%
|
10/25/2022
|
$22.75
|
PP = $24.17
|
|
MB = $25.38
|
Most Recent Note - 12/21/2022 12:29:31 PM
G - Consolidating near its 200 DMA line ($21.51) after losses raised concerns and triggered a technical sell signal. Color code was changed to green. A prompt rebound above the 50 DMA line is needed for its outlook to improve Fundamentals remain strong.
>>> FEATURED STOCK ARTICLE : Violated 50-Day Moving Average After Recently Failing to Break Out - 12/15/2022 |
View all notes |
Set NEW NOTE alert |
Company Profile |
SEC
News |
Chart |
Request a new note
C
A
S
I |
CBZ
-
NYSE
C B I Z Inc
Comml Svcs-Consulting
|
$47.21
|
-0.61
-1.28% |
$47.75
|
138,258
54.22% of 50 DAV
50 DAV is 255,000
|
$51.67
-8.63%
|
10/26/2022
|
$47.83
|
PP = $48.57
|
|
MB = $51.00
|
Most Recent Note - 12/19/2022 5:43:43 PM
G - Pulled back for a 4th consecutive loss and its color code is changed to green after violating its 50 DMA line ($47.83) triggering a technical sell signal. Recently reported Sep '22 quarterly earnings +24% on +28% sales revenues versus the year ago period. See the latest FSU analysis for more details and a new annotated graph.
>>> FEATURED STOCK ARTICLE : Fourth Straight Loss in Slump Violating 50-Day Moving Average Line - 12/19/2022 |
View all notes |
Set NEW NOTE alert |
Company Profile |
SEC
News |
Chart |
Request a new note
C
A
S
I |
Symbol/Exchange
Company Name
Industry Group |
PRICE |
CHANGE
(%Change) |
Day High |
Volume
(% DAV)
(% 50 day avg vol) |
52 Wk Hi
% From Hi |
Featured
Date |
Price
Featured |
Pivot Featured |
|
Max Buy |
ENPH
-
NASDAQ
Enphase Energy Inc
Energy-Solar
|
$298.87
|
-18.23
-5.75% |
$316.00
|
3,071,791
83.56% of 50 DAV
50 DAV is 3,676,000
|
$339.92
-12.08%
|
10/26/2022
|
$301.55
|
PP = $324.94
|
|
MB = $341.19
|
Most Recent Note - 12/22/2022 6:38:12 PM
Y - Promptly negated the prior session's solid gain with today's big loss on lighter (below average) volume while retesting support near its 50 DMA line ($297). Recent slump below its pivot point raised concerns. The 12/21/22 low ($290.06) defines important near-term support to watch. Fundamentals remain strong.
>>> FEATURED STOCK ARTICLE : Found Support With a Solid Gain at 50-Day Moving Average Line - 12/21/2022 |
View all notes |
Set NEW NOTE alert |
Company Profile |
SEC
News |
Chart |
Request a new note
C
A
S
I |
HRMY
-
NASDAQ
Harmony Biosciences Holdings
Medical-Biomed/Biotech
|
$57.25
|
+0.06
0.10% |
$57.47
|
191,943
40.09% of 50 DAV
50 DAV is 478,800
|
$62.09
-7.80%
|
11/1/2022
|
$55.31
|
PP = $57.23
|
|
MB = $60.09
|
Most Recent Note - 12/21/2022 6:07:42 PM
Y - Consolidating near its prior highs after briefly sputtering back below the pivot point. Its 50 DMA line ($55.94) and 11/17/22 low ($53.06) define important near-term support to watch.
>>> FEATURED STOCK ARTICLE : Harmony Still Hovering Near All-Time High - 11/28/2022 |
View all notes |
Set NEW NOTE alert |
Company Profile |
SEC
News |
Chart |
Request a new note
C
A
S
I |
CLH
-
NYSE
Clean Harbors Inc
Pollution Control
|
$113.61
|
-2.70
-2.32% |
$115.26
|
172,030
42.48% of 50 DAV
50 DAV is 405,000
|
$125.41
-9.41%
|
11/2/2022
|
$121.59
|
PP = $124.59
|
|
MB = $130.82
|
Most Recent Note - 12/21/2022 5:57:07 PM
G - Posted a 2nd consecutive gain today with lighter volume after damaging losses violated its 50 DMA line ($117.20) and the recent low ($114.86 on 11/29/22) triggering technical sell signals. Only a prompt rebound above the 50 DMA line would help its outlook improve. Fundamentals remain strong.
>>> FEATURED STOCK ARTICLE : Volume-Driven Losses Undercut 50-Day Moving Average - 11/29/2022 |
View all notes |
Set NEW NOTE alert |
Company Profile |
SEC
News |
Chart |
Request a new note
C
A
S
I |
DGII
-
NASDAQ
Digi International Inc
COMPUTER HARDWARE - Networking and Communication Dev
|
$37.11
|
-1.00
-2.62% |
$37.88
|
168,210
48.62% of 50 DAV
50 DAV is 346,000
|
$43.68
-15.04%
|
11/10/2022
|
$41.82
|
PP = $40.96
|
|
MB = $43.01
|
Most Recent Note - 12/22/2022 6:41:14 PM
It will be dropped from the Featured Stocks list tonight. Still sputtering below its 50 DMA line ($39) after damaging losses triggered a technical sell signal. Only a prompt rebound above the 50 DMA line would help its outlook improve. Fundamentals remain strong.
>>> FEATURED STOCK ARTICLE : Sputtering After Recently Wedging to New Highs - 12/6/2022 |
View all notes |
Set NEW NOTE alert |
Company Profile |
SEC
News |
Chart |
Request a new note
C
A
S
I |
GFF
-
NYSE
Griffon Corporation
MATERIALS and CONSTRUCTION - General Building Materials
|
$34.98
|
-0.02
-0.06% |
$35.00
|
310,854
79.10% of 50 DAV
50 DAV is 393,000
|
$37.69
-7.19%
|
11/10/2022
|
$34.13
|
PP = $35.02
|
|
MB = $36.77
|
Most Recent Note - 12/16/2022 6:38:10 PM
Y - Managed a "positive reversal" today after slumping near prior highs in the $34 area which define initial support to watch above its 50 DMA line ($33.19). Reported Sep '22 quarterly earnings +230% on +24% sales revenues versus the year ago period.
>>> FEATURED STOCK ARTICLE : No Meaningful Progress After Breakout 3 Weeks Ago - 12/7/2022 |
View all notes |
Set NEW NOTE alert |
Company Profile |
SEC
News |
Chart |
Request a new note
C
A
S
I |
Symbol/Exchange
Company Name
Industry Group |
PRICE |
CHANGE
(%Change) |
Day High |
Volume
(% DAV)
(% 50 day avg vol) |
52 Wk Hi
% From Hi |
Featured
Date |
Price
Featured |
Pivot Featured |
|
Max Buy |
ANET
-
NYSE
Arista Networks Inc
Computer-Networking
|
$120.37
|
-2.96
-2.40% |
$122.22
|
1,727,462
70.48% of 50 DAV
50 DAV is 2,451,000
|
$148.57
-18.98%
|
11/14/2022
|
$132.05
|
PP = $133.70
|
|
MB = $140.39
|
Most Recent Note - 12/22/2022 6:35:14 PM
It will be dropped from the Featured Stocks list tonight. Sputtering below its 50-day moving average (DMA) line after a spurt of losses. A rebound above the 50 DMA line ($124.77) is needed for its outlook to improve. Faces some resistance due to overhead supply up to the $148 level. Fundamentals remain are strong.
>>> FEATURED STOCK ARTICLE : Sputtered Back Below Prior High Hurting Outlook - 12/9/2022 |
View all notes |
Set NEW NOTE alert |
Company Profile |
SEC
News |
Chart |
Request a new note
C
A
S
I |
CPRX
-
NASDAQ
Catalyst Pharma Inc
Medical-Biomed/Biotech
|
$19.35
|
-0.15
-0.77% |
$19.70
|
2,451,328
103.83% of 50 DAV
50 DAV is 2,361,000
|
$19.78
-2.17%
|
11/22/2022
|
$17.38
|
PP = $16.66
|
|
MB = $17.49
|
Most Recent Note - 12/21/2022 12:19:16 PM
G - Powering to a new all-time high with today's 3rd consecutive gain, rallying further above its "max buy" level. Found prompt support near the prior high and well above its 50 DMA line ($15.39).
>>> FEATURED STOCK ARTICLE : Powerful Rally to New High for Catalyst - 12/20/2022 |
View all notes |
Set NEW NOTE alert |
Company Profile |
SEC
News |
Chart |
Request a new note
C
A
S
I |
TITN
-
NASDAQ
Titan Machinery Inc
SPECIALTY RETAIL
|
$38.11
|
-0.38
-0.99% |
$38.20
|
250,231
123.27% of 50 DAV
50 DAV is 203,000
|
$44.35
-14.07%
|
11/30/2022
|
$40.10
|
PP = $38.68
|
|
MB = $40.61
|
Most Recent Note - 12/21/2022 6:08:48 PM
Y - Still consolidating near the prior high in the $38 area which defines initial support to watch above its 50 DMA line ($35.77). Fundamentals remain strong after reporting Oct '22 quarterly earnings +91% on +47% sales revenues.
>>> FEATURED STOCK ARTICLE : Gap Up and Big Volume-Driven Breakout Gain - 11/30/2022 |
View all notes |
Set NEW NOTE alert |
Company Profile |
SEC
News |
Chart |
Request a new note
C
A
S
I |
MYE
-
NYSE
Myers Industries Inc
Containers/Packaging
|
$23.25
|
+0.06
0.26% |
$23.29
|
295,379
181.21% of 50 DAV
50 DAV is 163,000
|
$25.55
-9.00%
|
12/8/2022
|
$23.94
|
PP = $25.65
|
|
MB = $26.93
|
Most Recent Note - 12/21/2022 6:01:35 PM
Y - Posted a solid gain today with +82% above average volume. Still faces resistance due to overhead supply. Disciplined investors will note that it has failed thus far to produce the gains above the pivot point backed by at least +40% above average volume necessary to trigger a technical buy signal.
>>> FEATURED STOCK ARTICLE : Myers Industries on Track for 9th Straight Weekly Gain - 12/8/2022 |
View all notes |
Set NEW NOTE alert |
Company Profile |
SEC
News |
Chart |
Request a new note
C
A
S
I |
BOX
-
NYSE
Box Inc Cl A
Computer Sftwr-Database
|
$31.02
|
-0.32
-1.02% |
$31.15
|
798,084
69.10% of 50 DAV
50 DAV is 1,155,000
|
$33.04
-6.11%
|
12/12/2022
|
$29.83
|
PP = $29.57
|
|
MB = $31.05
|
Most Recent Note - 12/21/2022 6:05:41 PM
G - Still consolidating in a tight range near its "max buy" level. Faces little very resistance due to overhead supply up to the $33 level. Quarterly and annual earnings increases have been strong and steady.
>>> FEATURED STOCK ARTICLE : Volume Heavy Behind Breakout for Box Inc - 12/12/2022 |
View all notes |
Set NEW NOTE alert |
Company Profile |
SEC
News |
Chart |
Request a new note
C
A
S
I |
Symbol/Exchange
Company Name
Industry Group |
PRICE |
CHANGE
(%Change) |
Day High |
Volume
(% DAV)
(% 50 day avg vol) |
52 Wk Hi
% From Hi |
Featured
Date |
Price
Featured |
Pivot Featured |
|
Max Buy |
STRL
-
NASDAQ
Sterling Infrastructure
MATERIALS and; CONSTRUCTION - Heavy Construction
|
$32.28
|
+0.48
1.51% |
$32.53
|
200,392
102.24% of 50 DAV
50 DAV is 196,000
|
$33.62
-3.99%
|
12/14/2022
|
$32.41
|
PP = $33.72
|
|
MB = $35.41
|
Most Recent Note - 12/21/2022 6:03:46 PM
Y - Posted a solid gain today with +32% above average volume, breaking a streak of 5 consecutive losses. Highlighted in yellow with pivot point cited based on its 11/08/22 high plus 10 cents in the 12/14/22 mid-day report. Consolidating in a tight range near its all-time high. Faces very little resistance due to overhead supply. Subsequent gains above the pivot point backed by at least +40% above average volume are needed to trigger a proper technical buy signal.
>>> FEATURED STOCK ARTICLE : Sterling Infrastructure Forming Orderly Base Pattern - 12/14/2022 |
View all notes |
Set NEW NOTE alert |
Company Profile |
SEC
News |
Chart |
Request a new note
C
A
S
I |
|
|
|
THESE ARE NOT BUY RECOMMENDATIONS!
Comments contained in the body of this report are technical
opinions only. The material herein has been obtained
from sources believed to be reliable and accurate, however,
its accuracy and completeness cannot be guaranteed.
This site is not an investment advisor, hence it does
not endorse or recommend any securities or other investments.
Any recommendation contained in this report may not
be suitable for all investors and it is not to be deemed
an offer or solicitation on our part with respect to
the purchase or sale of any securities. All trademarks,
service marks and trade names appearing in this report
are the property of their respective owners, and are
likewise used for identification purposes only.
This report is a service available
only to active Paid Premium Members.
You may opt-out of receiving report notifications
at any time. Questions or comments may be submitted
by writing to Premium Membership Services 665 S.E. 10 Street, Suite 201 Deerfield Beach, FL 33441-5634 or by calling 1-800-965-8307
or 954-785-1121.
|
|
|