You are not logged in.
This means you
CAN ONLY VIEW reports that were published prior to Friday, April 18, 2025.
You
MUST UPGRADE YOUR MEMBERSHIP if you want to see any current reports.
AFTER MARKET UPDATE - WEDNESDAY, DECEMBER 21ST, 2022
Previous After Market Report Next After Market Report >>>
|
|
|
|
DOW |
+526.74 |
33,376.48 |
+1.60% |
|
Volume |
821,202,747 |
-8% |
|
Volume |
4,348,112,200 |
-7% |
|
NASDAQ |
+162.26 |
10,709.37 |
+1.54% |
|
Advancers |
2,324 |
76% |
|
Advancers |
3,063 |
67% |
|
S&P 500 |
+56.82 |
3,878.44 |
+1.49% |
|
Decliners |
715 |
24% |
|
Decliners |
1,516 |
33% |
|
Russell 2000 |
+28.92 |
1,776.94 |
+1.65% |
|
52 Wk Highs |
52 |
|
|
52 Wk Highs |
84 |
|
|
S&P 600 |
+17.82 |
1,167.39 |
+1.55% |
|
52 Wk Lows |
73 |
|
|
52 Wk Lows |
317 |
|
|
 |
Breadth Positive With Volume Totals Lower as Major Averages Rose
Kenneth J. Gruneisen - Passed the CAN SLIM® Master's Exam
The Dow gained 526 points, while the technology heavy Nasdaq Composite jumped 1.5%. The S&P 500 increased 1.5% with all S&P sectors finishing in positive territory. Volume totals were lower than the prior session on the NYSE and on the Nasdaq exchange. Advancers led decliners by a 3-1 margin on the NYSE and by 2-1 on the Nasdaq exchange. There were 13 high-ranked companies from the Leaders List that hit new 52-week highs and were listed on the BreakOuts Page, versus the total of 2 on the prior session. New 52-week lows totals contracted but still outnumbered new 52-week highs on the NYSE and on the Nasdaq exchange. The market is in an uptrend under pressure (M criteria). Healthy leadership (new 52-week highs totals) must continue for the rally be productive, but new highs totals have recently contracted. Only stocks meeting all key-criteria of the fact-based investment system should be considered as buy candidates.
Chart courtesy of www.stockcharts.com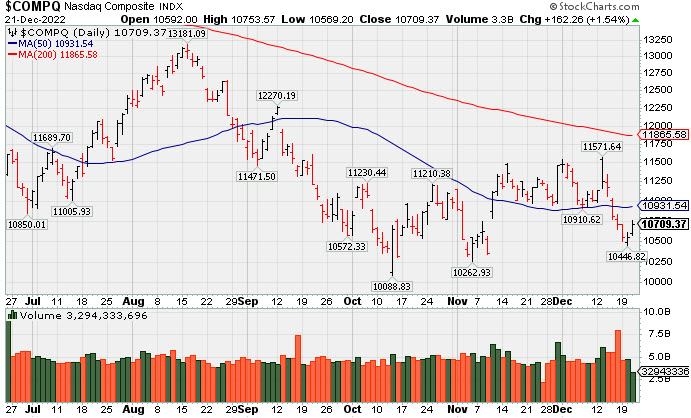 PICTURED: The Nasdaq Composite Index has posted gains with lighter volume since falling below its 50-day moving average (DMA) line toward the prior low.
U.S. equities surged Wednesday after two bellwether stocks reported better-than-expected earnings and December’s consumer confidence came hotter than analysts expected. The positive news raised market participants hopes that investor sentiment has improved with regards to the economy, labor market, and inflation.
On the data front, December’s Conference Board Consumer Confidence jumped 6.9 points from November’s revised 101.4 print, marking its first increase in months and topping analyst’s 101 expectations. Elsewhere, existing home sales decreased 7.7% in November with an annualized pace of 4.09 million purchases, falling for its tenth straight month as high mortgage rates continue to crimp demand. In earnings news, Nike (NKE +12.18%) gapped back up above its 200 DMA line after topping analyst’s earnings and revenue estimates as the company focused on cleaning out its inventory to increase their profit margin. Meanwhile, FedEx (FDX +3.43%) rose after reporting mixed second quarter results and announcing the company’s plan to cut costs.
Treasuries were mixed with the yield on the benchmark 10-year note decreasing one basis point (0.01%) to 3.67%, while the 30-year bond yield remained unchanged at 3.73%. The yield on the more Fed-sensitive two-year note decreased five basis points (0.05%) to 4.21%. In commodities, West Texas Intermediate (WTI) crude rose 2.9% to $78.45/barrel as it nears a three-week high amid growing fears of strong winter storms throughout the U.S. Prices were further strengthened after the U.S. Energy Information Administration (EIA) reported inventories fell by 5.89 million barrels versus the expected 1.66 million decrease.
|
 Kenneth J. Gruneisen started out as a licensed stockbroker in August 1987, a couple of months prior to the historic stock market crash that took the Dow Jones Industrial Average down -22.6% in a single day. He has published daily fact-based fundamental and technical analysis on high-ranked stocks online for two decades. Through FACTBASEDINVESTING.COM, Kenneth provides educational articles, news, market commentary, and other information regarding proven investment systems that work in good times and bad.
Comments contained in the body of this report are technical opinions only and are not necessarily those of Gruneisen Growth Corp. The material herein has been obtained from sources believed to be reliable and accurate, however, its accuracy and completeness cannot be guaranteed. Our firm, employees, and customers may effect transactions, including transactions contrary to any recommendation herein, or have positions in the securities mentioned herein or options with respect thereto. Any recommendation contained in this report may not be suitable for all investors and it is not to be deemed an offer or solicitation on our part with respect to the purchase or sale of any securities. |
|
 |
Retail, Financial, Tech, and Commodity-Linked Groups Rose
Kenneth J. Gruneisen - Passed the CAN SLIM® Master's Exam
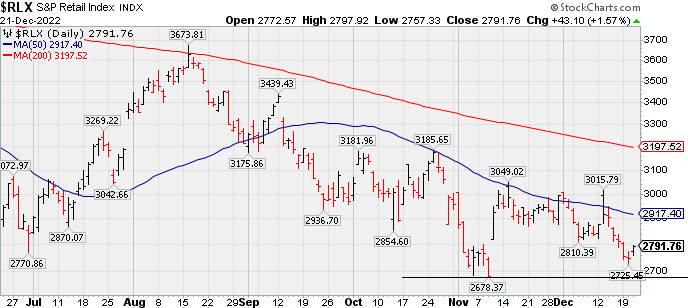
The Broker/Dealer Index ($XBD +1.71%), Bank Index ($BKX +1.56%), and Retail Index ($RLX +1.57%) each posted gains that had a positive influence on the major averages. The Semiconductor Index ($SOX +2.36%) and Biotech Index ($BTK +1.42%) led the tech sector higher while the Networking Index ($NWX +0.67%) posted a smaller gain. Commodity-linked groups also had a positive bias as the Oil Services Index ($OSX +2.30%) and Integrated Oil Index ($XOI +2.02%) both outpaced the Gold & Silver Index ($XAU +1.08%).
PICTURED: The Retail Index ($RLX +1.57%) recently met resistance near its 50-day moving average (DMA) line and has slumped back toward its November low.
| Oil Services |
$OSX |
82.74 |
+1.86 |
+2.30% |
+56.95% |
| Integrated Oil |
$XOI |
1,770.87 |
+35.11 |
+2.02% |
+50.30% |
| Semiconductor |
$SOX |
2,644.50 |
+60.86 |
+2.36% |
-32.99% |
| Networking |
$NWX |
785.19 |
+5.23 |
+0.67% |
-19.14% |
| Broker/Dealer |
$XBD |
452.30 |
+7.60 |
+1.71% |
-7.10% |
| Retail |
$RLX |
2,791.76 |
+43.10 |
+1.57% |
-33.95% |
| Gold & Silver |
$XAU |
121.92 |
+1.30 |
+1.08% |
-7.95% |
| Bank |
$BKX |
99.27 |
+1.52 |
+1.56% |
-24.92% |
| Biotech |
$BTK |
5,357.25 |
+75.06 |
+1.42% |
-2.92% |
|
|
|
 |
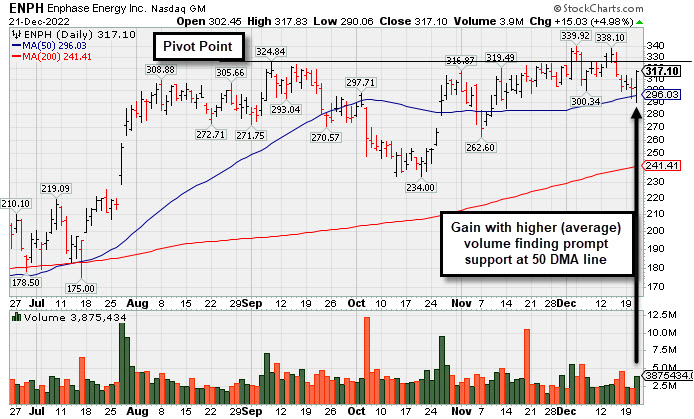
Found Support With a Solid Gain at 50-Day Moving Average Line
Kenneth J. Gruneisen - Passed the CAN SLIM® Master's Exam
Enphase Energy Inc (ENPH +$15.03 or +4.98% to $317.10) posted a solid gain today with higher (average) volume today, managing a "positive reversal" from the session low ($290.06) while finding prompt support near its 50-day moving average (DMA) line ($296.03). The recent slump back below its pivot point raised some concerns. It stalled after hitting a new all-time high on 12/02/22 with a volume-driven gain above its pivot point. Subsequent volume-driven gains for new highs would be a reassuring sign of fresh institutional buying demand. More damaging losses below the 50 DMA line and today's low would trigger a worrisome technical sell signal.
Fundamentals remain strong. Enphase was last shown with an annotated graph on 10/21/22 under the headline, "Perched Near High Still Awaiting Technical Breakout". It has an Earnings Per Share Rating of 99. It reported Sep '22 quarterly earnings +108% on +81% sales revenues versus the year ago period, continuing its strong earnings history above the +25% minimum guideline (C criteria). It has a strong annual earnings (A criteria) history since FY '18 after years of losses.
The company hails from the Energy-Solar group which is currently ranked 7th on the 197 Industry Groups (L criteria). The number of top-rated funds owning its shares rose from 1,068 in Dec '20 to 2,181 in Sep '22, a reassuring sign concerning the I criteria. Its current Up/Down Volume Ratio of 1.2 is an unbiased indication its shares have been under slight accumulation over the past 50 days.
|
|
|
Color Codes Explained :
Y - Better candidates highlighted by our
staff of experts.
G - Previously featured
in past reports as yellow but may no longer be buyable under the
guidelines.
***Last / Change / Volume data in this table is the closing quote data***
Symbol/Exchange
Company Name
Industry Group |
PRICE |
CHANGE
(%Change) |
Day High |
Volume
(% DAV)
(% 50 day avg vol) |
52 Wk Hi
% From Hi |
Featured
Date |
Price
Featured |
Pivot Featured |
|
Max Buy |
 ESQ
-
NASDAQ
ESQ
-
NASDAQ
Esquire Financial Hldgs
Finance-Commercial Loans
|
$43.02
|
+0.56
1.32% |
$43.09
|
17,698
63.21% of 50 DAV
50 DAV is 28,000
|
$48.13
-10.62%
|
10/18/2022
|
$40.02
|
PP = $39.95
|
|
MB = $41.95
|
Most Recent Note - 12/16/2022 6:36:34 PM
G - Managed a positive "reversal today" finding support near prior highs in the $41 area and rebounding toward its 50 DMA line ($42.74). Gains above the 50 DMA line are needed for its outlook to improve.
>>> FEATURED STOCK ARTICLE : Pulled Back Following "Negative Reversal" at All-Time High - 11/25/2022 |
View all notes |
Set NEW NOTE alert |
Company Profile |
SEC
News |
Chart |
Request a new note
C
A
S
I |
CMC
-
NYSE
Commercial Metals Co
METALS and MINING - Steel and Iron
|
$49.81
|
+1.59
3.30% |
$49.82
|
879,439
82.04% of 50 DAV
50 DAV is 1,072,000
|
$50.83
-2.01%
|
10/14/2022
|
$41.61
|
PP = $44.45
|
|
MB = $46.67
|
 Most Recent Note - 12/21/2022 5:59:13 PM
G - Managed a best-ever close with today's gain backed by lighter than average volume. Consolidating above its 50 DMA line ($46.46) and prior highs in the $46 area defining important near-term support to watch. Fundamentals remain strong.
>>> FEATURED STOCK ARTICLE : Wedging Higher With Recent Gains Lacking Great Volume - 12/2/2022 |
View all notes |
Set NEW NOTE alert |
Company Profile |
SEC
News |
Chart |
Request a new note
C
A
S
I |
VRTX
-
NASDAQ
Vertex Pharmaceuticals
Medical-Biomed/Biotech
|
$290.55
|
-2.68
-0.91% |
$294.39
|
1,460,468
96.40% of 50 DAV
50 DAV is 1,515,000
|
$324.75
-10.53%
|
10/24/2022
|
$308.47
|
PP = $306.05
|
|
MB = $321.35
|
Most Recent Note - 12/19/2022 5:48:44 PM
G - Gapped down today for a damaging loss triggering a technical sell signal and its color code is changed to green. Only a prompt rebound above the 50 DMA line ($307.76) would help its outlook improve. Recently reported Sep '22 quarterly earnings +14% on +18% sales revenues versus the year ago period, below the +25% minimum earnings guideline raising fundamental concerns (C criteria).
>>> FEATURED STOCK ARTICLE : Testing Support Near 50-Day Moving Average Line and Prior Pivot - 12/13/2022 |
View all notes |
Set NEW NOTE alert |
Company Profile |
SEC
News |
Chart |
Request a new note
C
A
S
I |
GPK
-
NYSE
Graphic Packaging Hldg
CONSUMER NON-DURABLES - Packaging and Containers
|
$21.80
|
+0.41
1.92% |
$21.90
|
5,908,295
197.67% of 50 DAV
50 DAV is 2,989,000
|
$24.07
-9.43%
|
10/25/2022
|
$22.75
|
PP = $24.17
|
|
MB = $25.38
|
Most Recent Note - 12/21/2022 12:29:31 PM
G - Consolidating near its 200 DMA line ($21.51) after losses raised concerns and triggered a technical sell signal. Color code was changed to green. A prompt rebound above the 50 DMA line is needed for its outlook to improve Fundamentals remain strong.
>>> FEATURED STOCK ARTICLE : Violated 50-Day Moving Average After Recently Failing to Break Out - 12/15/2022 |
View all notes |
Set NEW NOTE alert |
Company Profile |
SEC
News |
Chart |
Request a new note
C
A
S
I |
CBZ
-
NYSE
C B I Z Inc
Comml Svcs-Consulting
|
$47.82
|
+0.61
1.29% |
$48.09
|
114,253
43.61% of 50 DAV
50 DAV is 262,000
|
$51.67
-7.45%
|
10/26/2022
|
$47.83
|
PP = $48.57
|
|
MB = $51.00
|
Most Recent Note - 12/19/2022 5:43:43 PM
G - Pulled back for a 4th consecutive loss and its color code is changed to green after violating its 50 DMA line ($47.83) triggering a technical sell signal. Recently reported Sep '22 quarterly earnings +24% on +28% sales revenues versus the year ago period. See the latest FSU analysis for more details and a new annotated graph.
>>> FEATURED STOCK ARTICLE : Fourth Straight Loss in Slump Violating 50-Day Moving Average Line - 12/19/2022 |
View all notes |
Set NEW NOTE alert |
Company Profile |
SEC
News |
Chart |
Request a new note
C
A
S
I |
Symbol/Exchange
Company Name
Industry Group |
PRICE |
CHANGE
(%Change) |
Day High |
Volume
(% DAV)
(% 50 day avg vol) |
52 Wk Hi
% From Hi |
Featured
Date |
Price
Featured |
Pivot Featured |
|
Max Buy |
ENPH
-
NASDAQ
Enphase Energy Inc
Energy-Solar
|
$317.10
|
+15.03
4.98% |
$317.83
|
3,872,750
105.38% of 50 DAV
50 DAV is 3,675,000
|
$339.92
-6.71%
|
10/26/2022
|
$301.55
|
PP = $324.94
|
|
MB = $341.19
|
Most Recent Note - 12/21/2022 5:55:07 PM
Y - Posted a solid gain today on higher (average) volume finding prompt support near its 50 DMA line ($296.03). Recent slump below its pivot point raised concerns. Its 50 DMA line and today's low ($290.06) define important near-term support to watch. Fundamentals remain strong. See the latest FSU analysis for more details and a new annotated graph.
>>> FEATURED STOCK ARTICLE : Found Support With a Solid Gain at 50-Day Moving Average Line - 12/21/2022 |
View all notes |
Set NEW NOTE alert |
Company Profile |
SEC
News |
Chart |
Request a new note
C
A
S
I |
HRMY
-
NASDAQ
Harmony Biosciences Holdings
Medical-Biomed/Biotech
|
$57.19
|
+1.06
1.89% |
$57.83
|
218,636
45.40% of 50 DAV
50 DAV is 481,600
|
$62.09
-7.89%
|
11/1/2022
|
$55.31
|
PP = $57.23
|
|
MB = $60.09
|
Most Recent Note - 12/21/2022 6:07:42 PM
Y - Consolidating near its prior highs after briefly sputtering back below the pivot point. Its 50 DMA line ($55.94) and 11/17/22 low ($53.06) define important near-term support to watch.
>>> FEATURED STOCK ARTICLE : Harmony Still Hovering Near All-Time High - 11/28/2022 |
View all notes |
Set NEW NOTE alert |
Company Profile |
SEC
News |
Chart |
Request a new note
C
A
S
I |
CLH
-
NYSE
Clean Harbors Inc
Pollution Control
|
$116.31
|
+3.36
2.97% |
$116.32
|
220,897
54.14% of 50 DAV
50 DAV is 408,000
|
$125.41
-7.26%
|
11/2/2022
|
$121.59
|
PP = $124.59
|
|
MB = $130.82
|
Most Recent Note - 12/21/2022 5:57:07 PM
G - Posted a 2nd consecutive gain today with lighter volume after damaging losses violated its 50 DMA line ($117.20) and the recent low ($114.86 on 11/29/22) triggering technical sell signals. Only a prompt rebound above the 50 DMA line would help its outlook improve. Fundamentals remain strong.
>>> FEATURED STOCK ARTICLE : Volume-Driven Losses Undercut 50-Day Moving Average - 11/29/2022 |
View all notes |
Set NEW NOTE alert |
Company Profile |
SEC
News |
Chart |
Request a new note
C
A
S
I |
DGII
-
NASDAQ
Digi International Inc
COMPUTER HARDWARE - Networking and Communication Dev
|
$38.11
|
+0.66
1.76% |
$38.50
|
165,549
47.30% of 50 DAV
50 DAV is 350,000
|
$43.68
-12.75%
|
11/10/2022
|
$41.82
|
PP = $40.96
|
|
MB = $43.01
|
Most Recent Note - 12/16/2022 6:31:23 PM
G - Violated its 50 DMA line ($38.86) this week with 3 damaging losses backed by ever increasing volume triggering a technical sell signal and its color code is changed to green. Only a prompt rebound above the 50 DMA line would help its outlook improve. Fundamentals remain strong.
>>> FEATURED STOCK ARTICLE : Sputtering After Recently Wedging to New Highs - 12/6/2022 |
View all notes |
Set NEW NOTE alert |
Company Profile |
SEC
News |
Chart |
Request a new note
C
A
S
I |
GFF
-
NYSE
Griffon Corporation
MATERIALS and CONSTRUCTION - General Building Materials
|
$35.00
|
+0.01
0.03% |
$35.50
|
236,121
59.78% of 50 DAV
50 DAV is 395,000
|
$37.69
-7.14%
|
11/10/2022
|
$34.13
|
PP = $35.02
|
|
MB = $36.77
|
Most Recent Note - 12/16/2022 6:38:10 PM
Y - Managed a "positive reversal" today after slumping near prior highs in the $34 area which define initial support to watch above its 50 DMA line ($33.19). Reported Sep '22 quarterly earnings +230% on +24% sales revenues versus the year ago period.
>>> FEATURED STOCK ARTICLE : No Meaningful Progress After Breakout 3 Weeks Ago - 12/7/2022 |
View all notes |
Set NEW NOTE alert |
Company Profile |
SEC
News |
Chart |
Request a new note
C
A
S
I |
Symbol/Exchange
Company Name
Industry Group |
PRICE |
CHANGE
(%Change) |
Day High |
Volume
(% DAV)
(% 50 day avg vol) |
52 Wk Hi
% From Hi |
Featured
Date |
Price
Featured |
Pivot Featured |
|
Max Buy |
ANET
-
NYSE
Arista Networks Inc
Computer-Networking
|
$123.33
|
+1.56
1.28% |
$124.58
|
1,181,660
47.90% of 50 DAV
50 DAV is 2,467,000
|
$148.57
-16.99%
|
11/14/2022
|
$132.05
|
PP = $133.70
|
|
MB = $140.39
|
Most Recent Note - 12/16/2022 6:46:44 PM
G - Color code is changed to green as today's 3rd consecutive loss with increasing volume undercut the prior low and tested its 50-day moving average (DMA) line ($123.74). Faces some resistance due to overhead supply up to the $148 level. Fundamentals are strong.
>>> FEATURED STOCK ARTICLE : Sputtered Back Below Prior High Hurting Outlook - 12/9/2022 |
View all notes |
Set NEW NOTE alert |
Company Profile |
SEC
News |
Chart |
Request a new note
C
A
S
I |
CPRX
-
NASDAQ
Catalyst Pharma Inc
Medical-Biomed/Biotech
|
$19.50
|
+0.90
4.84% |
$19.78
|
3,255,575
139.96% of 50 DAV
50 DAV is 2,326,000
|
$18.70
4.28%
|
11/22/2022
|
$17.38
|
PP = $16.66
|
|
MB = $17.49
|
Most Recent Note - 12/21/2022 12:19:16 PM
G - Powering to a new all-time high with today's 3rd consecutive gain, rallying further above its "max buy" level. Found prompt support near the prior high and well above its 50 DMA line ($15.39).
>>> FEATURED STOCK ARTICLE : Powerful Rally to New High for Catalyst - 12/20/2022 |
View all notes |
Set NEW NOTE alert |
Company Profile |
SEC
News |
Chart |
Request a new note
C
A
S
I |
TITN
-
NASDAQ
Titan Machinery Inc
SPECIALTY RETAIL
|
$38.49
|
+0.37
0.97% |
$38.99
|
206,213
102.09% of 50 DAV
50 DAV is 202,000
|
$44.35
-13.21%
|
11/30/2022
|
$40.10
|
PP = $38.68
|
|
MB = $40.61
|
Most Recent Note - 12/21/2022 6:08:48 PM
Y - Still consolidating near the prior high in the $38 area which defines initial support to watch above its 50 DMA line ($35.77). Fundamentals remain strong after reporting Oct '22 quarterly earnings +91% on +47% sales revenues.
>>> FEATURED STOCK ARTICLE : Gap Up and Big Volume-Driven Breakout Gain - 11/30/2022 |
View all notes |
Set NEW NOTE alert |
Company Profile |
SEC
News |
Chart |
Request a new note
C
A
S
I |
MYE
-
NYSE
Myers Industries Inc
Containers/Packaging
|
$23.19
|
+0.49
2.16% |
$23.26
|
290,960
181.85% of 50 DAV
50 DAV is 160,000
|
$25.55
-9.24%
|
12/8/2022
|
$23.94
|
PP = $25.65
|
|
MB = $26.93
|
Most Recent Note - 12/21/2022 6:01:35 PM
Y - Posted a solid gain today with +82% above average volume. Still faces resistance due to overhead supply. Disciplined investors will note that it has failed thus far to produce the gains above the pivot point backed by at least +40% above average volume necessary to trigger a technical buy signal.
>>> FEATURED STOCK ARTICLE : Myers Industries on Track for 9th Straight Weekly Gain - 12/8/2022 |
View all notes |
Set NEW NOTE alert |
Company Profile |
SEC
News |
Chart |
Request a new note
C
A
S
I |
BOX
-
NYSE
Box Inc Cl A
Computer Sftwr-Database
|
$31.34
|
+0.37
1.19% |
$31.58
|
1,061,031
92.02% of 50 DAV
50 DAV is 1,153,000
|
$33.04
-5.15%
|
12/12/2022
|
$29.83
|
PP = $29.57
|
|
MB = $31.05
|
Most Recent Note - 12/21/2022 6:05:41 PM
G - Still consolidating in a tight range near its "max buy" level. Faces little very resistance due to overhead supply up to the $33 level. Quarterly and annual earnings increases have been strong and steady.
>>> FEATURED STOCK ARTICLE : Volume Heavy Behind Breakout for Box Inc - 12/12/2022 |
View all notes |
Set NEW NOTE alert |
Company Profile |
SEC
News |
Chart |
Request a new note
C
A
S
I |
Symbol/Exchange
Company Name
Industry Group |
PRICE |
CHANGE
(%Change) |
Day High |
Volume
(% DAV)
(% 50 day avg vol) |
52 Wk Hi
% From Hi |
Featured
Date |
Price
Featured |
Pivot Featured |
|
Max Buy |
STRL
-
NASDAQ
Sterling Infrastructure
MATERIALS and; CONSTRUCTION - Heavy Construction
|
$31.80
|
+1.33
4.36% |
$32.08
|
256,687
132.31% of 50 DAV
50 DAV is 194,000
|
$33.62
-5.41%
|
12/14/2022
|
$32.41
|
PP = $33.72
|
|
MB = $35.41
|
Most Recent Note - 12/21/2022 6:03:46 PM
Y - Posted a solid gain today with +32% above average volume, breaking a streak of 5 consecutive losses. Highlighted in yellow with pivot point cited based on its 11/08/22 high plus 10 cents in the 12/14/22 mid-day report. Consolidating in a tight range near its all-time high. Faces very little resistance due to overhead supply. Subsequent gains above the pivot point backed by at least +40% above average volume are needed to trigger a proper technical buy signal.
>>> FEATURED STOCK ARTICLE : Sterling Infrastructure Forming Orderly Base Pattern - 12/14/2022 |
View all notes |
Set NEW NOTE alert |
Company Profile |
SEC
News |
Chart |
Request a new note
C
A
S
I |
|
|
|
THESE ARE NOT BUY RECOMMENDATIONS!
Comments contained in the body of this report are technical
opinions only. The material herein has been obtained
from sources believed to be reliable and accurate, however,
its accuracy and completeness cannot be guaranteed.
This site is not an investment advisor, hence it does
not endorse or recommend any securities or other investments.
Any recommendation contained in this report may not
be suitable for all investors and it is not to be deemed
an offer or solicitation on our part with respect to
the purchase or sale of any securities. All trademarks,
service marks and trade names appearing in this report
are the property of their respective owners, and are
likewise used for identification purposes only.
This report is a service available
only to active Paid Premium Members.
You may opt-out of receiving report notifications
at any time. Questions or comments may be submitted
by writing to Premium Membership Services 665 S.E. 10 Street, Suite 201 Deerfield Beach, FL 33441-5634 or by calling 1-800-965-8307
or 954-785-1121.
|
|
|