You are not logged in.
This means you
CAN ONLY VIEW reports that were published prior to Tuesday, March 25, 2025.
You
MUST UPGRADE YOUR MEMBERSHIP if you want to see any current reports.
AFTER MARKET UPDATE - TUESDAY, DECEMBER 20TH, 2022
Previous After Market Report Next After Market Report >>>
|
|
|
|
DOW |
+92.20 |
32,849.74 |
+0.28% |
|
Volume |
892,991,443 |
-6% |
|
Volume |
4,652,281,000 |
+1% |
|
NASDAQ |
+1.08 |
10,547.11 |
+0.01% |
|
Advancers |
1,597 |
52% |
|
Advancers |
2,286 |
50% |
|
S&P 500 |
+3.96 |
3,821.62 |
+0.10% |
|
Decliners |
1,461 |
48% |
|
Decliners |
2,267 |
50% |
|
Russell 2000 |
+9.44 |
1,748.02 |
+0.54% |
|
52 Wk Highs |
48 |
|
|
52 Wk Highs |
87 |
|
|
S&P 600 |
+3.72 |
1,149.57 |
+0.32% |
|
52 Wk Lows |
164 |
|
|
52 Wk Lows |
468 |
|
|
 |
Major Indices Indecisive as Leadership Remains Thin
Kenneth J. Gruneisen - Passed the CAN SLIM® Master's Exam
The Dow gained 92 points, while the technology heavy Nasdaq Composite remained unchanged. The S&P 500 increased 0.1% as four of the eleven S&P sectors finishing in negative territory with Energy pacing gains. Volume totals were mixed, lower than the prior session on the NYSE and higher on the Nasdaq exchange. Advancers and decliners were evenly matched on the NYSE and on the Nasdaq exchange. There were 2 high-ranked companies from the Leaders List that hit new 52-week highs and were listed on the BreakOuts Page, versus the total of 4 on the prior session. New 52-week lows totals solidly outnumbered new 52-week highs on the NYSE and on the Nasdaq exchange. The market is in an uptrend under pressure (M criteria) while showing the threatening look of a more serious market correction. Healthy leadership (new 52-week highs totals) must continue for the rally be productive, but new highs totals have recently contracted. Only stocks meeting all key-criteria of the fact-based investment system should be considered as buy candidates.
Chart courtesy of www.stockcharts.com PICTURED: The Dow Jones Industrial Average has pulled back testing support near its 50-day and 200-day moving average (DMA) lines.
U.S. equities slightly increased Tuesday after the Bank of Japan (BOJ) took the market by surprise. On Tuesday morning, the Japanese central bank voted to widen its cap on their 10-year government bond yield. This announcement comes as the BOJ moves to a more hawkish stance from its easing monetary policy.
On the data front, November’s new home construction and permits continued to decline as borrowing costs continue their upward trend paired with inflation inhibiting affordability and demand. Housing starts declined -0.5% month-over-month, easing from October’s revised -2.1%, to a 1.43 million annualized rate. Meanwhile, building permits plunged 11.2% in November from the prior month’s revised -3.3% to an annualized 1.34 million units.
Treasury yields increased Tuesday with the yield on the benchmark 10-year note climbing nine basis points (0.9%) to 3.68%, while the 30-year bond yield also advanced nine basis points (0.09%) to 3.73%. The yield on the more Fed-sensitive two-year note remained unchanged at 4.26%. In commodities, West Texas Intermediate (WTI) crude rose 1.2% to $76.09/barrel amid growing fears of a winter storm in the U.S. later this week. Elsewhere, a request was submitted early Tuesday morning to reopen the Keystone pipeline after being closed for roughly two weeks. In FOREX trading, the U.S. Dollar Index closed down 0.7% against a basket of major currencies, while the Japanese yen surged 3.8% against the dollar hitting a four-month peak.
|
 Kenneth J. Gruneisen started out as a licensed stockbroker in August 1987, a couple of months prior to the historic stock market crash that took the Dow Jones Industrial Average down -22.6% in a single day. He has published daily fact-based fundamental and technical analysis on high-ranked stocks online for two decades. Through FACTBASEDINVESTING.COM, Kenneth provides educational articles, news, market commentary, and other information regarding proven investment systems that work in good times and bad.
Comments contained in the body of this report are technical opinions only and are not necessarily those of Gruneisen Growth Corp. The material herein has been obtained from sources believed to be reliable and accurate, however, its accuracy and completeness cannot be guaranteed. Our firm, employees, and customers may effect transactions, including transactions contrary to any recommendation herein, or have positions in the securities mentioned herein or options with respect thereto. Any recommendation contained in this report may not be suitable for all investors and it is not to be deemed an offer or solicitation on our part with respect to the purchase or sale of any securities. |
|
 |
Broker/Dealer, Biotech, Networking, & Commodity-Linked Groups Rose
Kenneth J. Gruneisen - Passed the CAN SLIM® Master's Exam
The Broker/Dealer Index ($XBD +0.75%) posted a modest gain while the Bank Index ($BKX +0.09%) inched higher and the Retail Index ($RLX -0.20%) inched lower. The Biotech Index ($BTK +1.39%) and Networking Index ($NWX +0.87%) led the tech sector higher while the Semiconductor Index ($SOX -0.62%) edged lower. The Gold & Silver Index ($XAU +4.28%) was a standout gainer while the Oil Services Index ($OSX +3.14%) and Integrated Oil Index ($XOI +1.43%) also rose.
PICTURED: The Broker/Dealer Index ($XBD +0.75%) recently slumped below its 50-day moving average (DMA) line toward its 200 DMA line.
| Oil Services |
$OSX |
80.88 |
+2.46 |
+3.14% |
+53.42% |
| Integrated Oil |
$XOI |
1,735.76 |
+24.45 |
+1.43% |
+47.32% |
| Semiconductor |
$SOX |
2,583.64 |
-16.22 |
-0.62% |
-34.53% |
| Networking |
$NWX |
779.96 |
+6.71 |
+0.87% |
-19.68% |
| Broker/Dealer |
$XBD |
444.70 |
+3.29 |
+0.75% |
-8.66% |
| Retail |
$RLX |
2,748.66 |
-5.50 |
-0.20% |
-34.97% |
| Gold & Silver |
$XAU |
120.62 |
+4.95 |
+4.28% |
-8.93% |
| Bank |
$BKX |
97.75 |
+0.09 |
+0.09% |
-26.07% |
| Biotech |
$BTK |
5,282.19 |
+72.32 |
+1.39% |
-4.28% |
|
|
|
 |
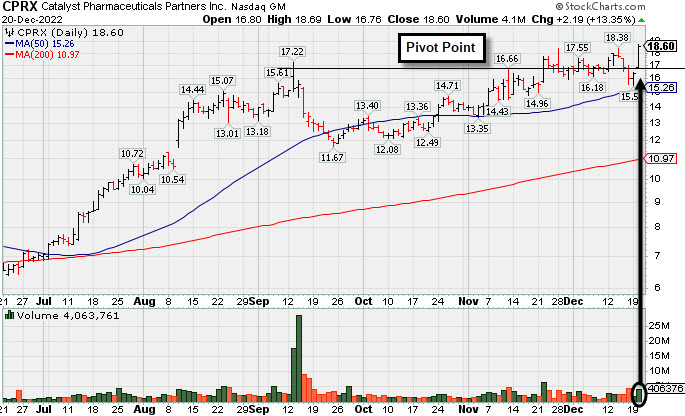
Powerful Rally to New High for Catalyst
Kenneth J. Gruneisen - Passed the CAN SLIM® Master's Exam
Catalyst Pharma Inc (CPRX +$2.19 or +13.35% to $18.60) posted a big gain today with volume +79% above average, quickly rallying back above its pivot point and above its "max buy" level to a new all-time high. Its color code was changed to green. It recently found prompt support near the prior high and well above its 50-day moving average (DMA) line ($15.26).
CPRX finished strong after highlighted in yellow with new pivot point cited based on its 11/11/22 high in the 11/22/22 mid-day report (read here). It rallied from a 9-week cup-with-handle consolidation for a new 52-week high with a big gain backed by +90% above average volume triggering a technical buy signal. The volume-driven gain provided a reassurance that institutional buying demand was lurking. It was shown in this FSU section on 11/22/22 with an annotated graph under the headline, "Breakout From Cup-With-Handle With 90% Above Average Volume".
It has an Earnings Per Share rating of 99. Recently it reported Sep '22 quarterly earnings +86% on +59% sales revenues versus the year ago period, its 4th consecutive quarterly comparison above the +25% minimum earnings guideline (C criteria). Annual earnings (A criteria) growth has been strong since turning profitable in FY '19.
The Medical-Biomed/Biotech industry group is currently ranked 32nd on the 197 Industry Groups list, a reassuring sign concerning the L criteria. It has only 88.5 million shares in the public float. The number of top-rated funds owning its shares rose from 311 in Sep '21 to 376 in Sep '22, a reassuring sign concerning the I criteria. Its current Up/Down Volume Ratio of 1.2 is an unbiased indication its shares have been under accumulation over the past 50 days.
|
|
|
Color Codes Explained :
Y - Better candidates highlighted by our
staff of experts.
G - Previously featured
in past reports as yellow but may no longer be buyable under the
guidelines.
***Last / Change / Volume data in this table is the closing quote data***
Symbol/Exchange
Company Name
Industry Group |
PRICE |
CHANGE
(%Change) |
Day High |
Volume
(% DAV)
(% 50 day avg vol) |
52 Wk Hi
% From Hi |
Featured
Date |
Price
Featured |
Pivot Featured |
|
Max Buy |
 ESQ
-
NASDAQ
ESQ
-
NASDAQ
Esquire Financial Hldgs
Finance-Commercial Loans
|
$42.46
|
+0.16
0.38% |
$42.97
|
11,417
39.37% of 50 DAV
50 DAV is 29,000
|
$48.13
-11.78%
|
10/18/2022
|
$40.02
|
PP = $39.95
|
|
MB = $41.95
|
Most Recent Note - 12/16/2022 6:36:34 PM
G - Managed a positive "reversal today" finding support near prior highs in the $41 area and rebounding toward its 50 DMA line ($42.74). Gains above the 50 DMA line are needed for its outlook to improve.
>>> FEATURED STOCK ARTICLE : Pulled Back Following "Negative Reversal" at All-Time High - 11/25/2022 |
View all notes |
Set NEW NOTE alert |
Company Profile |
SEC
News |
Chart |
Request a new note
C
A
S
I |
CMC
-
NYSE
Commercial Metals Co
METALS and MINING - Steel and Iron
|
$48.22
|
+0.95
2.01% |
$49.59
|
1,126,385
105.57% of 50 DAV
50 DAV is 1,067,000
|
$50.83
-5.13%
|
10/14/2022
|
$41.61
|
PP = $44.45
|
|
MB = $46.67
|
 Most Recent Note - 12/20/2022 6:01:25 PM
G - Consolidating above its 50 DMA line ($46.26) and prior highs in the $46 area defining important near-term support to watch. Fundamentals remain strong.
>>> FEATURED STOCK ARTICLE : Wedging Higher With Recent Gains Lacking Great Volume - 12/2/2022 |
View all notes |
Set NEW NOTE alert |
Company Profile |
SEC
News |
Chart |
Request a new note
C
A
S
I |
VRTX
-
NASDAQ
Vertex Pharmaceuticals
Medical-Biomed/Biotech
|
$293.23
|
+1.64
0.56% |
$296.00
|
1,274,055
84.60% of 50 DAV
50 DAV is 1,506,000
|
$324.75
-9.71%
|
10/24/2022
|
$308.47
|
PP = $306.05
|
|
MB = $321.35
|
Most Recent Note - 12/19/2022 5:48:44 PM
G - Gapped down today for a damaging loss triggering a technical sell signal and its color code is changed to green. Only a prompt rebound above the 50 DMA line ($307.76) would help its outlook improve. Recently reported Sep '22 quarterly earnings +14% on +18% sales revenues versus the year ago period, below the +25% minimum earnings guideline raising fundamental concerns (C criteria).
>>> FEATURED STOCK ARTICLE : Testing Support Near 50-Day Moving Average Line and Prior Pivot - 12/13/2022 |
View all notes |
Set NEW NOTE alert |
Company Profile |
SEC
News |
Chart |
Request a new note
C
A
S
I |
GPK
-
NYSE
Graphic Packaging Hldg
CONSUMER NON-DURABLES - Packaging and Containers
|
$21.39
|
+0.13
0.61% |
$21.49
|
2,919,044
97.50% of 50 DAV
50 DAV is 2,994,000
|
$24.07
-11.13%
|
10/25/2022
|
$22.75
|
PP = $24.17
|
|
MB = $25.38
|
Most Recent Note - 12/15/2022 5:31:26 PM
G - Pulled back below its 50-day moving average (DMA) line ($22.09) with today's loss on near average volume raising concerns and triggering a technical sell signal. Color code is changed to green. A prompt rebound above the 50 DMA line is needed for its outlook to improve Fundamentals remain strong. See the latest FSU analysis for more details and a new annotated graph.
>>> FEATURED STOCK ARTICLE : Violated 50-Day Moving Average After Recently Failing to Break Out - 12/15/2022 |
View all notes |
Set NEW NOTE alert |
Company Profile |
SEC
News |
Chart |
Request a new note
C
A
S
I |
CBZ
-
NYSE
C B I Z Inc
Comml Svcs-Consulting
|
$47.21
|
+0.24
0.51% |
$47.46
|
127,291
47.85% of 50 DAV
50 DAV is 266,000
|
$51.67
-8.63%
|
10/26/2022
|
$47.83
|
PP = $48.57
|
|
MB = $51.00
|
Most Recent Note - 12/19/2022 5:43:43 PM
G - Pulled back for a 4th consecutive loss and its color code is changed to green after violating its 50 DMA line ($47.83) triggering a technical sell signal. Recently reported Sep '22 quarterly earnings +24% on +28% sales revenues versus the year ago period. See the latest FSU analysis for more details and a new annotated graph.
>>> FEATURED STOCK ARTICLE : Fourth Straight Loss in Slump Violating 50-Day Moving Average Line - 12/19/2022 |
View all notes |
Set NEW NOTE alert |
Company Profile |
SEC
News |
Chart |
Request a new note
C
A
S
I |
Symbol/Exchange
Company Name
Industry Group |
PRICE |
CHANGE
(%Change) |
Day High |
Volume
(% DAV)
(% 50 day avg vol) |
52 Wk Hi
% From Hi |
Featured
Date |
Price
Featured |
Pivot Featured |
|
Max Buy |
ENPH
-
NASDAQ
Enphase Energy Inc
Energy-Solar
|
$302.07
|
-2.94
-0.96% |
$310.09
|
2,254,568
60.93% of 50 DAV
50 DAV is 3,700,000
|
$339.92
-11.13%
|
10/26/2022
|
$301.55
|
PP = $324.94
|
|
MB = $341.19
|
Most Recent Note - 12/16/2022 6:32:32 PM
Y - Pulled back today with above average volume while slumping back below its pivot point. Stalled after hitting a new all-time high on 12/02/22 with a volume-driven gain above its pivot point. Its 50 DMA line ($292) defines near-term support to watch on pullbacks. Fundamentals remain strong.
>>> FEATURED STOCK ARTICLE : Perched Near High Still Awaiting Technical Breakout - 11/21/2022 |
View all notes |
Set NEW NOTE alert |
Company Profile |
SEC
News |
Chart |
Request a new note
C
A
S
I |
HRMY
-
NASDAQ
Harmony Biosciences Holdings
Medical-Biomed/Biotech
|
$56.13
|
+0.86
1.56% |
$56.72
|
435,190
90.51% of 50 DAV
50 DAV is 480,800
|
$62.09
-9.60%
|
11/1/2022
|
$55.31
|
PP = $57.23
|
|
MB = $60.09
|
Most Recent Note - 12/15/2022 4:49:29 PM
Y - Suffered a 3rd consecutive loss today slumping below its pivot point raising concerns. Its 50 DMA line ($55.29) and 11/17/22 low ($53.06) define important near-term support to watch.
>>> FEATURED STOCK ARTICLE : Harmony Still Hovering Near All-Time High - 11/28/2022 |
View all notes |
Set NEW NOTE alert |
Company Profile |
SEC
News |
Chart |
Request a new note
C
A
S
I |
CLH
-
NYSE
Clean Harbors Inc
Pollution Control
|
$112.95
|
+0.40
0.36% |
$113.74
|
279,684
68.05% of 50 DAV
50 DAV is 411,000
|
$125.41
-9.94%
|
11/2/2022
|
$121.59
|
PP = $124.59
|
|
MB = $130.82
|
Most Recent Note - 12/19/2022 5:46:43 PM
G - Color code is changed to green after gapping down today for a damaging 4th consecutive loss. Violated its 50 DMA line ($117) and the recent low ($114.86 on 11/29/22) triggering technical sell signals. Only a prompt rebound above the 50 DMA line would help its outlook improve. Fundamentals remain strong.
>>> FEATURED STOCK ARTICLE : Volume-Driven Losses Undercut 50-Day Moving Average - 11/29/2022 |
View all notes |
Set NEW NOTE alert |
Company Profile |
SEC
News |
Chart |
Request a new note
C
A
S
I |
DGII
-
NASDAQ
Digi International Inc
COMPUTER HARDWARE - Networking and Communication Dev
|
$37.45
|
+0.41
1.11% |
$37.76
|
170,259
47.43% of 50 DAV
50 DAV is 359,000
|
$43.68
-14.26%
|
11/10/2022
|
$41.82
|
PP = $40.96
|
|
MB = $43.01
|
Most Recent Note - 12/16/2022 6:31:23 PM
G - Violated its 50 DMA line ($38.86) this week with 3 damaging losses backed by ever increasing volume triggering a technical sell signal and its color code is changed to green. Only a prompt rebound above the 50 DMA line would help its outlook improve. Fundamentals remain strong.
>>> FEATURED STOCK ARTICLE : Sputtering After Recently Wedging to New Highs - 12/6/2022 |
View all notes |
Set NEW NOTE alert |
Company Profile |
SEC
News |
Chart |
Request a new note
C
A
S
I |
GFF
-
NYSE
Griffon Corporation
MATERIALS and CONSTRUCTION - General Building Materials
|
$34.99
|
+0.58
1.69% |
$35.02
|
256,487
64.77% of 50 DAV
50 DAV is 396,000
|
$37.69
-7.16%
|
11/10/2022
|
$34.13
|
PP = $35.02
|
|
MB = $36.77
|
Most Recent Note - 12/16/2022 6:38:10 PM
Y - Managed a "positive reversal" today after slumping near prior highs in the $34 area which define initial support to watch above its 50 DMA line ($33.19). Reported Sep '22 quarterly earnings +230% on +24% sales revenues versus the year ago period.
>>> FEATURED STOCK ARTICLE : No Meaningful Progress After Breakout 3 Weeks Ago - 12/7/2022 |
View all notes |
Set NEW NOTE alert |
Company Profile |
SEC
News |
Chart |
Request a new note
C
A
S
I |
Symbol/Exchange
Company Name
Industry Group |
PRICE |
CHANGE
(%Change) |
Day High |
Volume
(% DAV)
(% 50 day avg vol) |
52 Wk Hi
% From Hi |
Featured
Date |
Price
Featured |
Pivot Featured |
|
Max Buy |
ANET
-
NYSE
Arista Networks Inc
Computer-Networking
|
$121.77
|
-0.78
-0.64% |
$122.95
|
1,708,760
68.49% of 50 DAV
50 DAV is 2,495,000
|
$148.57
-18.04%
|
11/14/2022
|
$132.05
|
PP = $133.70
|
|
MB = $140.39
|
Most Recent Note - 12/16/2022 6:46:44 PM
G - Color code is changed to green as today's 3rd consecutive loss with increasing volume undercut the prior low and tested its 50-day moving average (DMA) line ($123.74). Faces some resistance due to overhead supply up to the $148 level. Fundamentals are strong.
>>> FEATURED STOCK ARTICLE : Sputtered Back Below Prior High Hurting Outlook - 12/9/2022 |
View all notes |
Set NEW NOTE alert |
Company Profile |
SEC
News |
Chart |
Request a new note
C
A
S
I |
CPRX
-
NASDAQ
Catalyst Pharma Inc
Medical-Biomed/Biotech
|
$18.60
|
+2.19
13.35% |
$18.70
|
4,065,655
179.02% of 50 DAV
50 DAV is 2,271,000
|
$18.39
1.14%
|
11/22/2022
|
$17.38
|
PP = $16.66
|
|
MB = $17.49
|
Most Recent Note - 12/20/2022 12:28:18 PM
G - Posting a big gain today with volume running at an above average pace, quickly rallying back above its pivot point and above its "max buy" level. Color code is changed to green. Found prompt support near the prior high and well above its 50 DMA line ($15.25).
>>> FEATURED STOCK ARTICLE : Powerful Rally to New High for Catalyst - 12/20/2022 |
View all notes |
Set NEW NOTE alert |
Company Profile |
SEC
News |
Chart |
Request a new note
C
A
S
I |
TITN
-
NASDAQ
Titan Machinery Inc
SPECIALTY RETAIL
|
$38.12
|
-0.34
-0.88% |
$38.40
|
226,162
113.08% of 50 DAV
50 DAV is 200,000
|
$44.35
-14.05%
|
11/30/2022
|
$40.10
|
PP = $38.68
|
|
MB = $40.61
|
Most Recent Note - 12/15/2022 4:56:40 PM
Y - Suffered a big loss today consolidating near the prior high in the $38 area which defines initial support to watch. Fundamentals remain strong after reporting Oct '22 quarterly earnings +91% on +47% sales revenues.
>>> FEATURED STOCK ARTICLE : Gap Up and Big Volume-Driven Breakout Gain - 11/30/2022 |
View all notes |
Set NEW NOTE alert |
Company Profile |
SEC
News |
Chart |
Request a new note
C
A
S
I |
MYE
-
NYSE
Myers Industries Inc
Containers/Packaging
|
$22.70
|
-0.11
-0.48% |
$22.94
|
158,485
100.31% of 50 DAV
50 DAV is 158,000
|
$25.55
-11.15%
|
12/8/2022
|
$23.94
|
PP = $25.65
|
|
MB = $26.93
|
Most Recent Note - 12/16/2022 6:41:18 PM
Y - Pulled back today for a 3rd consecutive loss with above average volume. Disciplined investors will note that it has failed thus far to produce the gains above the pivot point backed by at least +40% above average volume necessary to trigger a technical buy signal. The Sep '22 quarter showed +78% earnings on +14% sales revenues versus the year ago period. The past 4 quarterly comparisons were above the +25% minimum guideline (C criteria), however, its sales revenues growth rate has shown deceleration in sequential comparisons +45%, +29%, +24%, to +14%. Annual earnings (A criteria) history had a slight downturn in FY '19 but growth has been otherwise strong and steady.
>>> FEATURED STOCK ARTICLE : Myers Industries on Track for 9th Straight Weekly Gain - 12/8/2022 |
View all notes |
Set NEW NOTE alert |
Company Profile |
SEC
News |
Chart |
Request a new note
C
A
S
I |
BOX
-
NYSE
Box Inc Cl A
Computer Sftwr-Database
|
$30.97
|
+0.22
0.72% |
$31.40
|
1,430,895
124.97% of 50 DAV
50 DAV is 1,145,000
|
$33.04
-6.27%
|
12/12/2022
|
$29.83
|
PP = $29.57
|
|
MB = $31.05
|
Most Recent Note - 12/15/2022 4:20:55 PM
G - Pulled back today following 3 consecutive volume-driven gains, consolidating near its "max buy" level. Faces some additional resistance due to overhead supply up to the $33 level. Quarterly and annual earnings increases have been strong and steady.
>>> FEATURED STOCK ARTICLE : Volume Heavy Behind Breakout for Box Inc - 12/12/2022 |
View all notes |
Set NEW NOTE alert |
Company Profile |
SEC
News |
Chart |
Request a new note
C
A
S
I |
Symbol/Exchange
Company Name
Industry Group |
PRICE |
CHANGE
(%Change) |
Day High |
Volume
(% DAV)
(% 50 day avg vol) |
52 Wk Hi
% From Hi |
Featured
Date |
Price
Featured |
Pivot Featured |
|
Max Buy |
STRL
-
NASDAQ
Sterling Infrastructure
MATERIALS and; CONSTRUCTION - Heavy Construction
|
$30.47
|
-0.49
-1.58% |
$31.38
|
283,070
148.20% of 50 DAV
50 DAV is 191,000
|
$33.62
-9.37%
|
12/14/2022
|
$32.41
|
PP = $33.72
|
|
MB = $35.41
|
Most Recent Note - 12/15/2022 4:55:05 PM
Y - Pulled back today for a 2nd loss with lighter volume. Highlighted in yellow with pivot point cited based on its 11/08/22 high plus 10 cents in the 12/14/22 mid-day report. Consolidating for about 5 weeks in a tight range near its all-time high with volume totals cooling. Faces very little resistance due to overhead supply. Subsequent gains above the pivot point backed by at least +40% above average volume are needed to trigger a proper technical buy signal. Reported Sep '22 quarterly earnings +35% on +20% sales revenues versus the year ago period, its 5th quarterly comparison at or above the +25% minimum earnings guideline (C criteria). After years of losses it has shown improving annual earnings (A criteria) since FY '17.
>>> FEATURED STOCK ARTICLE : Sterling Infrastructure Forming Orderly Base Pattern - 12/14/2022 |
View all notes |
Set NEW NOTE alert |
Company Profile |
SEC
News |
Chart |
Request a new note
C
A
S
I |
|
|
|
THESE ARE NOT BUY RECOMMENDATIONS!
Comments contained in the body of this report are technical
opinions only. The material herein has been obtained
from sources believed to be reliable and accurate, however,
its accuracy and completeness cannot be guaranteed.
This site is not an investment advisor, hence it does
not endorse or recommend any securities or other investments.
Any recommendation contained in this report may not
be suitable for all investors and it is not to be deemed
an offer or solicitation on our part with respect to
the purchase or sale of any securities. All trademarks,
service marks and trade names appearing in this report
are the property of their respective owners, and are
likewise used for identification purposes only.
This report is a service available
only to active Paid Premium Members.
You may opt-out of receiving report notifications
at any time. Questions or comments may be submitted
by writing to Premium Membership Services 665 S.E. 10 Street, Suite 201 Deerfield Beach, FL 33441-5634 or by calling 1-800-965-8307
or 954-785-1121.
|
|
|