You are not logged in.
This means you
CAN ONLY VIEW reports that were published prior to Friday, April 25, 2025.
You
MUST UPGRADE YOUR MEMBERSHIP if you want to see any current reports.
AFTER MARKET UPDATE - FRIDAY, DECEMBER 23RD, 2022
Previous After Market Report Next After Market Report >>>
|
|
|
|
DOW |
+176.44 |
33,203.93 |
+0.53% |
|
Volume |
587,940,071 |
-29% |
|
Volume |
3,512,816,200 |
-30% |
|
NASDAQ |
+21.74 |
10,497.86 |
+0.21% |
|
Advancers |
2,029 |
67% |
|
Advancers |
2,356 |
52% |
|
S&P 500 |
+22.43 |
3,844.82 |
+0.59% |
|
Decliners |
994 |
33% |
|
Decliners |
2,157 |
48% |
|
Russell 2000 |
+6.85 |
1,760.93 |
+0.39% |
|
52 Wk Highs |
52 |
|
|
52 Wk Highs |
71 |
|
|
S&P 600 |
+7.63 |
1,160.68 |
+0.66% |
|
52 Wk Lows |
82 |
|
|
52 Wk Lows |
274 |
|
|
The market is in an uptrend under pressure (M criteria) as again this week the major averages showed the threatening look of a more serious market correction. Thin leadership has become a warning sign that the sputtering rally is lacking what it takes to be sustained.
|
 |
Indices Posted Quiet Gains Ahead of 3-Day Christmas Weekend
Kenneth J. Gruneisen - Passed the CAN SLIM® Master's Exam
The Dow added 176 points, while the Nasdaq Composite climbed 0.2%. The S&P 500 advanced 0.6% with all sectors finishing in positive territory. Despite today’s gains, the major averages finished the week mixed amid a flurry of downbeat economic data. The Dow climbed 0.9% for the week, while the S&P 500 and Nasdaq Composite fell 0.2% and 1.9%, respectively. The market will be closed on Monday in observance of the Christmas holiday. Volume totals on Friday were lighter than the prior session on the NYSE and on the Nasdaq exchange. Advancers led decliners by more than a 2-1 margin on the NYSE and by a narrower margin on the Nasdaq exchange. Leadership remained thin as there were 7 high-ranked companies from the Leaders List that hit new 52-week highs and were listed on the BreakOuts Page, versus the total of 2 on the prior session. New 52-week lows totals contracted yet still solidly outnumbered new 52-week highs totals on the NYSE and on the Nasdaq exchange. The market is in an uptrend under pressure (M criteria) while showing the threatening look of a more serious market correction. Healthy leadership (new 52-week highs totals) must continue for the rally be productive, but new highs totals have recently contracted. Only stocks meeting all key-criteria of the fact-based investment system should be considered as buy candidates. Chart courtesy of www.stockcharts.com PICTURED: The Dow Jones Industrial Average has seen volume totals cooling while consolidating above its 50-day and 200-day moving average (DMA) lines. It is currently perched -10.1% off its January 5, 2022 record high.
U.S. equities finished higher Friday as investors digested a slew of consumer data. The Personal Consumption Expenditures (PCE) Deflator (the Federal Reserve’s preferred proxy for inflation) showed prices rose 5.5% year-over-year in November, easing from the October’s 6.1% figure. Meanwhile, the Core PCE Deflator, which excludes the more volatile food and energy prices, eased less than expected to notch a 4.7% annual gain. Meanwhile, real personal spending, which accounts for inflation, stagnated in November, indicating diminishing consumer demand.
Elsewhere on the data front, new home sales unexpectedly climbed 5.8% in November, durable goods orders fell 2.1%, and capital goods orders climbed 0.2%. A final December update from the University of Michigan’s Consumer Sentiment survey showed consumer sentiment and short- and long-term inflation expectations were better-than-anticipated. Treasuries weakened, with the yield on the benchmark 10-year note up seven basis points (0.07%) to 3.75%, while the 30-year bond yield climbed eight basis points (0.08%) to 3.82%. The yield on the policy-sensitive two-year note advanced four basis points (0.04%) to 4.32%. In commodities, West Texas Intermediate (WTI) crude added 2.8% to $79.67/barrel amid reports Russia may slash oil production.
|
 Kenneth J. Gruneisen started out as a licensed stockbroker in August 1987, a couple of months prior to the historic stock market crash that took the Dow Jones Industrial Average down -22.6% in a single day. He has published daily fact-based fundamental and technical analysis on high-ranked stocks online for two decades. Through FACTBASEDINVESTING.COM, Kenneth provides educational articles, news, market commentary, and other information regarding proven investment systems that work in good times and bad.
Comments contained in the body of this report are technical opinions only and are not necessarily those of Gruneisen Growth Corp. The material herein has been obtained from sources believed to be reliable and accurate, however, its accuracy and completeness cannot be guaranteed. Our firm, employees, and customers may effect transactions, including transactions contrary to any recommendation herein, or have positions in the securities mentioned herein or options with respect thereto. Any recommendation contained in this report may not be suitable for all investors and it is not to be deemed an offer or solicitation on our part with respect to the purchase or sale of any securities. |
|
 |
Energy, Retail, and Financial Indexes Rose
Kenneth J. Gruneisen - Passed the CAN SLIM® Master's Exam
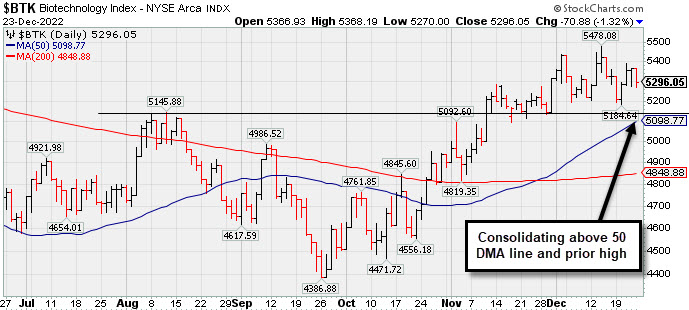
The Retail Index ($RLX +1.36%), Broker/Dealer Index ($XBD +0.63%), and Bank Index ($BKX +0.48%) posted gains and had a positive influence on the major averages. The Oil Services Index ($OSX +3.99%) and Integrated Oil Index ($XOI +3.36%) both posted standout gains on Friday. The Gold & Silver Index ($XAU +0.66%) also edged higher. The Biotech Index ($BTK -1.32%) lost ground while the Semiconductor Index ($SOX +0.09%) and Networking Index ($NWX +0.17%) both inched higher.
PICTURED: The Biotech Index ($BTK -1.32%) is consolidating above its 50-day moving average (DMA) line and prior high.
| Oil Services |
$OSX |
83.45 |
+3.20 |
+3.99% |
+58.29% |
| Integrated Oil |
$XOI |
1,784.09 |
+58.06 |
+3.36% |
+51.43% |
| Semiconductor |
$SOX |
2,535.49 |
+2.16 |
+0.09% |
-35.75% |
| Networking |
$NWX |
773.95 |
+1.29 |
+0.17% |
-20.30% |
| Broker/Dealer |
$XBD |
450.45 |
+2.82 |
+0.63% |
-7.48% |
| Retail |
$RLX |
2,770.96 |
+37.18 |
+1.36% |
-34.44% |
| Gold & Silver |
$XAU |
121.89 |
+0.80 |
+0.66% |
-7.97% |
| Bank |
$BKX |
99.30 |
+0.47 |
+0.48% |
-24.90% |
| Biotech |
$BTK |
5,296.05 |
-70.88 |
-1.32% |
-4.03% |
|
|
|
 |
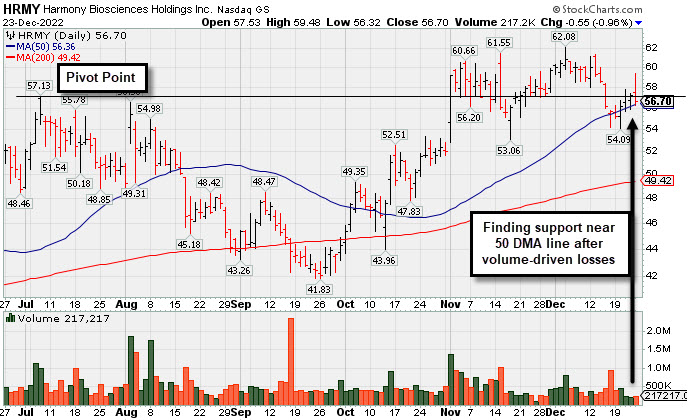
Finding Support Near Prior Highs and 50-Day Moving Average Line
Kenneth J. Gruneisen - Passed the CAN SLIM® Master's Exam
Harmony Biosciences Hldg (HRMY -$0.55 or -0.96% to $56.70) has been consolidating near its prior highs and pivot point. Its 50-day moving average (DMA) line ($56.37) and 11/17/22 low ($53.06) define important near-term support to watch.
HRMY was highlighted in yellow with new pivot point cited based on its 7/07/22 high plus 10 cents in the 11/01/22 mid-day report (read here). Bullish action came after it reported Sep '22 quarterly earnings +132% on +45% sales revenues versus the year ago period. It powered to a new 52-week high with a considerable gain and strong close above the pivot point backed by at least +200% above average volume triggering a technical buy signal. It was last shown in this FSU section on 11/28/22 with detailed analysis and an annotated graph under the headline, "Harmony Still Hovering Near All-Time High".
Prior quarterly comparisons were strong, well above the +25% minimum earnings guideline (C criteria), and it has an 80 Earnings Per Share Rating. It hails from the Medical-Biomed/Biotech industry group, currently ranked 30th on the 197 Industry Groups list (L criteria). Its annual earnings history (A criteria) is limited.
HRMY completed its $24 IPO on 8/19/20. Its small supply of only 23.1 million shares (S criteria) in the public float can contribute to greater price volatility in the event of institutional buying or selling. The number of top-rated funds owning its shares rose from 208 in Sep '21 to 450 in Sep '22, a reassuring sign concerning the I criteria. Its current Up/Down Volume Ratio of 1.2 is an unbiased indication its shares have been under slight accumulation over the past 50 days.
|
|
|
Color Codes Explained :
Y - Better candidates highlighted by our
staff of experts.
G - Previously featured
in past reports as yellow but may no longer be buyable under the
guidelines.
***Last / Change / Volume data in this table is the closing quote data***
Symbol/Exchange
Company Name
Industry Group |
PRICE |
CHANGE
(%Change) |
Day High |
Volume
(% DAV)
(% 50 day avg vol) |
52 Wk Hi
% From Hi |
Featured
Date |
Price
Featured |
Pivot Featured |
|
Max Buy |
 ESQ
-
NASDAQ
ESQ
-
NASDAQ
Esquire Financial Hldgs
Finance-Commercial Loans
|
$42.78
|
+0.04
0.09% |
$43.27
|
11,028
39.39% of 50 DAV
50 DAV is 28,000
|
$48.13
-11.12%
|
10/18/2022
|
$40.02
|
PP = $39.95
|
|
MB = $41.95
|
Most Recent Note - 12/22/2022 6:32:13 PM
G - Managed a "positive reversal" on 12/16/22 finding support above its pivot point and near prior highs in the $41 area. Gains above the 50 DMA line are needed for its outlook to improve but that short-term average has been acting as resistance. See the latest FSU analysis for more details and a new annotated graph.
>>> FEATURED STOCK ARTICLE : Found Support Recently Near Pivot Point and Prior Highs - 12/22/2022 |
View all notes |
Set NEW NOTE alert |
Company Profile |
SEC
News |
Chart |
Request a new note
C
A
S
I |
CMC
-
NYSE
Commercial Metals Co
METALS and MINING - Steel and Iron
|
$48.80
|
-0.16
-0.33% |
$49.38
|
895,185
84.37% of 50 DAV
50 DAV is 1,061,000
|
$50.83
-3.99%
|
10/14/2022
|
$41.61
|
PP = $44.45
|
|
MB = $46.67
|
Most Recent Note - 12/21/2022 5:59:13 PM
G - Managed a best-ever close with today's gain backed by lighter than average volume. Consolidating above its 50 DMA line ($46.46) and prior highs in the $46 area defining important near-term support to watch. Fundamentals remain strong.
>>> FEATURED STOCK ARTICLE : Wedging Higher With Recent Gains Lacking Great Volume - 12/2/2022 |
View all notes |
Set NEW NOTE alert |
Company Profile |
SEC
News |
Chart |
Request a new note
C
A
S
I |
VRTX
-
NASDAQ
Vertex Pharmaceuticals
Medical-Biomed/Biotech
|
$289.69
|
-4.23
-1.44% |
$294.82
|
700,769
45.92% of 50 DAV
50 DAV is 1,526,000
|
$324.75
-10.80%
|
10/24/2022
|
$308.47
|
PP = $306.05
|
|
MB = $321.35
|
 Most Recent Note - 12/23/2022 5:26:27 PM
Sputtering toward its 200 DMA line ($284) and it will be dropped from the Featured Stocks list tonight. A rebound above the 50 DMA line ($307.59) is needed for its outlook to improve. Recently reported Sep '22 quarterly earnings +14% on +18% sales revenues versus the year ago period, below the +25% minimum earnings guideline raising fundamental concerns (C criteria).
>>> FEATURED STOCK ARTICLE : Testing Support Near 50-Day Moving Average Line and Prior Pivot - 12/13/2022 |
View all notes |
Set NEW NOTE alert |
Company Profile |
SEC
News |
Chart |
Request a new note
C
A
S
I |
GPK
-
NYSE
Graphic Packaging Hldg
CONSUMER NON-DURABLES - Packaging and Containers
|
$22.18
|
+0.23
1.05% |
$22.22
|
1,857,538
59.35% of 50 DAV
50 DAV is 3,130,000
|
$24.07
-7.85%
|
10/25/2022
|
$22.75
|
PP = $24.17
|
|
MB = $25.38
|
Most Recent Note - 12/21/2022 12:29:31 PM
G - Consolidating near its 200 DMA line ($21.51) after losses raised concerns and triggered a technical sell signal. Color code was changed to green. A prompt rebound above the 50 DMA line is needed for its outlook to improve Fundamentals remain strong.
>>> FEATURED STOCK ARTICLE : Violated 50-Day Moving Average After Recently Failing to Break Out - 12/15/2022 |
View all notes |
Set NEW NOTE alert |
Company Profile |
SEC
News |
Chart |
Request a new note
C
A
S
I |
CBZ
-
NYSE
C B I Z Inc
Comml Svcs-Consulting
|
$47.26
|
+0.05
0.11% |
$47.57
|
176,309
69.96% of 50 DAV
50 DAV is 252,000
|
$51.67
-8.53%
|
10/26/2022
|
$47.83
|
PP = $48.57
|
|
MB = $51.00
|
Most Recent Note - 12/23/2022 5:23:14 PM
G - Still sputtering below its 50 DMA line ($48.10) with volume totals cooling. A rebound above the 50 DMA line is needed for its outlook to improve. Recently reported Sep '22 quarterly earnings +24% on +28% sales revenues versus the year ago period. More damaging losses below this week's low ($46.71) would raise greater concerns.
>>> FEATURED STOCK ARTICLE : Fourth Straight Loss in Slump Violating 50-Day Moving Average Line - 12/19/2022 |
View all notes |
Set NEW NOTE alert |
Company Profile |
SEC
News |
Chart |
Request a new note
C
A
S
I |
Symbol/Exchange
Company Name
Industry Group |
PRICE |
CHANGE
(%Change) |
Day High |
Volume
(% DAV)
(% 50 day avg vol) |
52 Wk Hi
% From Hi |
Featured
Date |
Price
Featured |
Pivot Featured |
|
Max Buy |
ENPH
-
NASDAQ
Enphase Energy Inc
Energy-Solar
|
$293.95
|
-4.92
-1.65% |
$303.00
|
2,337,120
63.70% of 50 DAV
50 DAV is 3,669,000
|
$339.92
-13.52%
|
10/26/2022
|
$301.55
|
PP = $324.94
|
|
MB = $341.19
|
Most Recent Note - 12/23/2022 5:30:17 PM
G - Color code is changed to green after undercutting the 12/21/22 low ($290.06) intra-day and closing the session below its 50 DMA line ($298). Only a prompt rebound above the 50 DMA line would help its outlook improve. Recent slump below its pivot point raised concerns. defines important near-term support to watch. Fundamentals remain strong.
>>> FEATURED STOCK ARTICLE : Found Support With a Solid Gain at 50-Day Moving Average Line - 12/21/2022 |
View all notes |
Set NEW NOTE alert |
Company Profile |
SEC
News |
Chart |
Request a new note
C
A
S
I |
HRMY
-
NASDAQ
Harmony Biosciences Holdings
Medical-Biomed/Biotech
|
$56.70
|
-0.55
-0.96% |
$59.48
|
217,217
45.62% of 50 DAV
50 DAV is 476,100
|
$62.09
-8.68%
|
11/1/2022
|
$55.31
|
PP = $57.23
|
|
MB = $60.09
|
Most Recent Note - 12/23/2022 5:19:55 PM
Y - Consolidating near its prior highs and pivot point. Its 50 DMA line ($56.37) and 11/17/22 low ($53.06) define important near-term support to watch. More damaging losses would raise concerns and trigger technical sell signals. For more details and a new annotated graph see the latest FSU analysis.
>>> FEATURED STOCK ARTICLE : Finding Support Near Prior Highs and 50-Day Moving Average Line - 12/23/2022 |
View all notes |
Set NEW NOTE alert |
Company Profile |
SEC
News |
Chart |
Request a new note
C
A
S
I |
CLH
-
NYSE
Clean Harbors Inc
Pollution Control
|
$114.78
|
+1.17
1.03% |
$114.91
|
119,858
29.67% of 50 DAV
50 DAV is 404,000
|
$125.41
-8.48%
|
11/2/2022
|
$121.59
|
PP = $124.59
|
|
MB = $130.82
|
Most Recent Note - 12/21/2022 5:57:07 PM
G - Posted a 2nd consecutive gain today with lighter volume after damaging losses violated its 50 DMA line ($117.20) and the recent low ($114.86 on 11/29/22) triggering technical sell signals. Only a prompt rebound above the 50 DMA line would help its outlook improve. Fundamentals remain strong.
>>> FEATURED STOCK ARTICLE : Volume-Driven Losses Undercut 50-Day Moving Average - 11/29/2022 |
View all notes |
Set NEW NOTE alert |
Company Profile |
SEC
News |
Chart |
Request a new note
C
A
S
I |
GFF
-
NYSE
Griffon Corporation
MATERIALS and CONSTRUCTION - General Building Materials
|
$35.99
|
+1.01
2.89% |
$36.12
|
747,612
189.75% of 50 DAV
50 DAV is 394,000
|
$37.69
-4.51%
|
11/10/2022
|
$34.13
|
PP = $35.02
|
|
MB = $36.77
|
Most Recent Note - 12/23/2022 12:08:19 PM
Y - Found support after recently slumping near prior highs in the $34 area. Its 50 DMA line ($33.65) defines the next important near-term support. Reported Sep '22 quarterly earnings +230% on +24% sales revenues versus the year ago period.
>>> FEATURED STOCK ARTICLE : No Meaningful Progress After Breakout 3 Weeks Ago - 12/7/2022 |
View all notes |
Set NEW NOTE alert |
Company Profile |
SEC
News |
Chart |
Request a new note
C
A
S
I |
CPRX
-
NASDAQ
Catalyst Pharma Inc
Medical-Biomed/Biotech
|
$19.01
|
-0.34
-1.76% |
$19.52
|
1,379,125
58.07% of 50 DAV
50 DAV is 2,375,000
|
$19.78
-3.89%
|
11/22/2022
|
$17.38
|
PP = $16.66
|
|
MB = $17.49
|
Most Recent Note - 12/21/2022 12:19:16 PM
G - Powering to a new all-time high with today's 3rd consecutive gain, rallying further above its "max buy" level. Found prompt support near the prior high and well above its 50 DMA line ($15.39).
>>> FEATURED STOCK ARTICLE : Powerful Rally to New High for Catalyst - 12/20/2022 |
View all notes |
Set NEW NOTE alert |
Company Profile |
SEC
News |
Chart |
Request a new note
C
A
S
I |
Symbol/Exchange
Company Name
Industry Group |
PRICE |
CHANGE
(%Change) |
Day High |
Volume
(% DAV)
(% 50 day avg vol) |
52 Wk Hi
% From Hi |
Featured
Date |
Price
Featured |
Pivot Featured |
|
Max Buy |
TITN
-
NASDAQ
Titan Machinery Inc
SPECIALTY RETAIL
|
$39.23
|
+1.12
2.94% |
$39.44
|
181,326
88.02% of 50 DAV
50 DAV is 206,000
|
$44.35
-11.54%
|
11/30/2022
|
$40.10
|
PP = $38.68
|
|
MB = $40.61
|
Most Recent Note - 12/23/2022 5:31:46 PM
Y - Posted a solid gain today with below average volume. Consolidating near the prior high in the $38 area which defines initial support to watch above its 50 DMA line ($36.08). Fundamentals remain strong after reporting Oct '22 quarterly earnings +91% on +47% sales revenues.
>>> FEATURED STOCK ARTICLE : Gap Up and Big Volume-Driven Breakout Gain - 11/30/2022 |
View all notes |
Set NEW NOTE alert |
Company Profile |
SEC
News |
Chart |
Request a new note
C
A
S
I |
MYE
-
NYSE
Myers Industries Inc
Containers/Packaging
|
$23.12
|
-0.13
-0.56% |
$23.43
|
113,392
67.90% of 50 DAV
50 DAV is 167,000
|
$25.55
-9.51%
|
12/8/2022
|
$23.94
|
PP = $25.65
|
|
MB = $26.93
|
Most Recent Note - 12/21/2022 6:01:35 PM
Y - Posted a solid gain today with +82% above average volume. Still faces resistance due to overhead supply. Disciplined investors will note that it has failed thus far to produce the gains above the pivot point backed by at least +40% above average volume necessary to trigger a technical buy signal.
>>> FEATURED STOCK ARTICLE : Myers Industries on Track for 9th Straight Weekly Gain - 12/8/2022 |
View all notes |
Set NEW NOTE alert |
Company Profile |
SEC
News |
Chart |
Request a new note
C
A
S
I |
BOX
-
NYSE
Box Inc Cl A
Computer Sftwr-Database
|
$31.01
|
-0.01
-0.03% |
$31.04
|
395,271
34.10% of 50 DAV
50 DAV is 1,159,000
|
$33.04
-6.14%
|
12/12/2022
|
$29.83
|
PP = $29.57
|
|
MB = $31.05
|
Most Recent Note - 12/21/2022 6:05:41 PM
G - Still consolidating in a tight range near its "max buy" level. Faces little very resistance due to overhead supply up to the $33 level. Quarterly and annual earnings increases have been strong and steady.
>>> FEATURED STOCK ARTICLE : Volume Heavy Behind Breakout for Box Inc - 12/12/2022 |
View all notes |
Set NEW NOTE alert |
Company Profile |
SEC
News |
Chart |
Request a new note
C
A
S
I |
STRL
-
NASDAQ
Sterling Infrastructure
MATERIALS and; CONSTRUCTION - Heavy Construction
|
$32.74
|
+0.46
1.43% |
$32.87
|
115,913
58.54% of 50 DAV
50 DAV is 198,000
|
$33.62
-2.62%
|
12/14/2022
|
$32.41
|
PP = $33.72
|
|
MB = $35.41
|
Most Recent Note - 12/21/2022 6:03:46 PM
Y - Posted a solid gain today with +32% above average volume, breaking a streak of 5 consecutive losses. Highlighted in yellow with pivot point cited based on its 11/08/22 high plus 10 cents in the 12/14/22 mid-day report. Consolidating in a tight range near its all-time high. Faces very little resistance due to overhead supply. Subsequent gains above the pivot point backed by at least +40% above average volume are needed to trigger a proper technical buy signal.
>>> FEATURED STOCK ARTICLE : Sterling Infrastructure Forming Orderly Base Pattern - 12/14/2022 |
View all notes |
Set NEW NOTE alert |
Company Profile |
SEC
News |
Chart |
Request a new note
C
A
S
I |
|
|
|
THESE ARE NOT BUY RECOMMENDATIONS!
Comments contained in the body of this report are technical
opinions only. The material herein has been obtained
from sources believed to be reliable and accurate, however,
its accuracy and completeness cannot be guaranteed.
This site is not an investment advisor, hence it does
not endorse or recommend any securities or other investments.
Any recommendation contained in this report may not
be suitable for all investors and it is not to be deemed
an offer or solicitation on our part with respect to
the purchase or sale of any securities. All trademarks,
service marks and trade names appearing in this report
are the property of their respective owners, and are
likewise used for identification purposes only.
This report is a service available
only to active Paid Premium Members.
You may opt-out of receiving report notifications
at any time. Questions or comments may be submitted
by writing to Premium Membership Services 665 S.E. 10 Street, Suite 201 Deerfield Beach, FL 33441-5634 or by calling 1-800-965-8307
or 954-785-1121.
|
|
|