You are not logged in.
This means you
CAN ONLY VIEW reports that were published prior to Thursday, March 20, 2025.
You
MUST UPGRADE YOUR MEMBERSHIP if you want to see any current reports.
AFTER MARKET UPDATE - FRIDAY, DECEMBER 22ND, 2017
Previous After Market Report Next After Market Report >>>
|
|
|
|
DOW |
-28.23 |
24,754.06 |
-0.11% |
|
Volume |
598,670,980 |
-23% |
|
Volume |
1,545,318,690 |
-14% |
|
NASDAQ |
-5.40 |
6,959.96 |
-0.08% |
|
Advancers |
1,480 |
51% |
|
Advancers |
1,267 |
45% |
|
S&P 500 |
-1.23 |
2,683.34 |
-0.05% |
|
Decliners |
1,417 |
49% |
|
Decliners |
1,554 |
55% |
|
Russell 2000 |
-4.18 |
1,542.93 |
-0.27% |
|
52 Wk Highs |
137 |
|
|
52 Wk Highs |
82 |
|
|
S&P 600 |
-2.82 |
939.34 |
-0.30% |
|
52 Wk Lows |
26 |
|
|
52 Wk Lows |
36 |
|
|
 |
Leadership Thinned as Major Averages Quietly Pulled Back
Kenneth J. Gruneisen - Passed the CAN SLIM® Master's Exam
U.S. equities inched lower on Friday. The Dow fell 28 points to 2475. The S&P 500 was down 1 point to 2683. The Nasdaq Composite lost 5 points to 6959. Volume totals reported were lighter than the prior session total on the NYSE and on the Nasdaq exchange. Advancers narrowly led decliners on the NYSE, but decliners led advancers by a 7-6 margin on the Nasdaq exchange. There were 36 high-ranked companies from the Leaders List that made new 52-week highs and were listed on the BreakOuts Page, versus the total of 66 on the prior session. New 52-week highs totals outnumbered new 52-week lows on the NYSE and on the Nasdaq exchange. The Featured Stocks Page provides the latest analysis on noteworthy high-ranked leaders. Charts used courtesy of www.stockcharts.com
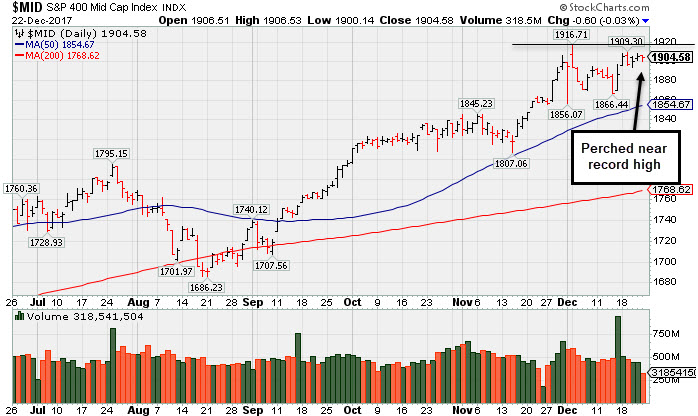 PICTURED: The S&P 400 Mid-Cap Index is perched near its record high.
The major averages (M criteria) are in a confirmed uptrend. Investors should only consider stocks meeting all key criteria of the fact-based investment system as they trigger technical buy signals.
The major averages finished lower as investors focused on economic updates and news from Washington, as President Trump signed the Tax Cuts and Jobs Act into law. On the data front, the core personal consumption expenditures price index, the Federal Reserve’s preferred gauge of inflation, rose 1.5% year-over-year in November, matching expectations. A separate report revealed new home sales rose a surprising 17.5% in November, exceeding expectations of a 4.4% decline and reaching the highest level since July 2007. Additional reports showed personal income and personal spending remained strong in November, while durable goods orders and the University of Michigan consumer sentiment both cooled last month.
Seven of 11 sectors in the S&P 500 finished higher, with Energy stocks outperforming and Financials lagging. In earnings news, shares of Nike (NKE -2.29%) fell despite the company topping analyst expectations on the top and bottom line. The loss appears to be attributed to muted current-quarter revenue growth.
Treasuries were essentially unchanged, with the yield on the 10-year note steady at 2.48%. In commodities, NYMEX WTI crude lost less than 0.1% to $58.35/barrel. COMEX gold was up 0.6% to $1275.10/ounce despite a stronger dollar. |
 Kenneth J. Gruneisen started out as a licensed stockbroker in August 1987, a couple of months prior to the historic stock market crash that took the Dow Jones Industrial Average down -22.6% in a single day. He has published daily fact-based fundamental and technical analysis on high-ranked stocks online for two decades. Through FACTBASEDINVESTING.COM, Kenneth provides educational articles, news, market commentary, and other information regarding proven investment systems that work in good times and bad.
Comments contained in the body of this report are technical opinions only and are not necessarily those of Gruneisen Growth Corp. The material herein has been obtained from sources believed to be reliable and accurate, however, its accuracy and completeness cannot be guaranteed. Our firm, employees, and customers may effect transactions, including transactions contrary to any recommendation herein, or have positions in the securities mentioned herein or options with respect thereto. Any recommendation contained in this report may not be suitable for all investors and it is not to be deemed an offer or solicitation on our part with respect to the purchase or sale of any securities. |
|
 |
Gold & Silver Index and Biotech Index Rose
Kenneth J. Gruneisen - Passed the CAN SLIM® Master's Exam
Commodity-linked groups had a positive bias on Friday as the Gold & Silver Index ($XAU +0.75%) outpaced the Integrated Oil Index ($XOI +0.27%) and the Oil Services Index ($OSX +0.08%). The Bank Index ($BKX -0.16%), Broker/Dealer Index ($XBD -0.14%) and Retail Index ($RLX -0.05%) each ended slightly in the red. The Biotechnology Index ($BTK +0.52%) led the tech sector while the Networking Index ($NWX -0.20%) and the Semiconductor Index ($SOX -0.05%) finished slightly in the red. Charts courtesy wwwstockcharts.com
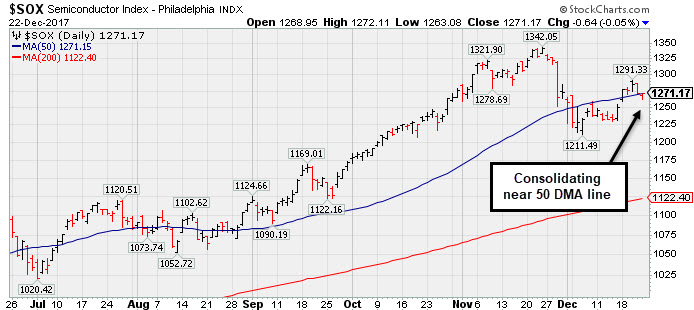 PICTURED: The Semiconductor Index ($SOX -0.05%) is consolidating near its 50-day moving average (DMA) line.
| Oil Services |
$OSX |
146.46 |
+0.12 |
+0.08% |
-20.31% |
| Integrated Oil |
$XOI |
1,327.01 |
+3.57 |
+0.27% |
+4.72% |
| Semiconductor |
$SOX |
1,271.17 |
-0.64 |
-0.05% |
+40.23% |
| Networking |
$NWX |
497.64 |
-1.00 |
-0.20% |
+11.55% |
| Broker/Dealer |
$XBD |
267.39 |
-0.39 |
-0.14% |
+30.26% |
| Retail |
$RLX |
1,731.88 |
-0.92 |
-0.05% |
+28.96% |
| Gold & Silver |
$XAU |
84.01 |
+0.63 |
+0.76% |
+6.53% |
| Bank |
$BKX |
107.95 |
-0.17 |
-0.16% |
+17.61% |
| Biotech |
$BTK |
4,202.95 |
+21.55 |
+0.52% |
+36.68% |
|
|
|
 |
Sales Revenues Growth Rate Shows Acceleration
Kenneth J. Gruneisen - Passed the CAN SLIM® Master's Exam
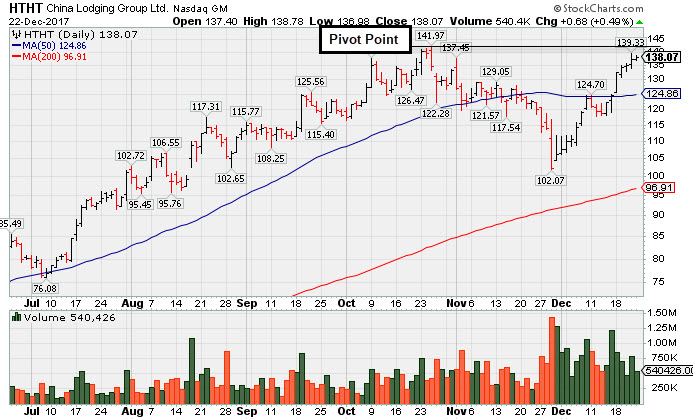
China Lodging Group Ads (HTHT +$0.68 or +0.49% to $138.07) color code was changed to yellow with a new pivot point cited based on its 10/25/17 high plus 10 cents. Subsequent volume-driven gains for new highs may trigger a new (or add-on) technical buy signal.
It has posted 7 consecutive gains while approaching prior highs. The rebound above its 50-day moving average (DMA) line ($125.36) helped its outlook to improve since last shown in this FSU section on 11/29/17 with an annotated graph under the headline, "Weak Technical Action Raises Concerns Despite Strong Fundamentals". There were "negative reversals" on 10/25/17 and 11/01/17 noted as it abruptly retreated from its all-time high after proposing a new Public Offering.
Fundamentals remain strong, as it reported Sep '17 quarterly earnings +58% on +34% sales revenues versus the year ago period, above the +25% minimum earnings guideline (C criteria). Sequential quarterly comparisons have also shown encouraging sales revenues growth acceleration, up +4%, +18%, and +34% in the Mar, Jun, and Sep '17 quarters, respectively.
HTHT traded up as much as +267.4% since first featured in yellow in the 7/13/16 mid-day report (read here). The number of top-rated funds owing its shares rose from 87 in Sep '15 to 230 in Sep '17 a reassuring sign concerning the I criteria.
Currently the high-ranked Leisure- Lodging firm has an A Timeliness rating, and an A Sponsorship rating. Its small supply of 27.3 million shares (S criteria) in the public float may contribute to greater price volatility in the event of institutional buying or selling.
|
|
|
Color Codes Explained :
Y - Better candidates highlighted by our
staff of experts.
G - Previously featured
in past reports as yellow but may no longer be buyable under the
guidelines.
***Last / Change / Volume data in this table is the closing quote data***
Symbol/Exchange
Company Name
Industry Group |
PRICE |
CHANGE
(%Change) |
Day High |
Volume
(% DAV)
(% 50 day avg vol) |
52 Wk Hi
% From Hi |
Featured
Date |
Price
Featured |
Pivot Featured |
|
Max Buy |
THO
-
NYSE
Thor Industries Inc
AUTOMOTIVE - Recreational Vehicles
|
$151.83
|
-0.51
-0.33% |
$152.31
|
286,281
44.87% of 50 DAV
50 DAV is 638,000
|
$156.86
-3.21%
|
12/19/2017
|
$153.92
|
PP = $156.96
|
|
MB = $164.81
|
Most Recent Note - 12/19/2017 4:39:12 PM
Y - Formed an advanced "3-week tight base and a new pivot point is cited while its color code is changed to yellow. Subsequent gains above the pivot point backed by at least +40% above average volume may trigger a new (or add-on) technical buys signal. Challenged its all-time high today but quietly ended the session in the red. Its 50 DMA line and prior highs in the $138 area define near-term support to watch. Reported earnings +63% on +31% sales revenues for the Oct '17 quarter, continuing its strong earnings track record.
>>> FEATURED STOCK ARTICLE : Very Extended From Prior Base and Hovering Near Record High - 12/7/2017 |
View all notes |
Set NEW NOTE alert |
Company Profile |
SEC
News |
Chart |
Request a new note
C
A
S
I |
PFBC
-
NASDAQ
Preferred Bank Los Angls
BANKING - Regional - Pacific Banks
|
$60.60
|
-0.99
-1.61% |
$61.58
|
63,326
82.56% of 50 DAV
50 DAV is 76,700
|
$66.58
-8.98%
|
10/10/2017
|
$59.38
|
PP = $59.08
|
|
MB = $62.03
|
Most Recent Note - 12/19/2017 4:12:57 PM
Y - Color code is changed to yellow while quietly consolidating below its "max buy" level. Met resistance in the $66 area and found support near its 50 DMA line ($60.93). Fundamentals remain strong.
>>> FEATURED STOCK ARTICLE : Challenged High After Finding Support at 50 Day Moving Average - 12/5/2017 |
View all notes |
Set NEW NOTE alert |
Company Profile |
SEC
News |
Chart |
Request a new note
C
A
S
I |
AVGO
-
NASDAQ
Avago Technologies Ltd
ELECTRONICS - Semiconductor - Broad Line
|
$262.35
|
+0.82
0.31% |
$263.37
|
1,461,680
43.39% of 50 DAV
50 DAV is 3,368,900
|
$285.68
-8.17%
|
10/30/2017
|
$261.19
|
PP = $259.46
|
|
MB = $272.43
|
Most Recent Note - 12/19/2017 4:23:50 PM
G - Recently finding support near its 50 DMA line ($261.91). More damaging losses beyond the recent low ($254.20 on 12/06/17) would raise greater concerns. Fundamentals remain strong.
>>> FEATURED STOCK ARTICLE : Testing Support at Prior Highs and 50-Day Average - 12/8/2017 |
View all notes |
Set NEW NOTE alert |
Company Profile |
SEC
News |
Chart |
Request a new note
C
A
S
I |
TPL
-
NYSE
Texas Pacific Land Trust
FINANCIAL SERVICES - Diversified Investments
|
$433.00
|
+14.65
3.50% |
$433.70
|
10,827
83.28% of 50 DAV
50 DAV is 13,000
|
$434.99
-0.46%
|
12/21/2017
|
$419.50
|
PP = $435.09
|
|
MB = $456.84
|
 Most Recent Note - 12/22/2017 6:41:05 PM
Y - Managed a best-ever close as it posted a big 5th consecutive gain today but volume was below average. Highlighted in yellow with pivot point cited based on its 10/13/17 high plus 10 cents in the 12/21/17 mid-day report. Subsequent gains above the pivot point backed by at least +40% above average volume are needed to trigger a proper technical buy signal. See the latest FSU analysis for more details and an annotated graph.
>>> FEATURED STOCK ARTICLE : Real Estate Trust Perched Within Striking Distance of Prior High - 12/21/2017 |
View all notes |
Set NEW NOTE alert |
Company Profile |
SEC
News |
Chart |
Request a new note
C
A
S
I |
YY
-
NASDAQ
YY Inc Ads
INTERNET - Internet Service Providers
|
$114.60
|
-1.04
-0.90% |
$117.29
|
490,108
32.41% of 50 DAV
50 DAV is 1,512,000
|
$123.48
-7.19%
|
9/25/2017
|
$80.26
|
PP = $83.10
|
|
MB = $87.26
|
Most Recent Note - 12/22/2017 6:42:59 PM
G - Found support above its prior high ($97.59 on 10/16/17) and above its 50 DMA line ($101.20) while building on a new base. Fundamentals remain strong.
>>> FEATURED STOCK ARTICLE : Fundamentals Remain Strong; Extended From Any Sound Base - 12/11/2017 |
View all notes |
Set NEW NOTE alert |
Company Profile |
SEC
News |
Chart |
Request a new note
C
A
S
I |
Symbol/Exchange
Company Name
Industry Group |
PRICE |
CHANGE
(%Change) |
Day High |
Volume
(% DAV)
(% 50 day avg vol) |
52 Wk Hi
% From Hi |
Featured
Date |
Price
Featured |
Pivot Featured |
|
Max Buy |
HTHT
-
NASDAQ
China Lodging Group Ads
LEISURE - Lodging
|
$138.07
|
+0.68
0.49% |
$138.78
|
540,426
87.03% of 50 DAV
50 DAV is 621,000
|
$142.80
-3.31%
|
12/22/2017
|
$138.07
|
PP = $142.90
|
|
MB = $150.05
|
Most Recent Note - 12/22/2017 6:30:21 PM
Y - Color code is changed to yellow with new pivot point cited based on its 10/25/17 high plus 10 cents. Subsequent volume-driven gains for new highs may trigger a new (or add-on) technical buy signal. Posted 7 consecutive gains while approaching prior highs. Rebounded above its 50 DMA line helping its outlook to improve. Fundamentals remain strong. See the latest FSU analysis for more details and a new annotated graph.
>>> FEATURED STOCK ARTICLE : Sales Revenues Growth Rate Shows Acceleration - 12/22/2017 |
View all notes |
Set NEW NOTE alert |
Company Profile |
SEC
News |
Chart |
Request a new note
C
A
S
I |
PATK
-
NASDAQ
Patrick Industries Inc
Bldg-Mobile/Mfg and RV
|
$68.65
|
+0.15
0.22% |
$69.73
|
117,580
83.39% of 50 DAV
50 DAV is 141,000
|
$69.05
-0.58%
|
10/26/2017
|
$90.90
|
PP = $87.90
|
|
MB = $92.30
|
Most Recent Note - 12/19/2017 4:46:07 PM
G - Pulled back from its all-time high with above average volume today. Prior high in the $64 area and its 50 DMA line ($61.26) define important near-term support to watch where violations would raise concerns. Fundamentals remain strong. Shares split 3/2 effective 12/11/17, so do not be confused by the impact on the share prices.
>>> FEATURED STOCK ARTICLE : Hovering Near High Following 3:2 Share Split - 12/15/2017 |
View all notes |
Set NEW NOTE alert |
Company Profile |
SEC
News |
Chart |
Request a new note
C
A
S
I |
ESNT
-
NYSE
Essent Group Ltd
Finance-MrtgandRel Svc
|
$45.08
|
-0.87
-1.89% |
$45.95
|
618,731
65.82% of 50 DAV
50 DAV is 940,000
|
$47.29
-4.67%
|
10/9/2017
|
$39.75
|
PP = $41.54
|
|
MB = $43.62
|
Most Recent Note - 12/19/2017 4:27:15 PM
G - Consolidating above its 50 DMA line ($43.79) and recent low ($43.07 on 12/01/17) defining near-term support. Fundamentals remain strong.
>>> FEATURED STOCK ARTICLE : Pulling Back After Recently Wedging Higher - 12/14/2017 |
View all notes |
Set NEW NOTE alert |
Company Profile |
SEC
News |
Chart |
Request a new note
C
A
S
I |
FIVE
-
NASDAQ
Five Below Inc
Retail-DiscountandVariety
|
$65.48
|
-0.52
-0.79% |
$66.17
|
896,039
90.24% of 50 DAV
50 DAV is 993,000
|
$68.89
-4.95%
|
10/6/2017
|
$57.13
|
PP = $54.23
|
|
MB = $56.94
|
Most Recent Note - 12/19/2017 5:38:47 PM
G - Touched another new all-time high but reversed into the red for a loss today on average volume. Very extended from its prior base, its 50 DMA line ($59.64) and prior highs in the $57-58 area define near-term support to watch. Fundamentals remain strong. See the latest FSU analysis for more details and a new annotated graph,
>>> FEATURED STOCK ARTICLE : Retail - Discount & Variety Firm Has Strong Fundamentals - 12/19/2017 |
View all notes |
Set NEW NOTE alert |
Company Profile |
SEC
News |
Chart |
Request a new note
C
A
S
I |
OLED
-
NASDAQ
Universal Display Corp
Elec-Misc Products
|
$175.55
|
-1.35
-0.76% |
$177.75
|
476,357
51.22% of 50 DAV
50 DAV is 930,000
|
$192.75
-8.92%
|
8/31/2017
|
$128.22
|
PP = $127.78
|
|
MB = $134.17
|
Most Recent Note - 12/21/2017 6:45:19 PM
G - Fundamentals remain strong. Has not formed a sound base pattern. The 50 DMA line ($162.93) and recent low ($158.00 on 12/05/17) define important near-term support to watch. Subsequent losses leading to violations may trigger technical sell signals.
>>> FEATURED STOCK ARTICLE : Consolidating After +50% Rally Since First Featured 8/31/17 - 12/13/2017 |
View all notes |
Set NEW NOTE alert |
Company Profile |
SEC
News |
Chart |
Request a new note
C
A
S
I |
Symbol/Exchange
Company Name
Industry Group |
PRICE |
CHANGE
(%Change) |
Day High |
Volume
(% DAV)
(% 50 day avg vol) |
52 Wk Hi
% From Hi |
Featured
Date |
Price
Featured |
Pivot Featured |
|
Max Buy |
ANET
-
NYSE
Arista Networks Inc
TELECOMMUNICATIONS - Communication Equipment
|
$236.55
|
+0.59
0.25% |
$236.86
|
627,424
72.62% of 50 DAV
50 DAV is 864,000
|
$245.65
-3.70%
|
10/27/2017
|
$195.65
|
PP = $196.37
|
|
MB = $206.19
|
Most Recent Note - 12/19/2017 4:21:05 PM
G - Tallied its 10th gain in the span of 11 sessions. Its 50 DMA line ($213) and prior low ($206.86 on 12/05/17) define important support levels. Subsequent violations would trigger technical sell signals.
>>> FEATURED STOCK ARTICLE : Halted Volume-Driven Pullback at 50-Day Moving Average Line - 12/6/2017 |
View all notes |
Set NEW NOTE alert |
Company Profile |
SEC
News |
Chart |
Request a new note
C
A
S
I |
GRUB
-
NYSE
Grubhub Inc
COMPUTER SOFTWARE and SERVICES - Technical and System Software
|
$71.74
|
+0.30
0.42% |
$72.10
|
785,531
54.29% of 50 DAV
50 DAV is 1,447,000
|
$74.81
-4.10%
|
6/21/2017
|
$47.33
|
PP = $46.94
|
|
MB = $49.29
|
Most Recent Note - 12/21/2017 6:43:54 PM
G - Retreated from its all-time high with today's loss on near average volume. Very extended from any sound base, its 50 DMA line ($63.44) defines initial support above prior highs near $57. The 2 latest quarters were below the +25% minimum earnings guideline (C criteria), raising fundamental concerns with regard to the fact-based investment system. See the latest FSU analysis for more details and an annotated graph.
>>> FEATURED STOCK ARTICLE : Extended From Any Base, Grubhub Hits Another New Record High - 12/18/2017 |
View all notes |
Set NEW NOTE alert |
Company Profile |
SEC
News |
Chart |
Request a new note
C
A
S
I |
IBP
-
NYSE
Installed Building Prod
DIVERSIFIED SERVICES - Business/Management Services
|
$74.50
|
-0.45
-0.60% |
$75.50
|
66,923
35.22% of 50 DAV
50 DAV is 190,000
|
$79.40
-6.17%
|
9/19/2017
|
$59.15
|
PP = $60.10
|
|
MB = $63.11
|
Most Recent Note - 12/19/2017 4:29:32 PM
G - Recently found support at its 50 DMA line ($68.85). Subsequent losses leading to a violation of the 50 DMA line or recent low may trigger technical sell signals. Fundamentals remain strong.
>>> FEATURED STOCK ARTICLE : Extended From Any Sound Base After Impressive Rebound and Rally - 12/1/2017 |
View all notes |
Set NEW NOTE alert |
Company Profile |
SEC
News |
Chart |
Request a new note
C
A
S
I |
OLLI
-
NASDAQ
Ollie's Bargain Outlet
Retail-DiscountandVariety
|
$53.20
|
+0.50
0.95% |
$53.35
|
305,284
59.16% of 50 DAV
50 DAV is 516,000
|
$53.50
-0.56%
|
11/21/2017
|
$46.78
|
PP = $47.00
|
|
MB = $49.35
|
Most Recent Note - 12/20/2017 5:21:10 PM
G - Extended from its prior base, holding its ground perched at its all-time high after additional volume-driven gains. Its 50 DMA line defines important near-term support coinciding with prior highs in the $46 area. Fundamentals remain strong. See the latest FSU analysis for more details and a new annotated graph.
>>> FEATURED STOCK ARTICLE : Extended From Latest Base and Perched Near Record High - 12/20/2017 |
View all notes |
Set NEW NOTE alert |
Company Profile |
SEC
News |
Chart |
Request a new note
C
A
S
I |
HLI
-
NYSE
Houlihan Lokey Inc Cl A
Finance-Invest Bnk/Bkrs
|
$45.84
|
+0.37
0.81% |
$45.91
|
155,998
61.18% of 50 DAV
50 DAV is 255,000
|
$46.99
-2.45%
|
9/18/2017
|
$37.04
|
PP = $39.78
|
|
MB = $41.77
|
Most Recent Note - 12/19/2017 4:09:05 PM
G - Perched at its all-time high, extended from any sound base. Its 50 DMA line ($42.76) defines near-term support to watch. On 10/26/17 it priced a Secondary Offering. Fundamentals remain strong.
>>> FEATURED STOCK ARTICLE : Wedging Higher With Recent Gains Lacking Great Volume - 12/12/2017 |
View all notes |
Set NEW NOTE alert |
Company Profile |
SEC
News |
Chart |
Request a new note
C
A
S
I |
Symbol/Exchange
Company Name
Industry Group |
PRICE |
CHANGE
(%Change) |
Day High |
Volume
(% DAV)
(% 50 day avg vol) |
52 Wk Hi
% From Hi |
Featured
Date |
Price
Featured |
Pivot Featured |
|
Max Buy |
|
|
|
THESE ARE NOT BUY RECOMMENDATIONS!
Comments contained in the body of this report are technical
opinions only. The material herein has been obtained
from sources believed to be reliable and accurate, however,
its accuracy and completeness cannot be guaranteed.
This site is not an investment advisor, hence it does
not endorse or recommend any securities or other investments.
Any recommendation contained in this report may not
be suitable for all investors and it is not to be deemed
an offer or solicitation on our part with respect to
the purchase or sale of any securities. All trademarks,
service marks and trade names appearing in this report
are the property of their respective owners, and are
likewise used for identification purposes only.
This report is a service available
only to active Paid Premium Members.
You may opt-out of receiving report notifications
at any time. Questions or comments may be submitted
by writing to Premium Membership Services 665 S.E. 10 Street, Suite 201 Deerfield Beach, FL 33441-5634 or by calling 1-800-965-8307
or 954-785-1121.
|
|
|