You are not logged in.
This means you
CAN ONLY VIEW reports that were published prior to Wednesday, March 26, 2025.
You
MUST UPGRADE YOUR MEMBERSHIP if you want to see any current reports.
AFTER MARKET UPDATE - TUESDAY, DECEMBER 19TH, 2017
Previous After Market Report Next After Market Report >>>
|
|
|
|
DOW |
-37.45 |
24,754.75 |
-0.15% |
|
Volume |
844,026,410 |
-8% |
|
Volume |
2,068,300,430 |
-4% |
|
NASDAQ |
-30.91 |
6,963.85 |
-0.44% |
|
Advancers |
1,051 |
36% |
|
Advancers |
997 |
38% |
|
S&P 500 |
-8.69 |
2,681.47 |
-0.32% |
|
Decliners |
1,887 |
64% |
|
Decliners |
1,608 |
62% |
|
Russell 2000 |
-12.17 |
1,536.75 |
-0.79% |
|
52 Wk Highs |
153 |
|
|
52 Wk Highs |
157 |
|
|
S&P 600 |
-8.50 |
936.62 |
-0.90% |
|
52 Wk Lows |
40 |
|
|
52 Wk Lows |
46 |
|
|
 |
Indices Drifted Lower as Senate Prepared to Vote on Tax Bill
Kenneth J. Gruneisen - Passed the CAN SLIM® Master's Exam
U.S. equities drifted lower Tuesday. The Dow fell 37 points to 24754. The S&P 500 lost 8 points to 2681. The Nasdaq Composite was down 30 points to 6963. Volume totals reported were lighter than the prior session totals on the NYSE and on the Nasdaq exchange. Decliners led advancers by a 9-5 margin on the NYSE and an 8-5 margin on the Nasdaq exchange. There were 66 high-ranked companies from the Leaders List that made new 52-week highs and were listed on the BreakOuts Page, versus the total of 103 on the prior session. New 52-week highs totals outnumbered new 52-week lows on the NYSE and on the Nasdaq exchange. The Featured Stocks Page provides the latest analysis on noteworthy high-ranked leaders. Charts used courtesy of www.stockcharts.com
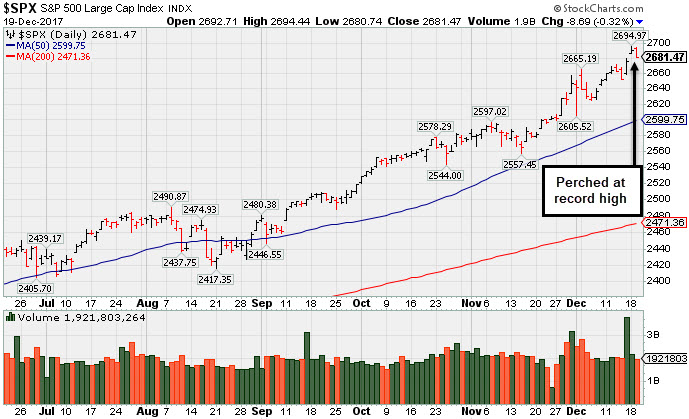 PICTURED: The S&P 500 Index is perched near its record high.
The major averages (M criteria) are in a confirmed uptrend. Investors should only consider stocks meeting all key criteria of the fact-based investment system as they trigger technical buy signals.
The major averages declined modestly as the focus remained on tax reform. The U.S. House of Representatives approved the final version of the Tax Cuts and Jobs Act on a 227-203 vote. The Senate plans to vote on the bill as early as this evening. On the data front, a report revealed housing starts rose 3.3% in November, topping expectations of a 3.1% decline. A separate release showed the current account deficit unexpectedly narrowed to $100.6 billion in the third quarter.
Eight of 11 sectors in the S&P 500 finished lower. Technology shares lagged with Apple (AAPL -1.07%) fell after being the subject of a Wall Street downgrade. Consumer Staples stocks outperformed with Altria Group Inc. (MO +1.72%) and Wal-Mart (WMT +0.92%) rising after each company received positive analyst commentary. In earnings, Darden Restaurants (DRI +6.79%) and Carnival Corp. (CCL +2.30%) rose after each company beat consensus profit forecasts.
Treasuries retreated, with the yield on the 10-year note climbing seven basis points to 2.46%, the highest level in nine months. In commodities, NYMEX WTI crude added 0.5% to $57.49/barrel. In FOREX, the U.S. Dollar Index fell 0.2% against its peers. |
 Kenneth J. Gruneisen started out as a licensed stockbroker in August 1987, a couple of months prior to the historic stock market crash that took the Dow Jones Industrial Average down -22.6% in a single day. He has published daily fact-based fundamental and technical analysis on high-ranked stocks online for two decades. Through FACTBASEDINVESTING.COM, Kenneth provides educational articles, news, market commentary, and other information regarding proven investment systems that work in good times and bad.
Comments contained in the body of this report are technical opinions only and are not necessarily those of Gruneisen Growth Corp. The material herein has been obtained from sources believed to be reliable and accurate, however, its accuracy and completeness cannot be guaranteed. Our firm, employees, and customers may effect transactions, including transactions contrary to any recommendation herein, or have positions in the securities mentioned herein or options with respect thereto. Any recommendation contained in this report may not be suitable for all investors and it is not to be deemed an offer or solicitation on our part with respect to the purchase or sale of any securities. |
|
 |
Bank and Tech Indexes Had Slightly Negative Bias
Kenneth J. Gruneisen - Passed the CAN SLIM® Master's Exam
The Bank Index ($BKX -0.40%) suffered a small loss on Tuesday as the Broker/Dealer Index ($XBD -0.16%) and Retail Index ($RLX -0.06%) both ended the day slightly in the red. The tech sector had a slightly negative bias as the Semiconductor Index ($SOX -0.11%), Networking Index ($NWX -0.27%) and the Biotechnology Index ($BTK -0.18%) each edged lower. The Oil Services Index ($OSX +0.97%) was a standout gainer, meanwhile the Integrated Oil Index ($XOI +0.03%) and the Gold & Silver Index ($XAU -0.13%) were little changed. Charts courtesy wwwstockcharts.com
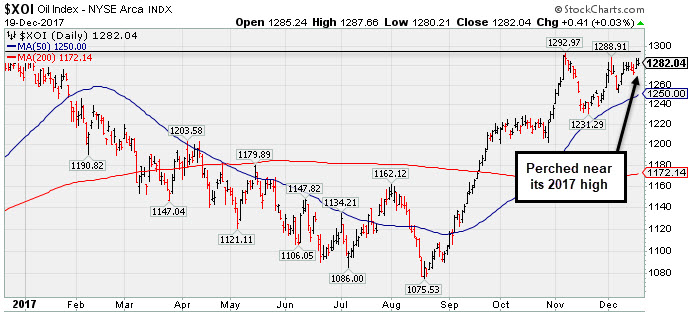 PICTURED: The Integrated Oil Index ($XOI +0.03%) is perched near its 2017 high.
| Oil Services |
$OSX |
137.96 |
+1.33 |
+0.97% |
-24.94% |
| Integrated Oil |
$XOI |
1,282.04 |
+0.41 |
+0.03% |
+1.11% |
| Semiconductor |
$SOX |
1,276.52 |
-1.39 |
-0.11% |
+40.82% |
| Networking |
$NWX |
495.93 |
-1.34 |
-0.27% |
+11.17% |
| Broker/Dealer |
$XBD |
264.96 |
-0.41 |
-0.16% |
+29.07% |
| Retail |
$RLX |
1,729.72 |
-0.98 |
-0.06% |
+28.80% |
| Gold & Silver |
$XAU |
81.57 |
-0.11 |
-0.13% |
+3.44% |
| Bank |
$BKX |
107.09 |
-0.43 |
-0.40% |
+16.67% |
| Biotech |
$BTK |
4,148.85 |
-7.31 |
-0.18% |
+34.92% |
|
|
|
 |
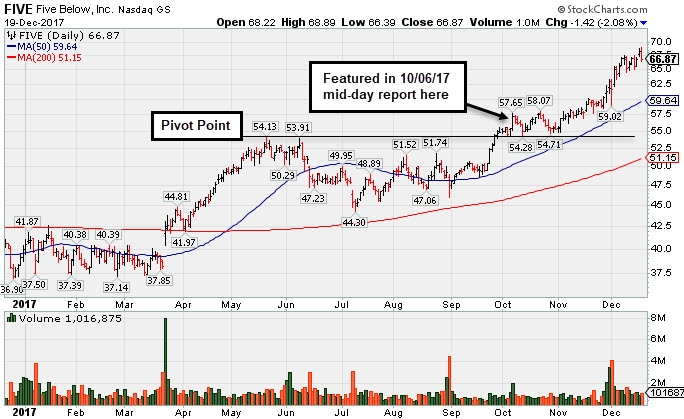
Retail - Discount & Variety Firm Has Strong Fundamentals
Kenneth J. Gruneisen - Passed the CAN SLIM® Master's Exam
Five Below Inc (FIVE -$1.42 or -2.08% to $66.87) touched a new all-time high today but reversed into the red. It is very extended from its prior base. Its 50-day moving average (DMA) line ($59.64) defines support above prior highs in the $57-58 area.
Fundamentals remain strong as it reported earnings +80% on +29% sales revenues for the Oct '17 quarter, continuing its strong earnings track record. The Retail - Discount & Variety firm has a highest possible 99 Earnings Per Share Rating and matches the fact-based investment system's winning models with a good annual earnings (A criteria) track record.It has been showing acceleration in sales revenues and earnings in sequential quarterly comparisons.
FIVE was last shown in this FSU section on 11/24/17 with an annotated graph under the headline, "Getting Extended From Prior Base With Earnings News Due ". It has traded up as much as +20.58% since highlighted in yellow with new pivot point cited based on its 5/19/17 high plus 10 cents in the 10/06/17 mid-day report (read here).
FIVE had a choppy history since its $17 IPO in July 2012 and 3 subsequent Secondary Offerings. It has a small supply of 55.2 million shares outstanding (S criteria). Its current Timeliness Rating is A and its Sponsorship Rating is B. The number of top-rated funds owning its shares rose from 432 in Jun '16 to 473 in Sep '17, a reassuring sign concerning the I criteria. Its current Up/Down Volume Ratio of 1.4 is an unbiased indication its shares have been under slight accumulation over the past 50 days.
|
|
|
Color Codes Explained :
Y - Better candidates highlighted by our
staff of experts.
G - Previously featured
in past reports as yellow but may no longer be buyable under the
guidelines.
***Last / Change / Volume data in this table is the closing quote data***
Symbol/Exchange
Company Name
Industry Group |
PRICE |
CHANGE
(%Change) |
Day High |
Volume
(% DAV)
(% 50 day avg vol) |
52 Wk Hi
% From Hi |
Featured
Date |
Price
Featured |
Pivot Featured |
|
Max Buy |
THO
-
NYSE
Thor Industries Inc
AUTOMOTIVE - Recreational Vehicles
|
$153.92
|
-0.20
-0.13% |
$156.24
|
524,784
82.13% of 50 DAV
50 DAV is 639,000
|
$156.86
-1.87%
|
12/19/2017
|
$153.92
|
PP = $156.96
|
|
MB = $164.81
|
 Most Recent Note - 12/19/2017 4:39:12 PM
Y - Formed an advanced "3-week tight base and a new pivot point is cited while its color code is changed to yellow. Subsequent gains above the pivot point backed by at least +40% above average volume may trigger a new (or add-on) technical buys signal. Challenged its all-time high today but quietly ended the session in the red. Its 50 DMA line and prior highs in the $138 area define near-term support to watch. Reported earnings +63% on +31% sales revenues for the Oct '17 quarter, continuing its strong earnings track record.
>>> FEATURED STOCK ARTICLE : Very Extended From Prior Base and Hovering Near Record High - 12/7/2017 |
View all notes |
Set NEW NOTE alert |
Company Profile |
SEC
News |
Chart |
Request a new note
C
A
S
I |
PFBC
-
NASDAQ
Preferred Bank Los Angls
BANKING - Regional - Pacific Banks
|
$61.06
|
-1.01
-1.63% |
$62.36
|
73,170
94.41% of 50 DAV
50 DAV is 77,500
|
$66.58
-8.29%
|
10/10/2017
|
$59.38
|
PP = $59.08
|
|
MB = $62.03
|
Most Recent Note - 12/19/2017 4:12:57 PM
Y - Color code is changed to yellow while quietly consolidating below its "max buy" level. Met resistance in the $66 area and found support near its 50 DMA line ($60.93). Fundamentals remain strong.
>>> FEATURED STOCK ARTICLE : Challenged High After Finding Support at 50 Day Moving Average - 12/5/2017 |
View all notes |
Set NEW NOTE alert |
Company Profile |
SEC
News |
Chart |
Request a new note
C
A
S
I |
AVGO
-
NASDAQ
Avago Technologies Ltd
ELECTRONICS - Semiconductor - Broad Line
|
$263.70
|
-0.69
-0.26% |
$265.29
|
1,905,884
56.51% of 50 DAV
50 DAV is 3,372,500
|
$285.68
-7.69%
|
10/30/2017
|
$261.19
|
PP = $259.46
|
|
MB = $272.43
|
Most Recent Note - 12/19/2017 4:23:50 PM
G - Recently finding support near its 50 DMA line ($261.91). More damaging losses beyond the recent low ($254.20 on 12/06/17) would raise greater concerns. Fundamentals remain strong.
>>> FEATURED STOCK ARTICLE : Testing Support at Prior Highs and 50-Day Average - 12/8/2017 |
View all notes |
Set NEW NOTE alert |
Company Profile |
SEC
News |
Chart |
Request a new note
C
A
S
I |
YY
-
NASDAQ
YY Inc Ads
INTERNET - Internet Service Providers
|
$111.99
|
-1.14
-1.01% |
$114.30
|
1,050,569
69.07% of 50 DAV
50 DAV is 1,521,000
|
$123.48
-9.31%
|
9/25/2017
|
$80.26
|
PP = $83.10
|
|
MB = $87.26
|
Most Recent Note - 12/18/2017 7:19:03 PM
G - Consolidating above its prior high ($97.59 on 10/16/17) and above its 50 DMA line ($99.30), still extended from any sound base. Fundamentals remain strong.
>>> FEATURED STOCK ARTICLE : Fundamentals Remain Strong; Extended From Any Sound Base - 12/11/2017 |
View all notes |
Set NEW NOTE alert |
Company Profile |
SEC
News |
Chart |
Request a new note
C
A
S
I |
HTHT
-
NASDAQ
China Lodging Group Ads
LEISURE - Lodging
|
$134.21
|
+1.80
1.36% |
$135.13
|
709,763
116.55% of 50 DAV
50 DAV is 609,000
|
$142.80
-6.02%
|
9/29/2016
|
$46.12
|
PP = $47.82
|
|
MB = $50.21
|
Most Recent Note - 12/18/2017 7:15:12 PM
G - Rebounded above its 50 DMA line ($124.91) with today's 3rd consecutive gain helping its outlook to improve. Fundamentals remain strong.
>>> FEATURED STOCK ARTICLE : Weak Technical Action Raises Concerns Despite Strong Fundamentals - 11/29/2017 |
View all notes |
Set NEW NOTE alert |
Company Profile |
SEC
News |
Chart |
Request a new note
C
A
S
I |
Symbol/Exchange
Company Name
Industry Group |
PRICE |
CHANGE
(%Change) |
Day High |
Volume
(% DAV)
(% 50 day avg vol) |
52 Wk Hi
% From Hi |
Featured
Date |
Price
Featured |
Pivot Featured |
|
Max Buy |
PATK
-
NASDAQ
Patrick Industries Inc
Bldg-Mobile/Mfg and RV
|
$66.00
|
-2.20
-3.23% |
$68.15
|
214,273
159.91% of 50 DAV
50 DAV is 134,000
|
$68.63
-3.84%
|
10/26/2017
|
$90.90
|
PP = $87.90
|
|
MB = $92.30
|
Most Recent Note - 12/19/2017 4:46:07 PM
G - Pulled back from its all-time high with above average volume today. Prior high in the $64 area and its 50 DMA line ($61.26) define important near-term support to watch where violations would raise concerns. Fundamentals remain strong. Shares split 3/2 effective 12/11/17, so do not be confused by the impact on the share prices.
>>> FEATURED STOCK ARTICLE : Hovering Near High Following 3:2 Share Split - 12/15/2017 |
View all notes |
Set NEW NOTE alert |
Company Profile |
SEC
News |
Chart |
Request a new note
C
A
S
I |
ESNT
-
NYSE
Essent Group Ltd
Finance-MrtgandRel Svc
|
$45.12
|
-0.62
-1.36% |
$46.08
|
494,458
52.77% of 50 DAV
50 DAV is 937,000
|
$47.29
-4.59%
|
10/9/2017
|
$39.75
|
PP = $41.54
|
|
MB = $43.62
|
Most Recent Note - 12/19/2017 4:27:15 PM
G - Consolidating above its 50 DMA line ($43.79) and recent low ($43.07 on 12/01/17) defining near-term support. Fundamentals remain strong.
>>> FEATURED STOCK ARTICLE : Pulling Back After Recently Wedging Higher - 12/14/2017 |
View all notes |
Set NEW NOTE alert |
Company Profile |
SEC
News |
Chart |
Request a new note
C
A
S
I |
FIVE
-
NASDAQ
Five Below Inc
Retail-DiscountandVariety
|
$66.87
|
-1.42
-2.08% |
$68.89
|
1,016,873
102.20% of 50 DAV
50 DAV is 995,000
|
$68.77
-2.76%
|
10/6/2017
|
$57.13
|
PP = $54.23
|
|
MB = $56.94
|
Most Recent Note - 12/19/2017 5:38:47 PM
G - Touched another new all-time high but reversed into the red for a loss today on average volume. Very extended from its prior base, its 50 DMA line ($59.64) and prior highs in the $57-58 area define near-term support to watch. Fundamentals remain strong. See the latest FSU analysis for more details and a new annotated graph,
>>> FEATURED STOCK ARTICLE : Retail - Discount & Variety Firm Has Strong Fundamentals - 12/19/2017 |
View all notes |
Set NEW NOTE alert |
Company Profile |
SEC
News |
Chart |
Request a new note
C
A
S
I |
OLED
-
NASDAQ
Universal Display Corp
Elec-Misc Products
|
$179.35
|
+1.00
0.56% |
$180.00
|
735,149
78.88% of 50 DAV
50 DAV is 932,000
|
$192.75
-6.95%
|
8/31/2017
|
$128.22
|
PP = $127.78
|
|
MB = $134.17
|
Most Recent Note - 12/18/2017 7:18:05 PM
G - Fundamentals remain strong. Has not formed a sound base pattern. The recent low ($158.00 on 12/05/17) and 50 DMA line ($159.97) define important near-term support to watch. Subsequent losses leading to violations may trigger technical sell signals.
>>> FEATURED STOCK ARTICLE : Consolidating After +50% Rally Since First Featured 8/31/17 - 12/13/2017 |
View all notes |
Set NEW NOTE alert |
Company Profile |
SEC
News |
Chart |
Request a new note
C
A
S
I |
ANET
-
NYSE
Arista Networks Inc
TELECOMMUNICATIONS - Communication Equipment
|
$236.00
|
+0.61
0.26% |
$238.34
|
830,354
97.80% of 50 DAV
50 DAV is 849,000
|
$245.65
-3.93%
|
10/27/2017
|
$195.65
|
PP = $196.37
|
|
MB = $206.19
|
Most Recent Note - 12/19/2017 4:21:05 PM
G - Tallied its 10th gain in the span of 11 sessions. Its 50 DMA line ($213) and prior low ($206.86 on 12/05/17) define important support levels. Subsequent violations would trigger technical sell signals.
>>> FEATURED STOCK ARTICLE : Halted Volume-Driven Pullback at 50-Day Moving Average Line - 12/6/2017 |
View all notes |
Set NEW NOTE alert |
Company Profile |
SEC
News |
Chart |
Request a new note
C
A
S
I |
Symbol/Exchange
Company Name
Industry Group |
PRICE |
CHANGE
(%Change) |
Day High |
Volume
(% DAV)
(% 50 day avg vol) |
52 Wk Hi
% From Hi |
Featured
Date |
Price
Featured |
Pivot Featured |
|
Max Buy |
GRUB
-
NYSE
Grubhub Inc
COMPUTER SOFTWARE and SERVICES - Technical and System Software
|
$73.18
|
-0.48
-0.65% |
$73.66
|
647,421
44.71% of 50 DAV
50 DAV is 1,448,000
|
$73.67
-0.67%
|
6/21/2017
|
$47.33
|
PP = $46.94
|
|
MB = $49.29
|
Most Recent Note - 12/18/2017 7:22:07 PM
G - Hit yet another new all-time high with today's gain backed by lighter than average volume, getting very extended from any sound base. Its 50 DMA line ($62.17) defines initial support above prior highs near $57. The 2 latest quarters were below the +25% minimum earnings guideline (C criteria), raising fundamental concerns with regard to the fact-based investment system. See the latest FSU analysis for more details and a new annotated graph.
>>> FEATURED STOCK ARTICLE : Extended From Any Base, Grubhub Hits Another New Record High - 12/18/2017 |
View all notes |
Set NEW NOTE alert |
Company Profile |
SEC
News |
Chart |
Request a new note
C
A
S
I |
IBP
-
NYSE
Installed Building Prod
DIVERSIFIED SERVICES - Business/Management Services
|
$73.05
|
-2.05
-2.73% |
$75.10
|
199,972
106.94% of 50 DAV
50 DAV is 187,000
|
$79.40
-8.00%
|
9/19/2017
|
$59.15
|
PP = $60.10
|
|
MB = $63.11
|
Most Recent Note - 12/19/2017 4:29:32 PM
G - Recently found support at its 50 DMA line ($68.85). Subsequent losses leading to a violation of the 50 DMA line or recent low may trigger technical sell signals. Fundamentals remain strong.
>>> FEATURED STOCK ARTICLE : Extended From Any Sound Base After Impressive Rebound and Rally - 12/1/2017 |
View all notes |
Set NEW NOTE alert |
Company Profile |
SEC
News |
Chart |
Request a new note
C
A
S
I |
OLLI
-
NASDAQ
Ollie's Bargain Outlet
Retail-DiscountandVariety
|
$52.35
|
-0.15
-0.29% |
$53.10
|
716,635
142.47% of 50 DAV
50 DAV is 503,000
|
$53.25
-1.69%
|
11/21/2017
|
$46.78
|
PP = $47.00
|
|
MB = $49.35
|
Most Recent Note - 12/19/2017 12:38:17 PM
G - Perched at its all-time high after additional volume-driven gains, getting more extended from its prior base. Its 50 DMA line ($46.44) defines important near-term support coinciding with prior highs in the $46 area. Fundamentals remain strong.
>>> FEATURED STOCK ARTICLE : Recently Stalled After Reaching a New High - 11/27/2017 |
View all notes |
Set NEW NOTE alert |
Company Profile |
SEC
News |
Chart |
Request a new note
C
A
S
I |
HLI
-
NYSE
Houlihan Lokey Inc Cl A
Finance-Invest Bnk/Bkrs
|
$45.28
|
-0.36
-0.79% |
$45.86
|
107,176
41.54% of 50 DAV
50 DAV is 258,000
|
$46.99
-3.64%
|
9/18/2017
|
$37.04
|
PP = $39.78
|
|
MB = $41.77
|
Most Recent Note - 12/19/2017 4:09:05 PM
G - Perched at its all-time high, extended from any sound base. Its 50 DMA line ($42.76) defines near-term support to watch. On 10/26/17 it priced a Secondary Offering. Fundamentals remain strong.
>>> FEATURED STOCK ARTICLE : Wedging Higher With Recent Gains Lacking Great Volume - 12/12/2017 |
View all notes |
Set NEW NOTE alert |
Company Profile |
SEC
News |
Chart |
Request a new note
C
A
S
I |
|
|
|
THESE ARE NOT BUY RECOMMENDATIONS!
Comments contained in the body of this report are technical
opinions only. The material herein has been obtained
from sources believed to be reliable and accurate, however,
its accuracy and completeness cannot be guaranteed.
This site is not an investment advisor, hence it does
not endorse or recommend any securities or other investments.
Any recommendation contained in this report may not
be suitable for all investors and it is not to be deemed
an offer or solicitation on our part with respect to
the purchase or sale of any securities. All trademarks,
service marks and trade names appearing in this report
are the property of their respective owners, and are
likewise used for identification purposes only.
This report is a service available
only to active Paid Premium Members.
You may opt-out of receiving report notifications
at any time. Questions or comments may be submitted
by writing to Premium Membership Services 665 S.E. 10 Street, Suite 201 Deerfield Beach, FL 33441-5634 or by calling 1-800-965-8307
or 954-785-1121.
|
|
|