You are not logged in.
This means you
CAN ONLY VIEW reports that were published prior to Friday, April 11, 2025.
You
MUST UPGRADE YOUR MEMBERSHIP if you want to see any current reports.
AFTER MARKET UPDATE - THURSDAY, DECEMBER 21ST, 2017
Previous After Market Report Next After Market Report >>>
|
|
|
|
DOW |
+55.64 |
24,782.29 |
+0.23% |
|
Volume |
779,867,030 |
+0% |
|
Volume |
1,806,690,590 |
-3% |
|
NASDAQ |
+4.40 |
6,965.36 |
+0.06% |
|
Advancers |
1,785 |
61% |
|
Advancers |
1,670 |
59% |
|
S&P 500 |
+5.32 |
2,684.57 |
+0.20% |
|
Decliners |
1,135 |
39% |
|
Decliners |
1,140 |
41% |
|
Russell 2000 |
+7.03 |
1,547.11 |
+0.46% |
|
52 Wk Highs |
189 |
|
|
52 Wk Highs |
102 |
|
|
S&P 600 |
+3.96 |
942.16 |
+0.42% |
|
52 Wk Lows |
40 |
|
|
52 Wk Lows |
36 |
|
|
 |
Breadth Slightly Positive as Major Indices Rose
Kenneth J. Gruneisen - Passed the CAN SLIM® Master's Exam
U.S. equities finished higher Thursday. The Dow climbed 55 points to 24782. The S&P 500 added 5 points to 2684. The Nasdaq Composite was up 4 points to 6965. Volume totals reported were near the prior session total on the NYSE and lighter on the Nasdaq exchange. Advancers led decliners by a 3-2 margin on the NYSE and by a 4-3 margin on the Nasdaq exchange. There were 66 high-ranked companies from the Leaders List that made new 52-week highs and were listed on the BreakOuts Page, versus the total of 60 on the prior session. New 52-week highs totals outnumbered new 52-week lows on the NYSE and on the Nasdaq exchange. The Featured Stocks Page provides the latest analysis on noteworthy high-ranked leaders. Charts used courtesy of www.stockcharts.com
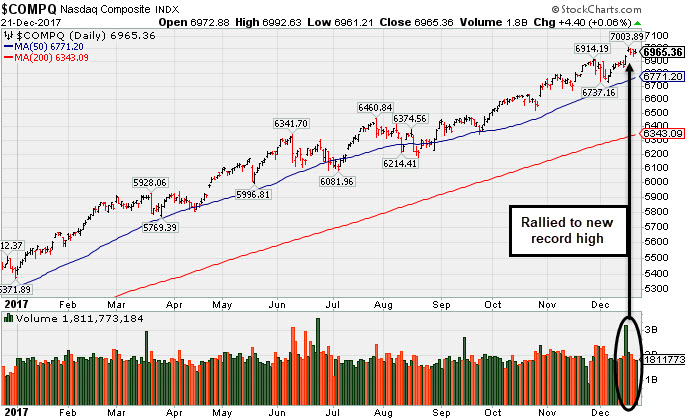 PICTURED: The Nasdaq Composite Index is perched near its record high.
The major averages (M criteria) are in a confirmed uptrend. Investors should only consider stocks meeting all key criteria of the fact-based investment system as they trigger technical buy signals.
The major averages advanced as investors focused on potential tax reform benefits following yesterday’s Congressional approval of the Tax Cuts and Jobs Act. On the data front, initial jobless claims came in at 245,000, above expectations of 233,000. Separately, third quarter GDP was revised down to show a 3.2% annual increase, though still the best reading since 2014. Finally, an index of leading indicators rose 0.4% in November, matching expectations.
Six of 11 sectors in the S&P 500 traded in positive territory with Energy and Financials fueling the advance. Chevron Corp. (CVX +3.25%) and Goldman Sachs (GS +2.28%) both rose. Utilities lagged as PG&E (PCG -12.95%) fell on news the company suspended its dividend. Consumer Discretionary shares also beat the tape as Nike (NKE +1.86%) rose ahead of their earnings report after the close. Among companies reporting, Accenture (ACN +1.61%) rose after beating analyst expectations. Bed Bath and Beyond (BBBY -12.45%) fell after posting a 0.3% drop in same-store sales.
Treasuries were mixed, as the yield curve flattened modestly. The yield on the 10-year note declined one basis point to 2.48%. In commodities, NYMEX WTI crude added 0.3% to $58.24/barrel. |
 Kenneth J. Gruneisen started out as a licensed stockbroker in August 1987, a couple of months prior to the historic stock market crash that took the Dow Jones Industrial Average down -22.6% in a single day. He has published daily fact-based fundamental and technical analysis on high-ranked stocks online for two decades. Through FACTBASEDINVESTING.COM, Kenneth provides educational articles, news, market commentary, and other information regarding proven investment systems that work in good times and bad.
Comments contained in the body of this report are technical opinions only and are not necessarily those of Gruneisen Growth Corp. The material herein has been obtained from sources believed to be reliable and accurate, however, its accuracy and completeness cannot be guaranteed. Our firm, employees, and customers may effect transactions, including transactions contrary to any recommendation herein, or have positions in the securities mentioned herein or options with respect thereto. Any recommendation contained in this report may not be suitable for all investors and it is not to be deemed an offer or solicitation on our part with respect to the purchase or sale of any securities. |
|
 |
Financial, Retail, Commodities, and Most Tech Groups Rose
Kenneth J. Gruneisen - Passed the CAN SLIM® Master's Exam
Commodity-linked groups were unanimously higher as the Oil Services Index ($OSX +3.45%) and the Integrated Oil Index ($XOI +1.78%) both outpaced the Gold & Silver Index ($XAU +0.45%). Meanwhile, the Bank Index ($BKX +1.25%) and the Broker/Dealer Index ($XBD +1.08%) posted solid gains and Retail Index ($RLX +0.19%) edged higher. The tech sector was mixed as the Semiconductor Index ($SOX -1.06%) fell, yet the Biotechnology Index ($BTK +0.20%) and the Networking Index ($NWX +0.43%) both edged higher. Charts courtesy wwwstockcharts.com
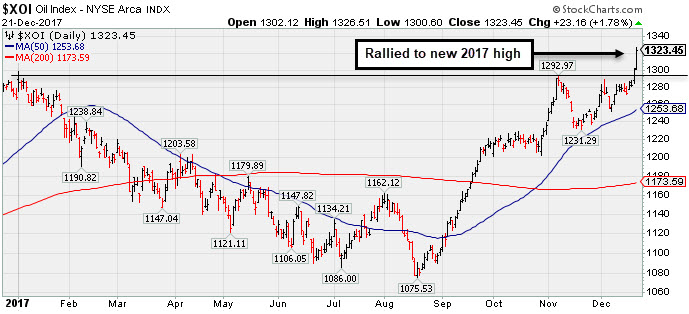 PICTURED: The Integrated Oil Index ($XOI +1.78%) has rallied to new 2017 highs. It is up +23% from its August low.
| Oil Services |
$OSX |
146.34 |
+4.87 |
+3.44% |
-20.38% |
| Integrated Oil |
$XOI |
1,323.45 |
+23.16 |
+1.78% |
+4.37% |
| Semiconductor |
$SOX |
1,271.81 |
-13.63 |
-1.06% |
+40.30% |
| Networking |
$NWX |
498.64 |
+2.15 |
+0.43% |
+11.78% |
| Broker/Dealer |
$XBD |
267.78 |
+2.87 |
+1.08% |
+30.45% |
| Retail |
$RLX |
1,732.80 |
+3.23 |
+0.19% |
+29.03% |
| Gold & Silver |
$XAU |
83.38 |
+0.37 |
+0.45% |
+5.73% |
| Bank |
$BKX |
108.12 |
+1.33 |
+1.25% |
+17.79% |
| Biotech |
$BTK |
4,181.39 |
+8.16 |
+0.20% |
+35.98% |
|
|
|
 |
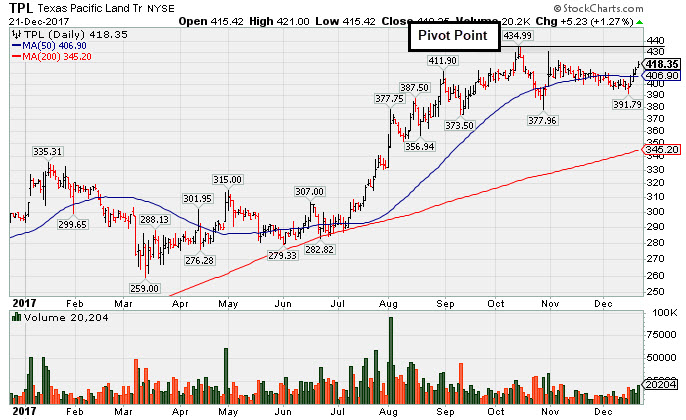
Real Estate Trust Perched Within Striking Distance of Prior High
Kenneth J. Gruneisen - Passed the CAN SLIM® Master's Exam
Texas Pacific Land Trust (TPL +$5.23 or +1.27% to $418.35) was highlighted in yellow with pivot point cited based on its 10/13/17 high plus 10 cents in the earlier mid-day report (read here). It rebounded above its 50-day moving average (DMA) line ($406) this week, helping its outlook. It is within striking distance of prior highs. Subsequent volume-driven gains above the pivot point are needed to trigger a technical buy signal under the fact-based investment system's rules. Disciplined investors know that fresh proof of institutional buying is needed before action may be warranted.
The thinly-traded Texas Real Estate Development firm has only 7.9 million shares outstanding (S criteria). It reported earnings +200% on +198% sales revenues for the Sep '17 quarter, marking its 4th very strong quarterly comparison above the +25% minimum guideline (C criteria). Annual earnings (A criteria) history has been strong.
The number of top-rated funds owning its shares rose from 37 in Dec '16 to 52 in Sep '17, a reassuring sign concerning the I criteria. The current Up/Down Volume ratio of 1.0 is an unbiased indication that institutional accumulation/distribution action has been neutral over the past 50 days. It has earned a Timeliness rating of B and a Sponsorship Rating of C.
|
|
|
Color Codes Explained :
Y - Better candidates highlighted by our
staff of experts.
G - Previously featured
in past reports as yellow but may no longer be buyable under the
guidelines.
***Last / Change / Volume data in this table is the closing quote data***
Symbol/Exchange
Company Name
Industry Group |
PRICE |
CHANGE
(%Change) |
Day High |
Volume
(% DAV)
(% 50 day avg vol) |
52 Wk Hi
% From Hi |
Featured
Date |
Price
Featured |
Pivot Featured |
|
Max Buy |
THO
-
NYSE
Thor Industries Inc
AUTOMOTIVE - Recreational Vehicles
|
$152.71
|
-0.98
-0.64% |
$154.62
|
337,335
52.54% of 50 DAV
50 DAV is 642,000
|
$156.86
-2.65%
|
12/19/2017
|
$153.92
|
PP = $156.96
|
|
MB = $164.81
|
Most Recent Note - 12/19/2017 4:39:12 PM
Y - Formed an advanced "3-week tight base and a new pivot point is cited while its color code is changed to yellow. Subsequent gains above the pivot point backed by at least +40% above average volume may trigger a new (or add-on) technical buys signal. Challenged its all-time high today but quietly ended the session in the red. Its 50 DMA line and prior highs in the $138 area define near-term support to watch. Reported earnings +63% on +31% sales revenues for the Oct '17 quarter, continuing its strong earnings track record.
>>> FEATURED STOCK ARTICLE : Very Extended From Prior Base and Hovering Near Record High - 12/7/2017 |
View all notes |
Set NEW NOTE alert |
Company Profile |
SEC
News |
Chart |
Request a new note
C
A
S
I |
PFBC
-
NASDAQ
Preferred Bank Los Angls
BANKING - Regional - Pacific Banks
|
$61.59
|
+0.42
0.69% |
$61.63
|
75,211
97.55% of 50 DAV
50 DAV is 77,100
|
$66.58
-7.49%
|
10/10/2017
|
$59.38
|
PP = $59.08
|
|
MB = $62.03
|
Most Recent Note - 12/19/2017 4:12:57 PM
Y - Color code is changed to yellow while quietly consolidating below its "max buy" level. Met resistance in the $66 area and found support near its 50 DMA line ($60.93). Fundamentals remain strong.
>>> FEATURED STOCK ARTICLE : Challenged High After Finding Support at 50 Day Moving Average - 12/5/2017 |
View all notes |
Set NEW NOTE alert |
Company Profile |
SEC
News |
Chart |
Request a new note
C
A
S
I |
AVGO
-
NASDAQ
Avago Technologies Ltd
ELECTRONICS - Semiconductor - Broad Line
|
$261.53
|
-4.11
-1.55% |
$266.25
|
1,774,739
52.40% of 50 DAV
50 DAV is 3,386,600
|
$285.68
-8.45%
|
10/30/2017
|
$261.19
|
PP = $259.46
|
|
MB = $272.43
|
Most Recent Note - 12/19/2017 4:23:50 PM
G - Recently finding support near its 50 DMA line ($261.91). More damaging losses beyond the recent low ($254.20 on 12/06/17) would raise greater concerns. Fundamentals remain strong.
>>> FEATURED STOCK ARTICLE : Testing Support at Prior Highs and 50-Day Average - 12/8/2017 |
View all notes |
Set NEW NOTE alert |
Company Profile |
SEC
News |
Chart |
Request a new note
C
A
S
I |
TPL
-
NYSE
Texas Pacific Land Trust
FINANCIAL SERVICES - Diversified Investments
|
$418.35
|
+5.23
1.27% |
$421.00
|
20,204
155.42% of 50 DAV
50 DAV is 13,000
|
$434.99
-3.83%
|
12/21/2017
|
$419.50
|
PP = $435.09
|
|
MB = $456.84
|
 Most Recent Note - 12/21/2017 6:41:39 PM
Y - Posted a solid 4th consecutive gain today on higher volume. Highlighted in yellow with pivot point cited based on its 10/13/17 high plus 10 cents in the earlier mid-day report. Subsequent volume-driven gains above the pivot point are needed to trigger a technical buy signal. See the latest FSU analysis for more details and a new annotated graph.
>>> FEATURED STOCK ARTICLE : Real Estate Trust Perched Within Striking Distance of Prior High - 12/21/2017 |
View all notes |
Set NEW NOTE alert |
Company Profile |
SEC
News |
Chart |
Request a new note
C
A
S
I |
YY
-
NASDAQ
YY Inc Ads
INTERNET - Internet Service Providers
|
$115.64
|
+2.71
2.40% |
$119.09
|
1,240,109
82.34% of 50 DAV
50 DAV is 1,506,000
|
$123.48
-6.35%
|
9/25/2017
|
$80.26
|
PP = $83.10
|
|
MB = $87.26
|
Most Recent Note - 12/18/2017 7:19:03 PM
G - Consolidating above its prior high ($97.59 on 10/16/17) and above its 50 DMA line ($99.30), still extended from any sound base. Fundamentals remain strong.
>>> FEATURED STOCK ARTICLE : Fundamentals Remain Strong; Extended From Any Sound Base - 12/11/2017 |
View all notes |
Set NEW NOTE alert |
Company Profile |
SEC
News |
Chart |
Request a new note
C
A
S
I |
Symbol/Exchange
Company Name
Industry Group |
PRICE |
CHANGE
(%Change) |
Day High |
Volume
(% DAV)
(% 50 day avg vol) |
52 Wk Hi
% From Hi |
Featured
Date |
Price
Featured |
Pivot Featured |
|
Max Buy |
HTHT
-
NASDAQ
China Lodging Group Ads
LEISURE - Lodging
|
$137.39
|
+2.34
1.73% |
$139.33
|
785,641
128.58% of 50 DAV
50 DAV is 611,000
|
$142.80
-3.79%
|
9/29/2016
|
$46.12
|
PP = $47.82
|
|
MB = $50.21
|
Most Recent Note - 12/18/2017 7:15:12 PM
G - Rebounded above its 50 DMA line ($124.91) with today's 3rd consecutive gain helping its outlook to improve. Fundamentals remain strong.
>>> FEATURED STOCK ARTICLE : Weak Technical Action Raises Concerns Despite Strong Fundamentals - 11/29/2017 |
View all notes |
Set NEW NOTE alert |
Company Profile |
SEC
News |
Chart |
Request a new note
C
A
S
I |
PATK
-
NASDAQ
Patrick Industries Inc
Bldg-Mobile/Mfg and RV
|
$68.50
|
+1.15
1.71% |
$69.05
|
174,604
125.61% of 50 DAV
50 DAV is 139,000
|
$68.63
-0.19%
|
10/26/2017
|
$90.90
|
PP = $87.90
|
|
MB = $92.30
|
Most Recent Note - 12/19/2017 4:46:07 PM
G - Pulled back from its all-time high with above average volume today. Prior high in the $64 area and its 50 DMA line ($61.26) define important near-term support to watch where violations would raise concerns. Fundamentals remain strong. Shares split 3/2 effective 12/11/17, so do not be confused by the impact on the share prices.
>>> FEATURED STOCK ARTICLE : Hovering Near High Following 3:2 Share Split - 12/15/2017 |
View all notes |
Set NEW NOTE alert |
Company Profile |
SEC
News |
Chart |
Request a new note
C
A
S
I |
ESNT
-
NYSE
Essent Group Ltd
Finance-MrtgandRel Svc
|
$45.95
|
-0.29
-0.63% |
$46.58
|
465,797
49.40% of 50 DAV
50 DAV is 943,000
|
$47.29
-2.83%
|
10/9/2017
|
$39.75
|
PP = $41.54
|
|
MB = $43.62
|
Most Recent Note - 12/19/2017 4:27:15 PM
G - Consolidating above its 50 DMA line ($43.79) and recent low ($43.07 on 12/01/17) defining near-term support. Fundamentals remain strong.
>>> FEATURED STOCK ARTICLE : Pulling Back After Recently Wedging Higher - 12/14/2017 |
View all notes |
Set NEW NOTE alert |
Company Profile |
SEC
News |
Chart |
Request a new note
C
A
S
I |
FIVE
-
NASDAQ
Five Below Inc
Retail-DiscountandVariety
|
$66.00
|
+0.14
0.21% |
$66.52
|
727,170
73.45% of 50 DAV
50 DAV is 990,000
|
$68.89
-4.20%
|
10/6/2017
|
$57.13
|
PP = $54.23
|
|
MB = $56.94
|
Most Recent Note - 12/19/2017 5:38:47 PM
G - Touched another new all-time high but reversed into the red for a loss today on average volume. Very extended from its prior base, its 50 DMA line ($59.64) and prior highs in the $57-58 area define near-term support to watch. Fundamentals remain strong. See the latest FSU analysis for more details and a new annotated graph,
>>> FEATURED STOCK ARTICLE : Retail - Discount & Variety Firm Has Strong Fundamentals - 12/19/2017 |
View all notes |
Set NEW NOTE alert |
Company Profile |
SEC
News |
Chart |
Request a new note
C
A
S
I |
OLED
-
NASDAQ
Universal Display Corp
Elec-Misc Products
|
$176.90
|
-3.95
-2.18% |
$182.15
|
405,426
43.50% of 50 DAV
50 DAV is 932,000
|
$192.75
-8.22%
|
8/31/2017
|
$128.22
|
PP = $127.78
|
|
MB = $134.17
|
Most Recent Note - 12/21/2017 6:45:19 PM
G - Fundamentals remain strong. Has not formed a sound base pattern. The 50 DMA line ($162.93) and recent low ($158.00 on 12/05/17) define important near-term support to watch. Subsequent losses leading to violations may trigger technical sell signals.
>>> FEATURED STOCK ARTICLE : Consolidating After +50% Rally Since First Featured 8/31/17 - 12/13/2017 |
View all notes |
Set NEW NOTE alert |
Company Profile |
SEC
News |
Chart |
Request a new note
C
A
S
I |
Symbol/Exchange
Company Name
Industry Group |
PRICE |
CHANGE
(%Change) |
Day High |
Volume
(% DAV)
(% 50 day avg vol) |
52 Wk Hi
% From Hi |
Featured
Date |
Price
Featured |
Pivot Featured |
|
Max Buy |
ANET
-
NYSE
Arista Networks Inc
TELECOMMUNICATIONS - Communication Equipment
|
$235.96
|
+1.81
0.77% |
$238.40
|
608,018
70.78% of 50 DAV
50 DAV is 859,000
|
$245.65
-3.94%
|
10/27/2017
|
$195.65
|
PP = $196.37
|
|
MB = $206.19
|
Most Recent Note - 12/19/2017 4:21:05 PM
G - Tallied its 10th gain in the span of 11 sessions. Its 50 DMA line ($213) and prior low ($206.86 on 12/05/17) define important support levels. Subsequent violations would trigger technical sell signals.
>>> FEATURED STOCK ARTICLE : Halted Volume-Driven Pullback at 50-Day Moving Average Line - 12/6/2017 |
View all notes |
Set NEW NOTE alert |
Company Profile |
SEC
News |
Chart |
Request a new note
C
A
S
I |
GRUB
-
NYSE
Grubhub Inc
COMPUTER SOFTWARE and SERVICES - Technical and System Software
|
$71.44
|
-2.65
-3.58% |
$74.10
|
1,338,316
93.52% of 50 DAV
50 DAV is 1,431,000
|
$74.81
-4.50%
|
6/21/2017
|
$47.33
|
PP = $46.94
|
|
MB = $49.29
|
Most Recent Note - 12/21/2017 6:43:54 PM
G - Retreated from its all-time high with today's loss on near average volume. Very extended from any sound base, its 50 DMA line ($63.44) defines initial support above prior highs near $57. The 2 latest quarters were below the +25% minimum earnings guideline (C criteria), raising fundamental concerns with regard to the fact-based investment system. See the latest FSU analysis for more details and an annotated graph.
>>> FEATURED STOCK ARTICLE : Extended From Any Base, Grubhub Hits Another New Record High - 12/18/2017 |
View all notes |
Set NEW NOTE alert |
Company Profile |
SEC
News |
Chart |
Request a new note
C
A
S
I |
IBP
-
NYSE
Installed Building Prod
DIVERSIFIED SERVICES - Business/Management Services
|
$74.95
|
+0.60
0.81% |
$75.20
|
97,576
51.09% of 50 DAV
50 DAV is 191,000
|
$79.40
-5.60%
|
9/19/2017
|
$59.15
|
PP = $60.10
|
|
MB = $63.11
|
Most Recent Note - 12/19/2017 4:29:32 PM
G - Recently found support at its 50 DMA line ($68.85). Subsequent losses leading to a violation of the 50 DMA line or recent low may trigger technical sell signals. Fundamentals remain strong.
>>> FEATURED STOCK ARTICLE : Extended From Any Sound Base After Impressive Rebound and Rally - 12/1/2017 |
View all notes |
Set NEW NOTE alert |
Company Profile |
SEC
News |
Chart |
Request a new note
C
A
S
I |
OLLI
-
NASDAQ
Ollie's Bargain Outlet
Retail-DiscountandVariety
|
$52.70
|
+0.10
0.19% |
$53.50
|
366,282
71.26% of 50 DAV
50 DAV is 514,000
|
$53.25
-1.03%
|
11/21/2017
|
$46.78
|
PP = $47.00
|
|
MB = $49.35
|
Most Recent Note - 12/20/2017 5:21:10 PM
G - Extended from its prior base, holding its ground perched at its all-time high after additional volume-driven gains. Its 50 DMA line defines important near-term support coinciding with prior highs in the $46 area. Fundamentals remain strong. See the latest FSU analysis for more details and a new annotated graph.
>>> FEATURED STOCK ARTICLE : Extended From Latest Base and Perched Near Record High - 12/20/2017 |
View all notes |
Set NEW NOTE alert |
Company Profile |
SEC
News |
Chart |
Request a new note
C
A
S
I |
HLI
-
NYSE
Houlihan Lokey Inc Cl A
Finance-Invest Bnk/Bkrs
|
$45.47
|
+0.38
0.84% |
$45.72
|
123,299
48.16% of 50 DAV
50 DAV is 256,000
|
$46.99
-3.23%
|
9/18/2017
|
$37.04
|
PP = $39.78
|
|
MB = $41.77
|
Most Recent Note - 12/19/2017 4:09:05 PM
G - Perched at its all-time high, extended from any sound base. Its 50 DMA line ($42.76) defines near-term support to watch. On 10/26/17 it priced a Secondary Offering. Fundamentals remain strong.
>>> FEATURED STOCK ARTICLE : Wedging Higher With Recent Gains Lacking Great Volume - 12/12/2017 |
View all notes |
Set NEW NOTE alert |
Company Profile |
SEC
News |
Chart |
Request a new note
C
A
S
I |
Symbol/Exchange
Company Name
Industry Group |
PRICE |
CHANGE
(%Change) |
Day High |
Volume
(% DAV)
(% 50 day avg vol) |
52 Wk Hi
% From Hi |
Featured
Date |
Price
Featured |
Pivot Featured |
|
Max Buy |
|
|
|
THESE ARE NOT BUY RECOMMENDATIONS!
Comments contained in the body of this report are technical
opinions only. The material herein has been obtained
from sources believed to be reliable and accurate, however,
its accuracy and completeness cannot be guaranteed.
This site is not an investment advisor, hence it does
not endorse or recommend any securities or other investments.
Any recommendation contained in this report may not
be suitable for all investors and it is not to be deemed
an offer or solicitation on our part with respect to
the purchase or sale of any securities. All trademarks,
service marks and trade names appearing in this report
are the property of their respective owners, and are
likewise used for identification purposes only.
This report is a service available
only to active Paid Premium Members.
You may opt-out of receiving report notifications
at any time. Questions or comments may be submitted
by writing to Premium Membership Services 665 S.E. 10 Street, Suite 201 Deerfield Beach, FL 33441-5634 or by calling 1-800-965-8307
or 954-785-1121.
|
|
|