***Last / Change / Volume data in this table is the closing quote data***
Symbol/Exchange
Company Name
Industry Group |
PRICE |
CHANGE
(%Change) |
Day High |
Volume
(% DAV)
(% 50 day avg vol) |
52 Wk Hi
% From Hi |
Featured
Date |
Price
Featured |
Pivot Featured |
|
Max Buy |
OSBC
-
NASDAQ
Old Second Bancorp Inc
BANKING - Regional - Midwest Banks
|
$15.35
|
-0.05
-0.32% |
$15.45
|
83,268
108.28% of 50 DAV
50 DAV is 76,900
|
$16.30
-5.83%
|
5/21/2018
|
$15.50
|
PP = $15.10
|
|
MB = $15.86
|
Most Recent Note - 9/12/2018 7:27:27 PM
G - Consolidating above its 50 DMA line ($15.21). The prior low ($14) and 200 DMA line define additional near-term support. Its Relative Strength Rating is 80, at the minimum guideline for buy candidates. Met stubborn resistance after hitting a new high on 7/26/18 with a big volume-driven gain. Fundamentals remain strong.
>>> FEATURED STOCK ARTICLE : Bank Perched Less Than -5% Off Record High - 8/23/2018 |
View all notes |
Set NEW NOTE alert |
Company Profile |
SEC
News |
Chart |
Request a new note
C
A
S
I |
SIVB
-
NASDAQ
S V B Financial Group
BANKING - Regional - Pacific Banks
|
$318.57
|
-0.72
-0.23% |
$323.74
|
302,210
74.80% of 50 DAV
50 DAV is 404,000
|
$333.74
-4.55%
|
8/6/2018
|
$314.77
|
PP = $329.75
|
|
MB = $346.24
|
Most Recent Note - 9/12/2018 7:26:11 PM
Y - Slumped near its 50 DMA line ($315.25) today, and further deterioration would raise concerns. Met resistance in recent weeks near prior highs. Subsequent gains above the pivot point backed by at least +40% above average volume may trigger a convincing new technical buy signal.
>>> FEATURED STOCK ARTICLE : Bank Posted Quiet Gain for a Best-Ever Close - 8/27/2018 |
View all notes |
Set NEW NOTE alert |
Company Profile |
SEC
News |
Chart |
Request a new note
C
A
S
I |
ZBRA
-
NASDAQ
Zebra Tech Corp Cl A
COMPUTER HARDWARE - Computer Peripherals
|
$175.65
|
-3.05
-1.71% |
$179.32
|
307,806
84.10% of 50 DAV
50 DAV is 366,000
|
$179.47
-2.13%
|
8/7/2018
|
$164.26
|
PP = $161.82
|
|
MB = $169.91
|
 Most Recent Note - 9/17/2018 6:02:50 PM
G - Loss today on lighter volume broke a streak of 6 consecutive gains into new high territory. Prior high in the $161 area defines initial support above its 50 DMA line ($158) Fundamentals remain strong.
>>> FEATURED STOCK ARTICLE : Big Gain for New High Backed by Heavy Volume - 8/7/2018 |
View all notes |
Set NEW NOTE alert |
Company Profile |
SEC
News |
Chart |
Request a new note
C
A
S
I |
EPAM
-
NYSE
Epam Systems Inc
COMPUTER SOFTWARE and SERVICES - Information Technology Service
|
$139.28
|
-1.05
-0.75% |
$140.22
|
322,514
67.90% of 50 DAV
50 DAV is 475,000
|
$144.19
-3.41%
|
7/5/2018
|
$123.70
|
PP = $131.85
|
|
MB = $138.44
|
Most Recent Note - 9/14/2018 3:34:24 PM
G - Color code is changed to green while wedging above its "max buy" level with a streak of small gains backed by light volume. Prior highs in the $137 area define near term support along with its 50 DMA line ($134.63). Fundamentals remain strong.
>>> FEATURED STOCK ARTICLE : Tech Services Firm Remains Fundamentally and Technically Strong - 8/20/2018 |
View all notes |
Set NEW NOTE alert |
Company Profile |
SEC
News |
Chart |
Request a new note
C
A
S
I |
IRBT
-
NASDAQ
Irobot Corp
CONSUMER DURABLES - Electronic Equipment
|
$111.14
|
+2.42
2.23% |
$112.90
|
1,151,892
120.49% of 50 DAV
50 DAV is 956,000
|
$118.75
-6.41%
|
8/29/2018
|
$112.07
|
PP = $109.88
|
|
MB = $115.37
|
Most Recent Note - 9/13/2018 5:47:42 PM
Y - Still sputtering below its pivot point. A big loss 9/06/18 on higher volume raised concerns while negating the recent breakout. Disciplined investors always limit losses by selling any stock that falls more than -7% from their purchase price.
>>> FEATURED STOCK ARTICLE : Household Appliance Maker Rallied From Choppy Base - 8/29/2018 |
View all notes |
Set NEW NOTE alert |
Company Profile |
SEC
News |
Chart |
Request a new note
C
A
S
I |
Symbol/Exchange
Company Name
Industry Group |
PRICE |
CHANGE
(%Change) |
Day High |
Volume
(% DAV)
(% 50 day avg vol) |
52 Wk Hi
% From Hi |
Featured
Date |
Price
Featured |
Pivot Featured |
|
Max Buy |
TSC
-
NASDAQ
TriState Capital Hld Inc
CONSUMER NON-DURABLES - Personal Products
|
$28.65
|
-0.10
-0.35% |
$28.90
|
98,748
62.50% of 50 DAV
50 DAV is 158,000
|
$30.10
-4.82%
|
9/11/2018
|
$29.75
|
PP = $30.20
|
|
MB = $31.71
|
Most Recent Note - 9/13/2018 1:22:18 PM
G - Slumping today, raising concerns while violating its 50 DMA line ($28.77), and its color code is changed to green. Only a prompt rebound above the 50 DMA line would help its outlook improve. See the latest FSU analysis for more details and an annotated graph.
>>> FEATURED STOCK ARTICLE : TriState Bank Perched Near All-Time High - 9/11/2018 |
View all notes |
Set NEW NOTE alert |
Company Profile |
SEC
News |
Chart |
Request a new note
C
A
S
I |
FLT
-
NYSE
Fleetcor Technologies
DIVERSIFIED SERVICES - Business/Management Services
|
$218.75
|
-2.33
-1.05% |
$221.20
|
285,721
49.01% of 50 DAV
50 DAV is 583,000
|
$225.92
-3.17%
|
9/12/2018
|
$221.01
|
PP = $226.02
|
|
MB = $237.32
|
Most Recent Note - 9/12/2018 7:22:46 PM
Y - Color code is changed to yellow after rallying above its 50 DMA line ($217). New pivot point cited is based on its 7/25/18 high plus 10 cents. Subsequent volume-driven gains above the pivot point may trigger a new (or add-on) technical buy signal. The prior low ($210.64 on 8/03/18) defines important near-term support above its 200 DMA line($202). Fundamentals remain strong.
>>> FEATURED STOCK ARTICLE : Testing 50-Day Average With Loss on Higher Volume - 8/3/2018 |
View all notes |
Set NEW NOTE alert |
Company Profile |
SEC
News |
Chart |
Request a new note
C
A
S
I |
MA
-
NYSE
Mastercard Inc Cl A
Finance-CrdtCard/PmtPr
|
$216.47
|
-1.49
-0.68% |
$219.98
|
2,465,837
79.59% of 50 DAV
50 DAV is 3,098,000
|
$218.82
-1.07%
|
7/11/2018
|
$203.84
|
PP = $204.10
|
|
MB = $214.31
|
Most Recent Note - 9/12/2018 7:29:34 PM
Y - Quietly perched near its all-time high. Its 50 DMA line ($206) defines support above the prior lows in the $193-196 area. Fundamentals remain strong.
>>> FEATURED STOCK ARTICLE : Found Support Near 50-Day Moving Average Line - 8/10/2018 |
View all notes |
Set NEW NOTE alert |
Company Profile |
SEC
News |
Chart |
Request a new note
C
A
S
I |
V
-
NYSE
Visa Inc Cl A
Finance-CrdtCard/PmtPr
|
$146.18
|
-1.66
-1.12% |
$147.90
|
7,695,134
105.73% of 50 DAV
50 DAV is 7,278,000
|
$148.37
-1.48%
|
4/26/2018
|
$126.68
|
PP = $126.98
|
|
MB = $133.33
|
Most Recent Note - 9/13/2018 5:40:45 PM
G - Endured distributional pressure and it is extended from any sound base. Its 50 DMA line ($141) and recent low ($135.31 on 7/30/18) define important near-term support to watch on pullbacks. Fundamentals remain strong. See the latest FSU analysis for more details and an annotated graph.
>>> FEATURED STOCK ARTICLE : Visa Near Record but Endured Distributional Pressure - 9/13/2018 |
View all notes |
Set NEW NOTE alert |
Company Profile |
SEC
News |
Chart |
Request a new note
C
A
S
I |
NANO
-
NASDAQ
Nanometrics Inc
ELECTRONICS - Scientific and Technical Instrum
|
$36.81
|
+0.01
0.03% |
$37.56
|
299,317
71.78% of 50 DAV
50 DAV is 417,000
|
$48.26
-23.73%
|
8/13/2018
|
$44.17
|
PP = $44.27
|
|
MB = $46.48
|
Most Recent Note - 9/12/2018 7:12:34 PM
G - Slumped further below its 50 DMA line ($40.05) with today's 8th consecutive volume-driven loss raising concerns. A rebound above the 50 DMA line is needed for its outlook to improve. Fundamentals remain strong.
>>> FEATURED STOCK ARTICLE : Five Times Average Volume Behind Breakout Gain - 8/13/2018 |
View all notes |
Set NEW NOTE alert |
Company Profile |
SEC
News |
Chart |
Request a new note
C
A
S
I |
Symbol/Exchange
Company Name
Industry Group |
PRICE |
CHANGE
(%Change) |
Day High |
Volume
(% DAV)
(% 50 day avg vol) |
52 Wk Hi
% From Hi |
Featured
Date |
Price
Featured |
Pivot Featured |
|
Max Buy |
ENV
-
NYSE
Envestnet Inc
FINANCIAL SERVICES - Diversified Investments
|
$62.25
|
-0.85
-1.35% |
$63.00
|
250,339
92.38% of 50 DAV
50 DAV is 271,000
|
$64.80
-3.94%
|
6/15/2018
|
$57.85
|
PP = $60.37
|
|
MB = $63.39
|
Most Recent Note - 9/12/2018 7:19:17 PM
Y - Perched near its all-time high, stubbornly holding its ground. Found prompt support near its 50 DMA line ($60.23) in recent weeks. Fundamentals remain strong.
>>> FEATURED STOCK ARTICLE : Earnings News Due for Financial Firm Perched Near High - 8/6/2018 |
View all notes |
Set NEW NOTE alert |
Company Profile |
SEC
News |
Chart |
Request a new note
C
A
S
I |
TPL
-
NYSE
Texas Pacific Land Trust
Real Estate Dvlpmt/Ops
|
$829.22
|
+4.97
0.60% |
$832.13
|
7,521
57.85% of 50 DAV
50 DAV is 13,000
|
$874.00
-5.12%
|
9/14/2018
|
$820.45
|
PP = $874.10
|
|
MB = $917.81
|
Most Recent Note - 9/14/2018 12:56:15 PM
Y - Color code is changed to yellow after forming an advanced "3-weeks tight" base. New pivot point cited is based on its 8/27/18 high plus 10 cents. Subsequent volume-driven gains above the pivot point may trigger a new (or add-on) technical buy signal. The 50 DMA line ($797) and recent low ($760 on 8/15/18) define important near-term support to watch on pullbacks.
>>> FEATURED STOCK ARTICLE : Best Ever Close After a Solid Gain on Higher Volume - 9/4/2018 |
View all notes |
Set NEW NOTE alert |
Company Profile |
SEC
News |
Chart |
Request a new note
C
A
S
I |
FIZZ
-
NASDAQ
National Beverage Corp
FOOD and BEVERAGE - Beverages - Soft Drinks
|
$116.50
|
-0.42
-0.36% |
$117.73
|
254,594
128.91% of 50 DAV
50 DAV is 197,500
|
$127.32
-8.50%
|
9/6/2018
|
$125.92
|
PP = $129.92
|
|
MB = $136.42
|
Most Recent Note - 9/14/2018 4:56:54 PM
Y - Retreated from its high and ended near the session low with today's loss backed by above average volume. Highlighted in yellow with new pivot point cited based on its 9/11/17 high plus 10 cents in the 9/06/18 mid-day report, it challenged its high with a big gain backed by +111% above average volume, but met resistance. Subsequent gains above the pivot point for a a new high (N criteria) backed by at least +40% above average volume may trigger a proper technical buy signal. Reported Jun '17 quarterly earnings +32% on +20% sales revenues, continuing its streak of strong quarterly earnings (C criteria) results. Annual earnings (A criteria) growth has been strong after a downturn in FY '14. Small supply of only 11.2 million shares (S criteria) in the public float can contribute to greater volatility.
>>> FEATURED STOCK ARTICLE : Strong Beverage Firm Challenges Prior High - 9/6/2018 |
View all notes |
Set NEW NOTE alert |
Company Profile |
SEC
News |
Chart |
Request a new note
C
A
S
I |
ODFL
-
NASDAQ
Old Dominion Fght Line
TRANSPORTATION - Trucking
|
$162.13
|
-3.76
-2.27% |
$169.95
|
704,276
120.60% of 50 DAV
50 DAV is 584,000
|
$170.22
-4.75%
|
9/6/2018
|
$163.11
|
PP = $164.20
|
|
MB = $172.41
|
Most Recent Note - 9/14/2018 3:40:25 PM
Y - Volume totals have been cooling while stubbornly holding its ground. Prior highs in the $164 area define initial support to watch after aain above the pivot point on 9/06/18 backed by +80% above average volume triggered a technical buy signal.
>>> FEATURED STOCK ARTICLE : Trucking Firm Perched at All-Time High - 9/7/2018 |
View all notes |
Set NEW NOTE alert |
Company Profile |
SEC
News |
Chart |
Request a new note
C
A
S
I |
DPZ
-
NYSE
Dominos Pizza Inc
Retail-Restaurants
|
$274.60
|
-5.45
-1.95% |
$279.26
|
704,186
121.83% of 50 DAV
50 DAV is 578,000
|
$305.34
-10.07%
|
8/13/2018
|
$288.60
|
PP = $293.91
|
|
MB = $308.61
|
Most Recent Note - 9/17/2018 4:40:09 PM
G - Slumped below its 50 DMA line ($282.75) with losses backed by slightly higher volume and its color code is changed to green. A rebound above the 50 DMA line is needed for its outlook to improve.
>>> FEATURED STOCK ARTICLE : Pulling Back After Wedging Gains for Highs Lacked Great Volume - 9/5/2018 |
View all notes |
Set NEW NOTE alert |
Company Profile |
SEC
News |
Chart |
Request a new note
C
A
S
I |
Symbol/Exchange
Company Name
Industry Group |
PRICE |
CHANGE
(%Change) |
Day High |
Volume
(% DAV)
(% 50 day avg vol) |
52 Wk Hi
% From Hi |
Featured
Date |
Price
Featured |
Pivot Featured |
|
Max Buy |
FIVE
-
NASDAQ
Five Below Inc
Retail-DiscountandVariety
|
$129.28
|
-0.99
-0.76% |
$131.47
|
1,005,165
107.16% of 50 DAV
50 DAV is 938,000
|
$136.13
-5.03%
|
7/6/2018
|
$98.90
|
PP = $104.09
|
|
MB = $109.29
|
Most Recent Note - 9/14/2018 3:36:23 PM
G - Stubbornly holding its ground near its all-time high following a consider gap up and volume-driven gain on 9/07/18. Bullish action came after reporting earnings +40% on +23% sales revenues for the Jul '18 quarter, continuing its strong earnings track record. Prior highs and its 50 DMA line ($108.82) define near-term support to watch on pullbacks.
>>> FEATURED STOCK ARTICLE : Volume Totals Cooling While Perched Near Record High - 8/16/2018 |
View all notes |
Set NEW NOTE alert |
Company Profile |
SEC
News |
Chart |
Request a new note
C
A
S
I |
NOW
-
NYSE
Servicenow Inc
Computer Sftwr-Enterprse
|
$192.82
|
-10.15
-5.00% |
$201.95
|
2,312,423
133.28% of 50 DAV
50 DAV is 1,735,000
|
$206.30
-6.53%
|
8/24/2018
|
$193.83
|
PP = $194.91
|
|
MB = $204.66
|
Most Recent Note - 9/17/2018 4:45:08 PM
Y - Loss today had above average volume, indicative of distributional pressure, while retreating from its 52-week high. The 50 DMA line ($189) and recent low ($174) define important near-term support. Fundamentals remain strong.
>>> FEATURED STOCK ARTICLE : Slump Below 50-Day Average Line Raises Concerns - 8/17/2018 |
View all notes |
Set NEW NOTE alert |
Company Profile |
SEC
News |
Chart |
Request a new note
C
A
S
I |
NVEE
-
NASDAQ
N V 5 Global Inc
Comml Svcs-Consulting
|
$88.55
|
-0.65
-0.73% |
$90.10
|
53,596
70.52% of 50 DAV
50 DAV is 76,000
|
$92.75
-4.53%
|
6/15/2018
|
$7,070.00
|
PP = $72.00
|
|
MB = $75.60
|
Most Recent Note - 9/12/2018 7:31:07 PM
G - Perched near its all-time high, extended from any sound base. Completed a new Public Offering on 8/09/18. Its 50 DMA line ($81.32) defines near-term support to watch on pullbacks.
>>> FEATURED STOCK ARTICLE : Remains Perched Near All-Time High Following Offering - 8/21/2018 |
View all notes |
Set NEW NOTE alert |
Company Profile |
SEC
News |
Chart |
Request a new note
C
A
S
I |
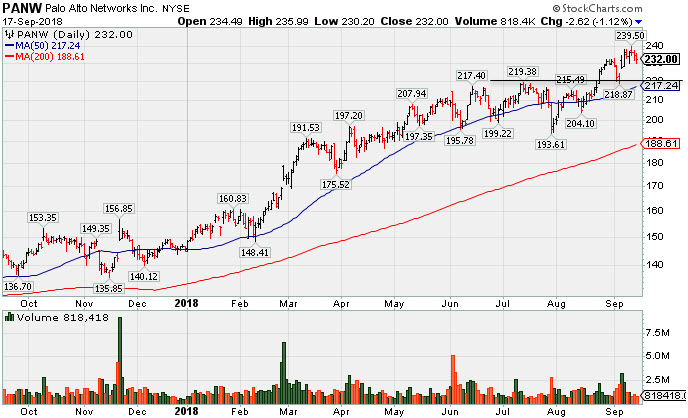
PANW
-
NYSE
Palo Alto Networks
Computer Sftwr-Security
|
$232.00
|
-2.62
-1.12% |
$235.99
|
818,418
65.47% of 50 DAV
50 DAV is 1,250,000
|
$239.50
-3.13%
|
6/12/2018
|
$206.55
|
PP = $214.69
|
|
MB = $225.42
|
Most Recent Note - 9/14/2018 3:43:56 PM
G - Volume totals have cooled while stubbornly holding its ground near its all-time high following volume-driven gains. Its 50 DMA line ($216.82) defines initial support above the prior low ($193 on 7/30/18). Reported +39% earnings on +29% sales revenues for the Jul '18 quarter, continuing its strong earnings track record.
>>> FEATURED STOCK ARTICLE : Perched Near All-Time High With Volume Totals Cooling - 9/17/2018 |
View all notes |
Set NEW NOTE alert |
Company Profile |
SEC
News |
Chart |
Request a new note
C
A
S
I |
QLYS
-
NASDAQ
Qualys Inc
Computer Sftwr-Security
|
$90.40
|
-4.20
-4.44% |
$94.40
|
319,839
96.63% of 50 DAV
50 DAV is 331,000
|
$98.30
-8.03%
|
8/31/2018
|
$91.05
|
PP = $98.40
|
|
MB = $103.32
|
Most Recent Note - 9/17/2018 4:47:48 PM
Y -Pulled back today with average volume testing its 50 DMA line ($90.36). Subsequent volume-driven gains above the pivot point may trigger a technical buy signal. The recent low ($82.91 on 8/15/18) defines the next important near term support to watch.
>>> FEATURED STOCK ARTICLE : Cloud Security Firm Faces Some Near Term Resistance - 9/3/2018 |
View all notes |
Set NEW NOTE alert |
Company Profile |
SEC
News |
Chart |
Request a new note
C
A
S
I |
Symbol/Exchange
Company Name
Industry Group |
PRICE |
CHANGE
(%Change) |
Day High |
Volume
(% DAV)
(% 50 day avg vol) |
52 Wk Hi
% From Hi |
Featured
Date |
Price
Featured |
Pivot Featured |
|
Max Buy |
ANET
-
NYSE
"Arista Networks, Inc"
TELECOMMUNICATIONS - Communication Equipment
|
$265.08
|
-6.17
-2.27% |
$272.28
|
669,446
60.65% of 50 DAV
50 DAV is 1,103,700
|
$313.37
-15.41%
|
8/24/2018
|
$308.26
|
PP = $311.77
|
|
MB = $327.36
|
Most Recent Note - 9/13/2018 5:44:23 PM
G - Color code is changed to green while sputtering below its 50 DMA line ($273.59). Found support at its 200 DMA line ($263), but more damaging losses would raise serious concerns. Subsequent gains above its 50 DMA line are needed for its outlook to improve.
>>> FEATURED STOCK ARTICLE : Considerable Gap Up Gain With Heavy Volume - 8/24/2018 |
View all notes |
Set NEW NOTE alert |
Company Profile |
SEC
News |
Chart |
Request a new note
C
A
S
I |
PAYC
-
NYSE
Paycom Software Inc
COMPUTER SOFTWARE and SERVICES - Application Software
|
$157.40
|
-5.92
-3.62% |
$163.32
|
669,767
89.30% of 50 DAV
50 DAV is 750,000
|
$164.08
-4.07%
|
8/1/2018
|
$122.87
|
PP = $118.55
|
|
MB = $124.48
|
Most Recent Note - 9/17/2018 4:46:22 PM
G - Pulled back today, retreating from its all-time high after getting very extended from any sound base. Fundamentals remain strong.
>>> FEATURED STOCK ARTICLE : Bullish Action Followed Strong Earnings News - 8/1/2018 |
View all notes |
Set NEW NOTE alert |
Company Profile |
SEC
News |
Chart |
Request a new note
C
A
S
I |
GRUB
-
NYSE
Grubhub Inc
INTERNET - Content
|
$140.28
|
-5.83
-3.99% |
$145.68
|
959,552
68.15% of 50 DAV
50 DAV is 1,408,000
|
$149.35
-6.07%
|
8/24/2018
|
$138.44
|
PP = $141.16
|
|
MB = $148.22
|
Most Recent Note - 9/17/2018 4:41:54 PM
Y - Pulled back with light volume and it remains perched near its all-time high. Recent gains lacked great volume conviction. Gains above the pivot point backed by at least +40% above average volume are needed to trigger a proper new (or add-on) technical buy signal.
>>> FEATURED STOCK ARTICLE : Hovering Near Record High Following Considerable Rally - 8/2/2018 |
View all notes |
Set NEW NOTE alert |
Company Profile |
SEC
News |
Chart |
Request a new note
C
A
S
I |
HQY
-
NASDAQ
Healthequity Inc
COMPUTER SOFTWARE and SERVICES - Healthcare Information Service
|
$91.60
|
-3.10
-3.27% |
$94.25
|
704,739
108.92% of 50 DAV
50 DAV is 647,000
|
$99.99
-8.39%
|
8/13/2018
|
$82.39
|
PP = $83.44
|
|
MB = $87.61
|
Most Recent Note - 9/17/2018 4:49:55 PM
G - Pulled back today with near average volume. Extended from any sound base, its 50 DMA line ($85.60) and prior highs in the $82-83 area define support to watch.
>>> FEATURED STOCK ARTICLE : Very Extended From Any Sound Base After Streak of Gains - 9/10/2018 |
View all notes |
Set NEW NOTE alert |
Company Profile |
SEC
News |
Chart |
Request a new note
C
A
S
I |
PYPL
-
NASDAQ
Paypal Holdings Inc
Finance-CrdtCard/PmtPr
|
$88.68
|
-2.10
-2.31% |
$91.30
|
9,260,730
128.85% of 50 DAV
50 DAV is 7,187,000
|
$93.70
-5.36%
|
7/23/2018
|
$89.24
|
PP = $87.55
|
|
MB = $91.93
|
Most Recent Note - 9/17/2018 5:58:21 PM
Y - Posted a 3rd consecutive loss with above average volume and its color code is changed to yellow after falling back below its "max buy" level. Its 50 DMA line ($88.07) defines support above prior lows in the $80-81 area.
>>> FEATURED STOCK ARTICLE : Consolidating Above 50-Day Moving Average Near High - 9/12/2018 |
View all notes |
Set NEW NOTE alert |
Company Profile |
SEC
News |
Chart |
Request a new note
C
A
S
I |
Symbol/Exchange
Company Name
Industry Group |
PRICE |
CHANGE
(%Change) |
Day High |
Volume
(% DAV)
(% 50 day avg vol) |
52 Wk Hi
% From Hi |
Featured
Date |
Price
Featured |
Pivot Featured |
|
Max Buy |
OLLI
-
NASDAQ
Ollie's Bargain Outlet
Retail-DiscountandVariety
|
$90.20
|
-0.65
-0.72% |
$91.10
|
426,976
69.20% of 50 DAV
50 DAV is 617,000
|
$94.70
-4.75%
|
7/12/2018
|
$74.43
|
PP = $77.60
|
|
MB = $81.48
|
Most Recent Note - 9/14/2018 3:42:06 PM
G - Perched at its all-time high, extended from any sound base. Prior highs in the $77 area define support along with its 50 DMA line ($77.57). Reported earnings +48% on +13% sales revenues for the Jul '18 quarter, continuing its strong earnings track record.
>>> FEATURED STOCK ARTICLE : Hitting New Highs With More Volume-Driven Gains - 8/22/2018 |
View all notes |
Set NEW NOTE alert |
Company Profile |
SEC
News |
Chart |
Request a new note
C
A
S
I |
NOVT
-
NASDAQ
Novanta Inc
Elec-Scientific/Msrng
|
$74.90
|
+0.75
1.01% |
$75.45
|
300,511
157.34% of 50 DAV
50 DAV is 191,000
|
$78.85
-5.01%
|
7/12/2018
|
$65.90
|
PP = $68.10
|
|
MB = $71.51
|
Most Recent Note - 9/17/2018 5:59:42 PM
G - Consolidating well above its 50 DMA line ($70.55) and prior highs in the $68-69 area defining important near-term support to watch.
>>> FEATURED STOCK ARTICLE : Electronic Systems Leader is Extended From Prior Base - 8/30/2018 |
View all notes |
Set NEW NOTE alert |
Company Profile |
SEC
News |
Chart |
Request a new note
C
A
S
I |
TEAM
-
NASDAQ
Atlassian Corp Plc Cl A
Comp Sftwr-Spec Enterprs
|
$91.11
|
-3.07
-3.26% |
$94.50
|
1,411,517
105.02% of 50 DAV
50 DAV is 1,344,000
|
$95.00
-4.09%
|
7/27/2018
|
$73.73
|
PP = $68.85
|
|
MB = $72.29
|
Most Recent Note - 9/17/2018 4:51:09 PM
G - Pulled back from its all-time high today with average volume. Extended from any sound base. The 50 DMA line ($77.95) defines near-term support to watch on pullbacks. Fundamentals through Jun '18 have been strong.
>>> FEATURED STOCK ARTICLE : Extended From Base and Hitting Another New High - 9/14/2018 |
View all notes |
Set NEW NOTE alert |
Company Profile |
SEC
News |
Chart |
Request a new note
C
A
S
I |
SEND
-
NYSE
Sendgrid Inc
INTERNET - Content
|
$35.49
|
-0.72
-1.99% |
$36.26
|
741,385
80.59% of 50 DAV
50 DAV is 920,000
|
$38.66
-8.20%
|
8/13/2018
|
$32.20
|
PP = $32.13
|
|
MB = $33.74
|
Most Recent Note - 9/17/2018 6:01:06 PM
G - Extended from the latest base and pulling back from its all-time high. Prior highs in the $32 area define initial support to watch above its 50 DMA line ($31.08).
>>> FEATURED STOCK ARTICLE : Strength Returned After Finding Support Near Prior Lows - 8/14/2018 |
View all notes |
Set NEW NOTE alert |
Company Profile |
SEC
News |
Chart |
Request a new note
C
A
S
I |