***Last / Change / Volume data in this table is the closing quote data***
Symbol/Exchange
Company Name
Industry Group |
PRICE |
CHANGE
(%Change) |
Day High |
Volume
(% DAV)
(% 50 day avg vol) |
52 Wk Hi
% From Hi |
Featured
Date |
Price
Featured |
Pivot Featured |
|
Max Buy |
OSBC
-
NASDAQ
Old Second Bancorp Inc
BANKING - Regional - Midwest Banks
|
$15.55
|
-0.10
-0.64% |
$15.60
|
76,057
80.06% of 50 DAV
50 DAV is 95,000
|
$16.30
-4.60%
|
5/21/2018
|
$15.50
|
PP = $15.10
|
|
MB = $15.86
|
 Most Recent Note - 8/23/2018 8:10:20 PM
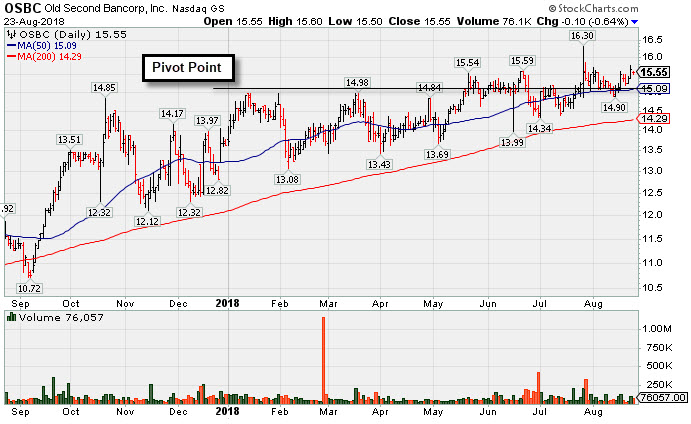
G - Consolidating above its 50 DMA line ($15.10) while the prior low ($14) and 200 DMA line define additional near-term support. Met stubborn resistance after hitting a new high on 7/26/18 with a big volume-driven gain. Its Relative Strength Rating has slumped to 78, below the 80+ minimum guideline for buy candidates. Fundamentals remain strong after it reported Jun '18 quarterly earnings +71% on +23% sales revenues. See the latest FSU analysis for more details and a new annotated graph.
>>> FEATURED STOCK ARTICLE : Bank Perched Less Than -5% Off Record High - 8/23/2018 |
View all notes |
Set NEW NOTE alert |
Company Profile |
SEC
News |
Chart |
Request a new note
C
A
S
I |
SIVB
-
NASDAQ
S V B Financial Group
BANKING - Regional - Pacific Banks
|
$325.75
|
-0.41
-0.13% |
$329.34
|
348,605
74.97% of 50 DAV
50 DAV is 465,000
|
$333.74
-2.39%
|
8/6/2018
|
$314.77
|
PP = $329.75
|
|
MB = $346.24
|
Most Recent Note - 8/20/2018 12:44:43 PM
Y - Met resistance in recent weeks near prior highs. Subsequent gains above the pivot point backed by at least +40% above average volume may trigger a convincing new technical buy signal. The 50 DMA line ($310) and recent low ($284.42 on 7/02/18) define near-term support to watch on pullbacks. Fundamentals remain strong.
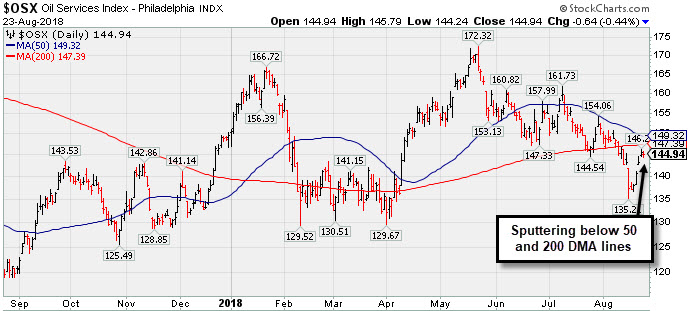
>>> FEATURED STOCK ARTICLE : Still Sputtering Below 50-Day Moving Average - 7/10/2018 |
View all notes |
Set NEW NOTE alert |
Company Profile |
SEC
News |
Chart |
Request a new note
C
A
S
I |
ZBRA
-
NASDAQ
Zebra Tech Corp Cl A
COMPUTER HARDWARE - Computer Peripherals
|
$169.01
|
-0.21
-0.12% |
$170.57
|
315,828
76.29% of 50 DAV
50 DAV is 414,000
|
$171.23
-1.30%
|
8/7/2018
|
$164.26
|
PP = $161.82
|
|
MB = $169.91
|
Most Recent Note - 8/20/2018 5:15:06 PM
Y - Posted a gain today with light volume for its 2nd best ever close. Stubbornly held its ground after the considerable volume-driven gain on 8/07/18 triggered a technical buy signal. Its 50 DMA line ($150) defines near-term support above the prior low ($136.16 on 7/31/18). Fundamentals remain strong.
>>> FEATURED STOCK ARTICLE : Big Gain for New High Backed by Heavy Volume - 8/7/2018 |
View all notes |
Set NEW NOTE alert |
Company Profile |
SEC
News |
Chart |
Request a new note
C
A
S
I |
EPAM
-
NYSE
Epam Systems Inc
COMPUTER SOFTWARE and SERVICES - Information Technology Service
|
$139.81
|
+0.56
0.40% |
$140.85
|
446,465
76.71% of 50 DAV
50 DAV is 582,000
|
$139.90
-0.06%
|
7/5/2018
|
$123.70
|
PP = $131.85
|
|
MB = $138.44
|
Most Recent Note - 8/20/2018 5:05:12 PM
Y - Posted a 5th consecutive gain today for its 2nd best close ever. Recently found support above its 50 DMA line ($128.68). Fundamentals remain strong. Recent low ($115) and 200 DMA line define important near term support. See the latest FSU analysis for more details and a new annotated graph.
>>> FEATURED STOCK ARTICLE : Tech Services Firm Remains Fundamentally and Technically Strong - 8/20/2018 |
View all notes |
Set NEW NOTE alert |
Company Profile |
SEC
News |
Chart |
Request a new note
C
A
S
I |
FLT
-
NYSE
Fleetcor Technologies
DIVERSIFIED SERVICES - Business/Management Services
|
$216.11
|
-1.46
-0.67% |
$219.06
|
405,650
33.36% of 50 DAV
50 DAV is 1,216,000
|
$225.92
-4.34%
|
6/18/2018
|
$219.31
|
PP = $213.84
|
|
MB = $224.53
|
Most Recent Note - 8/20/2018 12:31:42 PM
Y - Consolidating near its 50 DMA line ($215.84) with volume totals cooling in recent weeks. The prior low ($210.64 on 8/03/18) defines important near-term support above its 200 DMA line($202). Reported earnings +29% on +8% sales revenues for the Jun '18 quarter, its 3rd consecutive quarterly comparison above the +25% minimum guideline (C criteria).
>>> FEATURED STOCK ARTICLE : Testing 50-Day Average With Loss on Higher Volume - 8/3/2018 |
View all notes |
Set NEW NOTE alert |
Company Profile |
SEC
News |
Chart |
Request a new note
C
A
S
I |
Symbol/Exchange
Company Name
Industry Group |
PRICE |
CHANGE
(%Change) |
Day High |
Volume
(% DAV)
(% 50 day avg vol) |
52 Wk Hi
% From Hi |
Featured
Date |
Price
Featured |
Pivot Featured |
|
Max Buy |
MA
-
NYSE
Mastercard Inc Cl A
Finance-CrdtCard/PmtPr
|
$205.22
|
+0.91
0.45% |
$205.96
|
2,247,544
71.69% of 50 DAV
50 DAV is 3,135,000
|
$214.28
-4.23%
|
7/11/2018
|
$203.84
|
PP = $204.10
|
|
MB = $214.31
|
Most Recent Note - 8/20/2018 5:18:05 PM
Y - Consolidating above its 50 DMA line ($202) with volume totals cooling in recent weeks. Prior lows in the $193-196 area help define important near-term support to watch. Reported earnings +51% on +20% sales revenues for the Jun '18 quarter.
>>> FEATURED STOCK ARTICLE : Found Support Near 50-Day Moving Average Line - 8/10/2018 |
View all notes |
Set NEW NOTE alert |
Company Profile |
SEC
News |
Chart |
Request a new note
C
A
S
I |
V
-
NYSE
Visa Inc Cl A
Finance-CrdtCard/PmtPr
|
$142.10
|
+0.96
0.68% |
$142.45
|
4,427,093
61.28% of 50 DAV
50 DAV is 7,224,000
|
$143.14
-0.73%
|
4/26/2018
|
$126.68
|
PP = $126.98
|
|
MB = $133.33
|
Most Recent Note - 8/17/2018 6:13:00 PM
G - Remains perched near its all-time high, extended from any sound base. Its 50 DMA line ($137.30) and recent low ($135.31 on 7/30/18) define important near-term support to watch on pullbacks. Fundamentals remain strong.
>>> FEATURED STOCK ARTICLE : Perched Near All-Time High After Rally From 50-Day Average - 7/27/2018 |
View all notes |
Set NEW NOTE alert |
Company Profile |
SEC
News |
Chart |
Request a new note
C
A
S
I |
NANO
-
NASDAQ
Nanometrics Inc
ELECTRONICS - Scientific and Technical Instrum
|
$42.87
|
+0.43
1.01% |
$43.28
|
233,392
60.94% of 50 DAV
50 DAV is 383,000
|
$48.26
-11.17%
|
8/13/2018
|
$44.17
|
PP = $44.27
|
|
MB = $46.48
|
Most Recent Note - 8/21/2018 5:06:15 PM
Y - Rebounding after negating the recent breakout and slumping back into the prior base raising concerns. The 50 DMA line ($38.88) defines important near-term support. Recent quarters through Jun '18 showed much better sales and earnings increases versus the year earlier. Annual earnings (A criteria) have improved greatly since a downturn and losses FY '13 and '14.
>>> FEATURED STOCK ARTICLE : Five Times Average Volume Behind Breakout Gain - 8/13/2018 |
View all notes |
Set NEW NOTE alert |
Company Profile |
SEC
News |
Chart |
Request a new note
C
A
S
I |
ENV
-
NYSE
Envestnet Inc
FINANCIAL SERVICES - Diversified Investments
|
$60.55
|
+0.45
0.75% |
$60.90
|
283,381
88.28% of 50 DAV
50 DAV is 321,000
|
$62.95
-3.81%
|
6/15/2018
|
$57.85
|
PP = $60.37
|
|
MB = $63.39
|
Most Recent Note - 8/20/2018 5:11:12 PM
Y - Found prompt support near its 50 DMA line ($58.62) in recent weeks but its Relative Strength Rating has slumped to 79, below the 80+ minimum guideline for buy candidates. Endured distributional pressure after a volume-driven gain for a new high on 7/23/18 triggered a technical buy signal. The recent low ($53.75 on 6/28/18) and 200 DMA line define important near-term support. Fundamentals remain strong.
>>> FEATURED STOCK ARTICLE : Earnings News Due for Financial Firm Perched Near High - 8/6/2018 |
View all notes |
Set NEW NOTE alert |
Company Profile |
SEC
News |
Chart |
Request a new note
C
A
S
I |
TPL
-
NYSE
Texas Pacific Land Trust
Real Estate Dvlpmt/Ops
|
$815.36
|
+14.36
1.79% |
$819.00
|
15,870
122.08% of 50 DAV
50 DAV is 13,000
|
$825.90
-1.28%
|
7/5/2018
|
$714.90
|
PP = $739.99
|
|
MB = $776.99
|
Most Recent Note - 8/17/2018 6:12:27 PM
G - Perched near its all-time high with volume totals cooling while stubbornly holding its ground. The 50 DMA line ($748) and recent low ($720 on 7/30/18) define important near-term support.
>>> FEATURED STOCK ARTICLE : Volume Totals Cooling While Consolidating Above Prior High - 7/20/2018 |
View all notes |
Set NEW NOTE alert |
Company Profile |
SEC
News |
Chart |
Request a new note
C
A
S
I |
Symbol/Exchange
Company Name
Industry Group |
PRICE |
CHANGE
(%Change) |
Day High |
Volume
(% DAV)
(% 50 day avg vol) |
52 Wk Hi
% From Hi |
Featured
Date |
Price
Featured |
Pivot Featured |
|
Max Buy |
DPZ
-
NYSE
Dominos Pizza Inc
Retail-Restaurants
|
$289.40
|
-2.14
-0.73% |
$294.51
|
290,435
46.40% of 50 DAV
50 DAV is 626,000
|
$295.24
-1.98%
|
8/13/2018
|
$288.60
|
PP = $293.91
|
|
MB = $308.61
|
Most Recent Note - 8/20/2018 12:29:11 PM
Y - New pivot point was cited based on its 6/22/18 high plus 10 cents. Wedged up to a new 52-week high and has been stubbornly holding its ground. Subsequent gains above the pivot point backed by at least +40% above average volume may trigger a new (or add-on) technical buy signal.
>>> FEATURED STOCK ARTICLE : Consolidating Near 50-Day Moving Average Line - 7/23/2018 |
View all notes |
Set NEW NOTE alert |
Company Profile |
SEC
News |
Chart |
Request a new note
C
A
S
I |
FIVE
-
NASDAQ
Five Below Inc
Retail-DiscountandVariety
|
$114.74
|
+1.47
1.30% |
$114.95
|
747,223
86.09% of 50 DAV
50 DAV is 868,000
|
$114.71
0.03%
|
7/6/2018
|
$98.90
|
PP = $104.09
|
|
MB = $109.29
|
Most Recent Note - 8/21/2018 5:09:13 PM
G - Color code is changed to green after rising above its "max buy" level with average volume behind today's 4th consecutive gain. Its 50 DMA line ($101.41) defines near-term support above prior lows in the $95-96 area. Recent gains above the pivot point lacked the minimum of +40% above average volume needed to trigger a proper technical buy signal.
>>> FEATURED STOCK ARTICLE : Volume Totals Cooling While Perched Near Record High - 8/16/2018 |
View all notes |
Set NEW NOTE alert |
Company Profile |
SEC
News |
Chart |
Request a new note
C
A
S
I |
NOW
-
NYSE
Servicenow Inc
Computer Sftwr-Enterprse
|
$184.85
|
+2.44
1.34% |
$186.23
|
1,521,247
91.53% of 50 DAV
50 DAV is 1,662,000
|
$194.81
-5.11%
|
5/8/2018
|
$174.63
|
PP = $176.66
|
|
MB = $185.49
|
Most Recent Note - 8/17/2018 6:09:10 PM
G - Slumped to a close below its 50 DMA line ($183) raising some concerns and the color code is changed to green. The recent low ($174) defines the next important near-term support. Fundamentals remain strong. See the latest FSU analysis for more details and a new annotated graph.
>>> FEATURED STOCK ARTICLE : Slump Below 50-Day Average Line Raises Concerns - 8/17/2018 |
View all notes |
Set NEW NOTE alert |
Company Profile |
SEC
News |
Chart |
Request a new note
C
A
S
I |
NVEE
-
NASDAQ
N V 5 Global Inc
Comml Svcs-Consulting
|
$87.90
|
+1.35
1.56% |
$88.38
|
92,072
122.76% of 50 DAV
50 DAV is 75,000
|
$91.55
-3.99%
|
6/15/2018
|
$7,070.00
|
PP = $72.00
|
|
MB = $75.60
|
Most Recent Note - 8/21/2018 5:04:20 PM
G - Posted a gain today with above average volume. Priced a new Public Offering and gapped down on 8/09/18. Remains perched near its all-time high. Its 50 DMA line ($75.10) and prior highs in the $71 area define near-term support to watch. See the latest FSU analysis for more details and a new annotated graph.
>>> FEATURED STOCK ARTICLE : Remains Perched Near All-Time High Following Offering - 8/21/2018 |
View all notes |
Set NEW NOTE alert |
Company Profile |
SEC
News |
Chart |
Request a new note
C
A
S
I |
PANW
-
NYSE
Palo Alto Networks
Computer Sftwr-Security
|
$216.71
|
+1.12
0.52% |
$219.91
|
1,276,577
105.76% of 50 DAV
50 DAV is 1,207,000
|
$219.38
-1.22%
|
6/12/2018
|
$206.55
|
PP = $214.69
|
|
MB = $225.42
|
Most Recent Note - 8/20/2018 12:41:06 PM
Y - Very little resistance remains up to the $219 level. Consolidating near its 50 DMA line ($210). The prior low ($193 on 7/30/18) defines an important near-term support level.
>>> FEATURED STOCK ARTICLE : Violated 50-day Average With Volume-driven Loss - 7/31/2018 |
View all notes |
Set NEW NOTE alert |
Company Profile |
SEC
News |
Chart |
Request a new note
C
A
S
I |
Symbol/Exchange
Company Name
Industry Group |
PRICE |
CHANGE
(%Change) |
Day High |
Volume
(% DAV)
(% 50 day avg vol) |
52 Wk Hi
% From Hi |
Featured
Date |
Price
Featured |
Pivot Featured |
|
Max Buy |
QLYS
-
NASDAQ
Qualys Inc
Computer Sftwr-Security
|
$87.40
|
+0.10
0.11% |
$89.85
|
378,340
98.78% of 50 DAV
50 DAV is 383,000
|
$98.30
-11.09%
|
7/23/2018
|
$97.05
|
PP = $97.85
|
|
MB = $102.74
|
Most Recent Note - 8/20/2018 12:42:40 PM
G - Failing to rebound after damaging volume-driven losses. A rebound above the 50 DMA line ($89.92) still is needed for its outlook to improve.
>>> FEATURED STOCK ARTICLE : Computer Software-Security Firm Hovering Near All-Time High - 7/16/2018 |
View all notes |
Set NEW NOTE alert |
Company Profile |
SEC
News |
Chart |
Request a new note
C
A
S
I |
PAYC
-
NYSE
Paycom Software Inc
COMPUTER SOFTWARE and SERVICES - Application Software
|
$146.25
|
+0.90
0.62% |
$148.32
|
504,772
55.84% of 50 DAV
50 DAV is 904,000
|
$145.74
0.35%
|
8/1/2018
|
$122.87
|
PP = $118.55
|
|
MB = $124.48
|
Most Recent Note - 8/20/2018 5:20:07 PM
G - Hit another new all-time high with today's 3rd consecutive gain marked by below average volume, getting very extended from prior highs in the $118 area. Fundamentals remain strong.
>>> FEATURED STOCK ARTICLE : Bullish Action Followed Strong Earnings News - 8/1/2018 |
View all notes |
Set NEW NOTE alert |
Company Profile |
SEC
News |
Chart |
Request a new note
C
A
S
I |
GRUB
-
NYSE
Grubhub Inc
INTERNET - Content
|
$137.93
|
+2.59
1.91% |
$139.84
|
1,536,657
80.16% of 50 DAV
50 DAV is 1,917,000
|
$141.06
-2.22%
|
5/30/2018
|
$107.56
|
PP = $105.68
|
|
MB = $110.96
|
Most Recent Note - 8/17/2018 6:07:33 PM
G - Found support above the prior high ($120) and volume totals have been cooling. It has not formed a sound new base. Fundamentals remain strong. Patient investors may watch for a new base or secondary buy point to possibly develop and be noted in the weeks ahead.
>>> FEATURED STOCK ARTICLE : Hovering Near Record High Following Considerable Rally - 8/2/2018 |
View all notes |
Set NEW NOTE alert |
Company Profile |
SEC
News |
Chart |
Request a new note
C
A
S
I |
HQY
-
NASDAQ
Healthequity Inc
COMPUTER SOFTWARE and SERVICES - Healthcare Information Service
|
$87.37
|
+0.18
0.21% |
$87.59
|
363,911
91.90% of 50 DAV
50 DAV is 396,000
|
$88.30
-1.05%
|
8/13/2018
|
$82.39
|
PP = $83.44
|
|
MB = $87.61
|
Most Recent Note - 8/20/2018 12:34:00 PM
Y - Perched at its all-time high after wedging higher with gains lacking great volume. It rose from an advanced ascending base with new pivot point cited based on its 7/23/18 high plus 10 cents. Prior low ($72.63 on 7/31/18) defines important near-term support to watch.
>>> FEATURED STOCK ARTICLE : Perched Near All-Time High After Testing Support at 50-Day Average - 7/25/2018 |
View all notes |
Set NEW NOTE alert |
Company Profile |
SEC
News |
Chart |
Request a new note
C
A
S
I |
LOB
-
NASDAQ
Live Oak Bancshares Inc
Banks-Southeast
|
$29.85
|
-0.40
-1.32% |
$30.30
|
58,187
35.26% of 50 DAV
50 DAV is 165,000
|
$32.95
-9.41%
|
5/21/2018
|
$29.35
|
PP = $30.15
|
|
MB = $31.66
|
Most Recent Note - 8/20/2018 12:35:10 PM
G - Its Relative Strength Rating has slumped to 79, below the 80+ minimum guideline. A rebound above the 50 DMA line ($30.52) still is needed for its outlook to improve. The recent low and 200 DMA line ($27.51) define important near-term chart support.
>>> FEATURED STOCK ARTICLE : Bank Making Gradual Progress After Support Found at 50-Day Average - 7/11/2018 |
View all notes |
Set NEW NOTE alert |
Company Profile |
SEC
News |
Chart |
Request a new note
C
A
S
I |
Symbol/Exchange
Company Name
Industry Group |
PRICE |
CHANGE
(%Change) |
Day High |
Volume
(% DAV)
(% 50 day avg vol) |
52 Wk Hi
% From Hi |
Featured
Date |
Price
Featured |
Pivot Featured |
|
Max Buy |
PYPL
-
NASDAQ
Paypal Holdings Inc
Finance-CrdtCard/PmtPr
|
$87.38
|
+0.43
0.49% |
$88.18
|
4,310,006
59.08% of 50 DAV
50 DAV is 7,295,000
|
$92.35
-5.38%
|
7/23/2018
|
$89.24
|
PP = $87.55
|
|
MB = $91.93
|
Most Recent Note - 8/20/2018 5:23:17 PM
Y - Consolidating near its 50 DMA line ($85.82) with volume totals cooling in recent weeks. Prior low in the $81 area defines important near-term support above its 200 DMA line ($79.75).
>>> FEATURED STOCK ARTICLE : Paypal Pulling Back From Record High - 7/26/2018 |
View all notes |
Set NEW NOTE alert |
Company Profile |
SEC
News |
Chart |
Request a new note
C
A
S
I |
OLLI
-
NASDAQ
Ollie's Bargain Outlet
Retail-DiscountandVariety
|
$79.70
|
+1.10
1.40% |
$80.10
|
395,814
63.53% of 50 DAV
50 DAV is 623,000
|
$80.95
-1.54%
|
7/12/2018
|
$74.43
|
PP = $77.60
|
|
MB = $81.48
|
Most Recent Note - 8/22/2018 5:27:21 PM
Y - Recent volume-driven gains above the pivot point triggered a new (or add-on) technical buy signal. Fundamentals remain strong, yet earnings news is due on 8/29/18. Prior highs in the $77 area define initial support to watch above its 50 DMA line ($73.32). See the latest FSU analysis for more details and a new annotated graph.
>>> FEATURED STOCK ARTICLE : Hitting New Highs With More Volume-Driven Gains - 8/22/2018 |
View all notes |
Set NEW NOTE alert |
Company Profile |
SEC
News |
Chart |
Request a new note
C
A
S
I |
NOVT
-
NASDAQ
Novanta Inc
Elec-Scientific/Msrng
|
$76.15
|
-0.85
-1.10% |
$77.40
|
566,196
309.40% of 50 DAV
50 DAV is 183,000
|
$77.53
-1.77%
|
7/12/2018
|
$65.90
|
PP = $68.10
|
|
MB = $71.51
|
Most Recent Note - 8/23/2018 1:06:57 PM
G - Hit another new 52-week high with a big volume-driven gain on the prior session, getting very extended from prior highs. The 50 DMA line ($66.44) and prior low ($61.15 on 7/31/18) define important near-term support to watch on pullbacks.
>>> FEATURED STOCK ARTICLE : Gain Challenged 52-Week High and New Pivot Point - 7/12/2018 |
View all notes |
Set NEW NOTE alert |
Company Profile |
SEC
News |
Chart |
Request a new note
C
A
S
I |
TEAM
-
NASDAQ
Atlassian Corp Plc Cl A
Comp Sftwr-Spec Enterprs
|
$82.63
|
+2.57
3.21% |
$82.98
|
1,925,568
171.62% of 50 DAV
50 DAV is 1,122,000
|
$80.68
2.42%
|
7/27/2018
|
$73.73
|
PP = $68.85
|
|
MB = $72.29
|
Most Recent Note - 8/20/2018 12:45:42 PM
G - Stubbornly holding its ground after recently wedging to new highs with gains lacking great volume conviction, and it is extended from any sound base. Fundamentals through Jun '18 have been strong.
>>> FEATURED STOCK ARTICLE : Pullback Following Recent technical Breakout - 7/30/2018 |
View all notes |
Set NEW NOTE alert |
Company Profile |
SEC
News |
Chart |
Request a new note
C
A
S
I |
SEND
-
NYSE
Sendgrid Inc
INTERNET - Content
|
$33.69
|
+0.61
1.84% |
$34.25
|
927,702
101.95% of 50 DAV
50 DAV is 910,000
|
$33.85
-0.47%
|
8/13/2018
|
$32.20
|
PP = $32.13
|
|
MB = $33.74
|
Most Recent Note - 8/20/2018 5:13:38 PM
Y - Slumped back in the prior base raising concerns soon after its 8/13/18 gain triggered a new technical buy signal. Prior lows in the $24 area define important support. Completed a new Public Offering and Secondary Offering on 4/05/18.
>>> FEATURED STOCK ARTICLE : Strength Returned After Finding Support Near Prior Lows - 8/14/2018 |
View all notes |
Set NEW NOTE alert |
Company Profile |
SEC
News |
Chart |
Request a new note
C
A
S
I |
Symbol/Exchange
Company Name
Industry Group |
PRICE |
CHANGE
(%Change) |
Day High |
Volume
(% DAV)
(% 50 day avg vol) |
52 Wk Hi
% From Hi |
Featured
Date |
Price
Featured |
Pivot Featured |
|
Max Buy |