***Last / Change / Volume data in this table is the closing quote data***
Symbol/Exchange
Company Name
Industry Group |
PRICE |
CHANGE
(%Change) |
Day High |
Volume
(% DAV)
(% 50 day avg vol) |
52 Wk Hi
% From Hi |
Featured
Date |
Price
Featured |
Pivot Featured |
|
Max Buy |
OSBC
-
NASDAQ
Old Second Bancorp Inc
BANKING - Regional - Midwest Banks
|
$15.10
|
+0.15
1.00% |
$15.20
|
41,581
42.34% of 50 DAV
50 DAV is 98,200
|
$16.30
-7.36%
|
5/21/2018
|
$15.50
|
PP = $15.10
|
|
MB = $15.86
|
Most Recent Note - 8/13/2018 7:04:11 PM
G - Color code is changed to green while still sputtering near its 50 DMA line ($15.06) while the prior low ($14) and 200 DMA line define additional near-term support. Met stubborn resistance after hitting a new high on 7/26/18 with a big volume-driven gain. Its Relative Strength Rating has slumped to 78, below the 80+ minimum guideline for buy candidates. Fundamentals remain strong after it reported Jun '18 quarterly earnings +71% on +23% sales revenues.
>>> FEATURED STOCK ARTICLE : Consolidating Above 50-Day Moving Average - 7/9/2018 |
View all notes |
Set NEW NOTE alert |
Company Profile |
SEC
News |
Chart |
Request a new note
C
A
S
I |
SIVB
-
NASDAQ
S V B Financial Group
BANKING - Regional - Pacific Banks
|
$320.23
|
+4.94
1.57% |
$320.68
|
244,385
52.00% of 50 DAV
50 DAV is 470,000
|
$333.74
-4.05%
|
8/6/2018
|
$314.77
|
PP = $329.75
|
|
MB = $346.24
|
Most Recent Note - 8/13/2018 7:06:13 PM
Y - Still quietly perched near its all-time high. Subsequent gains above the pivot point backed by at least +40% above average volume may trigger a new technical buy signal. The 50 DMA line ($310) and recent low ($284.42 on 7/02/18) define near-term support to watch on pullbacks. Fundamentals remain strong.
>>> FEATURED STOCK ARTICLE : Still Sputtering Below 50-Day Moving Average - 7/10/2018 |
View all notes |
Set NEW NOTE alert |
Company Profile |
SEC
News |
Chart |
Request a new note
C
A
S
I |
ZBRA
-
NASDAQ
Zebra Tech Corp Cl A
COMPUTER HARDWARE - Computer Peripherals
|
$164.00
|
+2.06
1.27% |
$166.86
|
524,477
123.99% of 50 DAV
50 DAV is 423,000
|
$167.61
-2.15%
|
8/7/2018
|
$164.26
|
PP = $161.82
|
|
MB = $169.91
|
 Most Recent Note - 8/14/2018 2:41:36 PM
Y - Holding its ground after the considerable volume-driven gain on 8/07/18 triggered a technical buy signal. Its 50 DMA line ($150) defines near-term support above the prior low ($136.16 on 7/31/18). Fundamentals remain strong.
>>> FEATURED STOCK ARTICLE : Big Gain for New High Backed by Heavy Volume - 8/7/2018 |
View all notes |
Set NEW NOTE alert |
Company Profile |
SEC
News |
Chart |
Request a new note
C
A
S
I |
EPAM
-
NYSE
Epam Systems Inc
COMPUTER SOFTWARE and SERVICES - Information Technology Service
|
$131.91
|
+3.61
2.81% |
$132.03
|
399,710
70.75% of 50 DAV
50 DAV is 565,000
|
$137.73
-4.23%
|
7/5/2018
|
$123.70
|
PP = $131.85
|
|
MB = $138.44
|
Most Recent Note - 8/10/2018 7:44:22 PM
Y - Finding support above its 50 DMA line ($127.81). Fundamentals remain strong. The recent low ($115) and 200 DMA line define important near term support to watch on pullbacks,
>>> FEATURED STOCK ARTICLE : Sputtering Below 50-Day Average After Negating Prior Breakout - 6/27/2018 |
View all notes |
Set NEW NOTE alert |
Company Profile |
SEC
News |
Chart |
Request a new note
C
A
S
I |
FLT
-
NYSE
Fleetcor Technologies
DIVERSIFIED SERVICES - Business/Management Services
|
$215.20
|
+0.38
0.18% |
$216.44
|
348,487
27.70% of 50 DAV
50 DAV is 1,258,000
|
$225.92
-4.75%
|
6/18/2018
|
$219.31
|
PP = $213.84
|
|
MB = $224.53
|
Most Recent Note - 8/13/2018 7:02:05 PM
Y - Consolidating near its 50 DMA line ($214.75) which has been acting as support.. The prior low ($210.64 on 8/03/18) also defines important near-term support. Reported earnings +29% on +8% sales revenues for the Jun '18 quarter, its 3rd consecutive quarterly comparison above the +25% minimum guideline (C criteria).
>>> FEATURED STOCK ARTICLE : Testing 50-Day Average With Loss on Higher Volume - 8/3/2018 |
View all notes |
Set NEW NOTE alert |
Company Profile |
SEC
News |
Chart |
Request a new note
C
A
S
I |
Symbol/Exchange
Company Name
Industry Group |
PRICE |
CHANGE
(%Change) |
Day High |
Volume
(% DAV)
(% 50 day avg vol) |
52 Wk Hi
% From Hi |
Featured
Date |
Price
Featured |
Pivot Featured |
|
Max Buy |
MA
-
NYSE
Mastercard Inc Cl A
Finance-CrdtCard/PmtPr
|
$203.88
|
+1.57
0.78% |
$204.05
|
1,974,069
61.06% of 50 DAV
50 DAV is 3,233,000
|
$214.28
-4.85%
|
7/11/2018
|
$203.84
|
PP = $204.10
|
|
MB = $214.31
|
Most Recent Note - 8/10/2018 7:41:57 PM
Y - Found prompt support near its 50 DMA line ($201) following another strong earnings report. Recent lows in the $193-196 area define important near-term support to watch. See the latest FSU analysis for more details and a new annotated graph.
>>> FEATURED STOCK ARTICLE : Found Support Near 50-Day Moving Average Line - 8/10/2018 |
View all notes |
Set NEW NOTE alert |
Company Profile |
SEC
News |
Chart |
Request a new note
C
A
S
I |
V
-
NYSE
Visa Inc Cl A
Finance-CrdtCard/PmtPr
|
$140.76
|
+0.55
0.39% |
$140.99
|
5,884,863
79.64% of 50 DAV
50 DAV is 7,389,000
|
$143.14
-1.66%
|
4/26/2018
|
$126.68
|
PP = $126.98
|
|
MB = $133.33
|
Most Recent Note - 8/13/2018 7:13:27 PM
G - Remains perched near its all-time high, extended frm any sound base. Its 50 DMA line ($136.78) and recent low ($135.31 on 7/30/18) define important near-term support to watch on pullbacks. Fundamentals remain strong.
>>> FEATURED STOCK ARTICLE : Perched Near All-Time High After Rally From 50-Day Average - 7/27/2018 |
View all notes |
Set NEW NOTE alert |
Company Profile |
SEC
News |
Chart |
Request a new note
C
A
S
I |
NANO
-
NASDAQ
Nanometrics Inc
ELECTRONICS - Scientific and Technical Instrum
|
$46.22
|
+1.05
2.32% |
$48.26
|
1,199,537
353.85% of 50 DAV
50 DAV is 339,000
|
$45.34
1.94%
|
8/13/2018
|
$44.17
|
PP = $44.27
|
|
MB = $46.48
|
Most Recent Note - 8/14/2018 2:14:26 PM
Y - Reversed from early highs today above its "max buy" level. Finished strong on the prior session with a gain for a new 52-week high backed by 5 times average volume. It was highlighted in yellow with pivot point cited based on its 6/06/18 high plus 10 cents in the earlier mid-day report. It rallied from a cup shaped base, and it faces no resistance due to overhead supply. Recent quarters through Jun '18 showed much better sales and earnings increases versus the year earlier. Annual earnings (A criteria) have improved greatly since a downturn and losses FY '13 and '14. See the latest FSU analysis for more details and an annotated graph.
>>> FEATURED STOCK ARTICLE : Five Times Average Volume Behind Breakout Gain - 8/13/2018 |
View all notes |
Set NEW NOTE alert |
Company Profile |
SEC
News |
Chart |
Request a new note
C
A
S
I |
ENV
-
NYSE
Envestnet Inc
FINANCIAL SERVICES - Diversified Investments
|
$60.55
|
+1.30
2.19% |
$60.75
|
331,345
101.95% of 50 DAV
50 DAV is 325,000
|
$62.95
-3.81%
|
6/15/2018
|
$57.85
|
PP = $60.37
|
|
MB = $63.39
|
Most Recent Note - 8/14/2018 2:43:41 PM
Y - Found prompt support near its 50 DMA line ($58.32) in recent weeks. Encountered distributional pressure after a volume-driven gain for a new high on 7/23/18 triggered a technical buy signal. The recent low ($53.75 on 6/28/18) and 200 DMA line define important near-term support. Fundamentals remain strong.
>>> FEATURED STOCK ARTICLE : Earnings News Due for Financial Firm Perched Near High - 8/6/2018 |
View all notes |
Set NEW NOTE alert |
Company Profile |
SEC
News |
Chart |
Request a new note
C
A
S
I |
TPL
-
NYSE
Texas Pacific Land Trust
Real Estate Dvlpmt/Ops
|
$780.30
|
-18.90
-2.37% |
$799.00
|
13,144
87.63% of 50 DAV
50 DAV is 15,000
|
$825.90
-5.52%
|
7/5/2018
|
$714.90
|
PP = $739.99
|
|
MB = $776.99
|
Most Recent Note - 8/10/2018 7:56:39 PM
G - Hovering near its all-time high, stubbornly holding its ground. The 50 DMA line ($739) and recent low ($720 on 7/30/18) define important near-term support.
>>> FEATURED STOCK ARTICLE : Volume Totals Cooling While Consolidating Above Prior High - 7/20/2018 |
View all notes |
Set NEW NOTE alert |
Company Profile |
SEC
News |
Chart |
Request a new note
C
A
S
I |
Symbol/Exchange
Company Name
Industry Group |
PRICE |
CHANGE
(%Change) |
Day High |
Volume
(% DAV)
(% 50 day avg vol) |
52 Wk Hi
% From Hi |
Featured
Date |
Price
Featured |
Pivot Featured |
|
Max Buy |
STMP
-
NASDAQ
Stamps.com Inc
Retail-Internet
|
$236.95
|
-0.65
-0.27% |
$242.90
|
695,542
232.62% of 50 DAV
50 DAV is 299,000
|
$285.75
-17.08%
|
8/2/2018
|
$280.60
|
PP = $285.85
|
|
MB = $300.14
|
Most Recent Note - 8/13/2018 7:08:12 PM
G - Suffered another big loss today. Weakness last week was noted as it triggered a technical sell signal and nearly tested its 200 DMA line ($217) before rebounding. Recently met resistance near the prior high. A rebound above the 50 DMA line ($265) still is needed for its outlook to improve. Reported Jun '18 quarterly earnings +32% on +20% sales revenues, continuing its strong earnings history.
>>> FEATURED STOCK ARTICLE : Big Loss on Heavy Volume Tests 50-Day Moving Average - 6/21/2018 |
View all notes |
Set NEW NOTE alert |
Company Profile |
SEC
News |
Chart |
Request a new note
C
A
S
I |
CHDN
-
NASDAQ
Churchill Downs Inc
LEISURE - Gaming Activities
|
$281.55
|
-4.85
-1.69% |
$287.00
|
54,557
89.44% of 50 DAV
50 DAV is 61,000
|
$314.60
-10.51%
|
6/20/2018
|
$285.80
|
PP = $314.70
|
|
MB = $330.44
|
Most Recent Note - 8/13/2018 6:48:17 PM
G - Posted a solid gain today with higher volume. A rebound above its downward sloping 50 DMA line ($295.54) still is needed for its outlook to improve. Fundamentals remain strong.
>>> FEATURED STOCK ARTICLE : Consolidating Near 50-Day Moving Average - 6/29/2018 |
View all notes |
Set NEW NOTE alert |
Company Profile |
SEC
News |
Chart |
Request a new note
C
A
S
I |
DPZ
-
NYSE
Dominos Pizza Inc
Retail-Restaurants
|
$287.51
|
-1.09
-0.38% |
$290.31
|
962,312
148.50% of 50 DAV
50 DAV is 648,000
|
$295.24
-2.62%
|
8/13/2018
|
$288.60
|
PP = $293.91
|
|
MB = $308.61
|
Most Recent Note - 8/13/2018 6:59:50 PM
Y - New pivot point is cited based on its 6/22/18 high plus 10 cents. Wedged up to a new 52-week high last week and it is holding its ground with volume totals cooling. Subsequent gains above the pivot point backed by at least +40% above average volume may trigger a new (or add-on) technical buy signal.
>>> FEATURED STOCK ARTICLE : Consolidating Near 50-Day Moving Average Line - 7/23/2018 |
View all notes |
Set NEW NOTE alert |
Company Profile |
SEC
News |
Chart |
Request a new note
C
A
S
I |
FIVE
-
NASDAQ
Five Below Inc
Retail-DiscountandVariety
|
$105.94
|
+1.46
1.40% |
$106.13
|
553,715
42.63% of 50 DAV
50 DAV is 1,299,000
|
$109.09
-2.89%
|
7/6/2018
|
$98.90
|
PP = $104.09
|
|
MB = $109.29
|
Most Recent Note - 8/13/2018 7:20:11 PM
Y - Quietly perched within close striking distance of its prior high. Its 50 DMA line ($99.21) defines near-term support above prior lows in the $95-96 area. Subsequent gains above the pivot point must have a minimum of +40% above average volume to trigger a proper technical buy signal.
>>> FEATURED STOCK ARTICLE : Hovering Near Record High After Big Gap Up and Volume-Driven Gain - 6/25/2018 |
View all notes |
Set NEW NOTE alert |
Company Profile |
SEC
News |
Chart |
Request a new note
C
A
S
I |
NOW
-
NYSE
Servicenow Inc
Computer Sftwr-Enterprse
|
$184.49
|
-0.53
-0.29% |
$186.87
|
1,285,336
75.74% of 50 DAV
50 DAV is 1,697,000
|
$194.81
-5.30%
|
5/8/2018
|
$174.63
|
PP = $176.66
|
|
MB = $185.49
|
Most Recent Note - 8/10/2018 7:53:16 PM
Y - Volume totals have been cooling while consolidating above its 50 DMA line ($183). The recent low ($174) defines the next important near-term support. Fundamentals remain strong.
>>> FEATURED STOCK ARTICLE : Recent Slump Below 50-Day Average Hurt Outlook - 6/26/2018 |
View all notes |
Set NEW NOTE alert |
Company Profile |
SEC
News |
Chart |
Request a new note
C
A
S
I |
Symbol/Exchange
Company Name
Industry Group |
PRICE |
CHANGE
(%Change) |
Day High |
Volume
(% DAV)
(% 50 day avg vol) |
52 Wk Hi
% From Hi |
Featured
Date |
Price
Featured |
Pivot Featured |
|
Max Buy |
NVEE
-
NASDAQ
N V 5 Global Inc
Comml Svcs-Consulting
|
$85.20
|
+2.40
2.90% |
$85.90
|
55,040
75.40% of 50 DAV
50 DAV is 73,000
|
$91.55
-6.94%
|
6/15/2018
|
$7,070.00
|
PP = $72.00
|
|
MB = $75.60
|
Most Recent Note - 8/10/2018 1:09:17 PM
G - Gapped down on the prior session after pricing a new Public Offering while perched at its all-time high. Its 50 DMA line and prior highs in the $71 area define near-term support to watch on pullbacks.
>>> FEATURED STOCK ARTICLE : Holding its Ground in Tight Range Near All-Time High - 6/28/2018 |
View all notes |
Set NEW NOTE alert |
Company Profile |
SEC
News |
Chart |
Request a new note
C
A
S
I |
PANW
-
NYSE
Palo Alto Networks
Computer Sftwr-Security
|
$210.80
|
+0.25
0.12% |
$211.21
|
1,485,564
107.88% of 50 DAV
50 DAV is 1,377,000
|
$219.38
-3.91%
|
6/12/2018
|
$206.55
|
PP = $214.69
|
|
MB = $225.42
|
Most Recent Note - 8/13/2018 7:22:45 PM
Y - Still consolidating just above its 50 DMA line ($209), and very little resistance remains up to the $219 level. Prior low ($193 on 7/30/18) defines an important near-term support level.
>>> FEATURED STOCK ARTICLE : Violated 50-day Average With Volume-driven Loss - 7/31/2018 |
View all notes |
Set NEW NOTE alert |
Company Profile |
SEC
News |
Chart |
Request a new note
C
A
S
I |
QLYS
-
NASDAQ
Qualys Inc
Computer Sftwr-Security
|
$85.70
|
+0.20
0.23% |
$86.30
|
312,814
79.39% of 50 DAV
50 DAV is 394,000
|
$98.30
-12.82%
|
7/23/2018
|
$97.05
|
PP = $97.85
|
|
MB = $102.74
|
Most Recent Note - 8/13/2018 7:17:43 PM
G - Slumped further below its 50 DMA line ($89.42) which has acted as resistance in recent weeks after damaging volume-driven losses. A rebound above the 50 DMA line is needed for its outlook to improve.
>>> FEATURED STOCK ARTICLE : Computer Software-Security Firm Hovering Near All-Time High - 7/16/2018 |
View all notes |
Set NEW NOTE alert |
Company Profile |
SEC
News |
Chart |
Request a new note
C
A
S
I |
PAYC
-
NYSE
Paycom Software Inc
COMPUTER SOFTWARE and SERVICES - Application Software
|
$137.90
|
+3.30
2.45% |
$138.18
|
620,331
69.00% of 50 DAV
50 DAV is 899,000
|
$136.86
0.76%
|
8/1/2018
|
$122.87
|
PP = $118.55
|
|
MB = $124.48
|
Most Recent Note - 8/10/2018 7:48:25 PM
G - Stubbornly holding its ground, extended from prior highs in the $118 area defining initial support to watch on pullbacks. Fundamentals remain strong.
>>> FEATURED STOCK ARTICLE : Bullish Action Followed Strong Earnings News - 8/1/2018 |
View all notes |
Set NEW NOTE alert |
Company Profile |
SEC
News |
Chart |
Request a new note
C
A
S
I |
GRUB
-
NYSE
Grubhub Inc
INTERNET - Content
|
$129.01
|
-0.91
-0.70% |
$130.81
|
998,168
50.90% of 50 DAV
50 DAV is 1,961,000
|
$141.06
-8.54%
|
5/30/2018
|
$107.56
|
PP = $105.68
|
|
MB = $110.96
|
Most Recent Note - 8/10/2018 7:46:31 PM
G - Found support above the prior high ($120), but its has not formed a sound new base. Fundamentals remain strong. Patient investors may watch for a new base or secondary buy point to develop and be noted in the weeks ahead.
>>> FEATURED STOCK ARTICLE : Hovering Near Record High Following Considerable Rally - 8/2/2018 |
View all notes |
Set NEW NOTE alert |
Company Profile |
SEC
News |
Chart |
Request a new note
C
A
S
I |
Symbol/Exchange
Company Name
Industry Group |
PRICE |
CHANGE
(%Change) |
Day High |
Volume
(% DAV)
(% 50 day avg vol) |
52 Wk Hi
% From Hi |
Featured
Date |
Price
Featured |
Pivot Featured |
|
Max Buy |
HQY
-
NASDAQ
Healthequity Inc
COMPUTER SOFTWARE and SERVICES - Healthcare Information Service
|
$84.83
|
+2.44
2.96% |
$84.97
|
368,417
79.57% of 50 DAV
50 DAV is 463,000
|
$83.34
1.79%
|
8/13/2018
|
$82.39
|
PP = $83.44
|
|
MB = $87.61
|
Most Recent Note - 8/13/2018 6:44:30 PM
Y - Color code is changed to yellow while quietly consolidating above its 50 DMA line ($79.45) and perched within close striking distance of its 52-week high. It has formed an advanced ascending base and the new pivot point cited is based on its 7/23/18 high plus 10 cents. Prior low ($72.63 on 7/31/18) defines important near-term support to watch.
>>> FEATURED STOCK ARTICLE : Perched Near All-Time High After Testing Support at 50-Day Average - 7/25/2018 |
View all notes |
Set NEW NOTE alert |
Company Profile |
SEC
News |
Chart |
Request a new note
C
A
S
I |
LOB
-
NASDAQ
"Live Oak Bancshares, Inc."
Banks-Southeast
|
$29.95
|
+0.50
1.70% |
$30.15
|
59,659
34.29% of 50 DAV
50 DAV is 174,000
|
$32.95
-9.10%
|
5/21/2018
|
$29.35
|
PP = $30.15
|
|
MB = $31.66
|
Most Recent Note - 8/13/2018 6:45:33 PM
G - A rebound above the 50 DMA line ($30.60) still is needed for its outlook to improve. The recent low and 200 DMA line ($27.51) define important near-term chart support.
>>> FEATURED STOCK ARTICLE : Bank Making Gradual Progress After Support Found at 50-Day Average - 7/11/2018 |
View all notes |
Set NEW NOTE alert |
Company Profile |
SEC
News |
Chart |
Request a new note
C
A
S
I |
PYPL
-
NASDAQ
Paypal Holdings Inc
Finance-CrdtCard/PmtPr
|
$87.73
|
+0.72
0.83% |
$87.83
|
5,745,774
76.08% of 50 DAV
50 DAV is 7,552,000
|
$92.35
-5.00%
|
7/23/2018
|
$89.24
|
PP = $87.55
|
|
MB = $91.93
|
Most Recent Note - 8/10/2018 7:50:17 PM
Y - Volume totals have been cooling while consolidating above its 50 DMA line ($85.61). Prior low defines important near-term support in the $81 area.
>>> FEATURED STOCK ARTICLE : Paypal Pulling Back From Record High - 7/26/2018 |
View all notes |
Set NEW NOTE alert |
Company Profile |
SEC
News |
Chart |
Request a new note
C
A
S
I |
OLLI
-
NASDAQ
Ollie's Bargain Outlet
Retail-DiscountandVariety
|
$73.55
|
+1.30
1.80% |
$74.30
|
412,407
46.29% of 50 DAV
50 DAV is 891,000
|
$77.50
-5.10%
|
7/12/2018
|
$74.43
|
PP = $77.60
|
|
MB = $81.48
|
Most Recent Note - 8/10/2018 7:54:53 PM
G - Still needs to rebound above its 50 DMA line ($73.09) for its outlook to improve. Fundamentals remain strong.
>>> FEATURED STOCK ARTICLE : Found Recent Support at 50-Day Moving Average Line - 7/5/2018 |
View all notes |
Set NEW NOTE alert |
Company Profile |
SEC
News |
Chart |
Request a new note
C
A
S
I |
NOVT
-
NASDAQ
Novanta Inc
Elec-Scientific/Msrng
|
$69.70
|
+1.60
2.35% |
$70.30
|
100,563
54.65% of 50 DAV
50 DAV is 184,000
|
$69.90
-0.29%
|
7/12/2018
|
$65.90
|
PP = $68.10
|
|
MB = $71.51
|
Most Recent Note - 8/13/2018 6:36:46 PM
Y - Color code is changed to yellow while quietly consolidating above its 50 DMA line ($65.50) and perched within close striking distance of its 52-week high. The prior low ($61.15 on 7/31/18) defines important near-term support where more damaging losses would raise serious concerns
>>> FEATURED STOCK ARTICLE : Gain Challenged 52-Week High and New Pivot Point - 7/12/2018 |
View all notes |
Set NEW NOTE alert |
Company Profile |
SEC
News |
Chart |
Request a new note
C
A
S
I |
Symbol/Exchange
Company Name
Industry Group |
PRICE |
CHANGE
(%Change) |
Day High |
Volume
(% DAV)
(% 50 day avg vol) |
52 Wk Hi
% From Hi |
Featured
Date |
Price
Featured |
Pivot Featured |
|
Max Buy |
TEAM
-
NASDAQ
Atlassian Corp Plc Cl A
Comp Sftwr-Spec Enterprs
|
$78.71
|
+0.48
0.61% |
$78.91
|
866,960
71.30% of 50 DAV
50 DAV is 1,216,000
|
$79.82
-1.39%
|
7/27/2018
|
$73.73
|
PP = $68.85
|
|
MB = $72.29
|
Most Recent Note - 8/13/2018 7:11:19 PM
G - Posted a small gain today with light volume. It has recently wedged to new highs with gains lacking great volume conviction, and it is extended from any sound base. Fundamentals through Jun '18 have been strong.
>>> FEATURED STOCK ARTICLE : Pullback Following Recent technical Breakout - 7/30/2018 |
View all notes |
Set NEW NOTE alert |
Company Profile |
SEC
News |
Chart |
Request a new note
C
A
S
I |
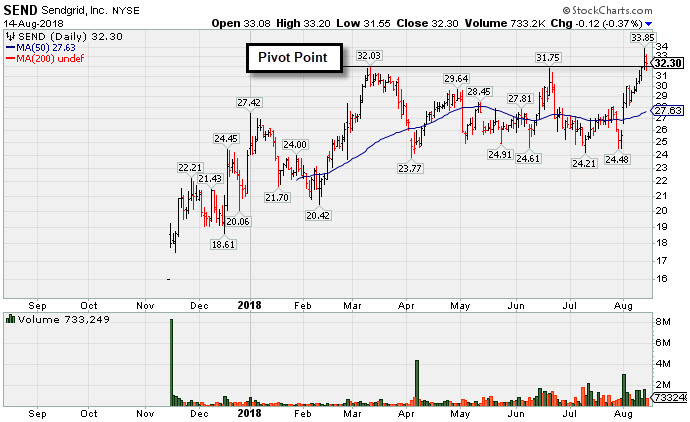
SEND
-
NYSE
Sendgrid Inc
INTERNET - Content
|
$32.30
|
-0.12
-0.37% |
$33.20
|
733,249
81.65% of 50 DAV
50 DAV is 898,000
|
$33.85
-4.58%
|
8/13/2018
|
$32.20
|
PP = $32.13
|
|
MB = $33.74
|
Most Recent Note - 8/14/2018 5:18:59 PM
Y - Pulled back today with lighter volume. On the prior session its color code was changed to yellow with a new pivot point cited based on its 3/12/18 high plus 10 cents. The gain and close above the pivot point backed by +80% above average volume triggered a new technical buy signal. Prior lows in the $24 area define important support. Completed a new Public Offering and Secondary Offering on 4/05/18. See the latest FSU analysis for more details and a new annotated graph.
>>> FEATURED STOCK ARTICLE : Volume-Driven Gains Above 50-Day Average Help Outlook Improve - 6/14/2018 |
View all notes |
Set NEW NOTE alert |
Company Profile |
SEC
News |
Chart |
Request a new note
C
A
S
I |