***Last / Change / Volume data in this table is the closing quote data***
Symbol/Exchange
Company Name
Industry Group |
PRICE |
CHANGE
(%Change) |
Day High |
Volume
(% DAV)
(% 50 day avg vol) |
52 Wk Hi
% From Hi |
Featured
Date |
Price
Featured |
Pivot Featured |
|
Max Buy |
OSBC
-
NASDAQ
Old Second Bancorp Inc
BANKING - Regional - Midwest Banks
|
$15.30
|
+0.00
0.00% |
$15.40
|
57,396
75.52% of 50 DAV
50 DAV is 76,000
|
$16.30
-6.13%
|
5/21/2018
|
$15.50
|
PP = $15.10
|
|
MB = $15.86
|
Most Recent Note - 9/12/2018 7:27:27 PM
G - Consolidating above its 50 DMA line ($15.21). The prior low ($14) and 200 DMA line define additional near-term support. Its Relative Strength Rating is 80, at the minimum guideline for buy candidates. Met stubborn resistance after hitting a new high on 7/26/18 with a big volume-driven gain. Fundamentals remain strong.
>>> FEATURED STOCK ARTICLE : Bank Perched Less Than -5% Off Record High - 8/23/2018 |
View all notes |
Set NEW NOTE alert |
Company Profile |
SEC
News |
Chart |
Request a new note
C
A
S
I |
SIVB
-
NASDAQ
S V B Financial Group
BANKING - Regional - Pacific Banks
|
$314.81
|
-2.60
-0.82% |
$321.98
|
280,062
69.15% of 50 DAV
50 DAV is 405,000
|
$333.74
-5.67%
|
8/6/2018
|
$314.77
|
PP = $329.75
|
|
MB = $346.24
|
Most Recent Note - 9/12/2018 7:26:11 PM
Y - Slumped near its 50 DMA line ($315.25) today, and further deterioration would raise concerns. Met resistance in recent weeks near prior highs. Subsequent gains above the pivot point backed by at least +40% above average volume may trigger a convincing new technical buy signal.
>>> FEATURED STOCK ARTICLE : Bank Posted Quiet Gain for a Best-Ever Close - 8/27/2018 |
View all notes |
Set NEW NOTE alert |
Company Profile |
SEC
News |
Chart |
Request a new note
C
A
S
I |
ZBRA
-
NASDAQ
Zebra Tech Corp Cl A
COMPUTER HARDWARE - Computer Peripherals
|
$176.31
|
+1.62
0.93% |
$177.56
|
244,435
66.79% of 50 DAV
50 DAV is 366,000
|
$175.26
0.60%
|
8/7/2018
|
$164.26
|
PP = $161.82
|
|
MB = $169.91
|
Most Recent Note - 9/12/2018 7:33:00 PM
G - Extended from any sound base after today's 4th consecutive gain with light volume for a new all-time high. Prior high in the $161 area defines initial support above its 50 DMA line ($156) Fundamentals remain strong.
>>> FEATURED STOCK ARTICLE : Big Gain for New High Backed by Heavy Volume - 8/7/2018 |
View all notes |
Set NEW NOTE alert |
Company Profile |
SEC
News |
Chart |
Request a new note
C
A
S
I |
EPAM
-
NYSE
Epam Systems Inc
COMPUTER SOFTWARE and SERVICES - Information Technology Service
|
$139.94
|
+0.23
0.16% |
$141.27
|
220,339
45.43% of 50 DAV
50 DAV is 485,000
|
$144.19
-2.95%
|
7/5/2018
|
$123.70
|
PP = $131.85
|
|
MB = $138.44
|
Most Recent Note - 9/6/2018 12:32:13 PM
Y - Color code is changed to yellow while pulling back below its "max buy" level. Prior highs in the $137 area define near term support along with its 50 DMA line ($132.75). Fundamentals remain strong.
>>> FEATURED STOCK ARTICLE : Tech Services Firm Remains Fundamentally and Technically Strong - 8/20/2018 |
View all notes |
Set NEW NOTE alert |
Company Profile |
SEC
News |
Chart |
Request a new note
C
A
S
I |
IRBT
-
NASDAQ
Irobot Corp
CONSUMER DURABLES - Electronic Equipment
|
$106.75
|
-1.45
-1.34% |
$109.89
|
459,432
46.93% of 50 DAV
50 DAV is 979,000
|
$118.75
-10.11%
|
8/29/2018
|
$112.07
|
PP = $109.88
|
|
MB = $115.37
|
 Most Recent Note - 9/13/2018 5:47:42 PM
Y - Still sputtering below its pivot point. A big loss 9/06/18 on higher volume raised concerns while negating the recent breakout. Disciplined investors always limit losses by selling any stock that falls more than -7% from their purchase price.
>>> FEATURED STOCK ARTICLE : Household Appliance Maker Rallied From Choppy Base - 8/29/2018 |
View all notes |
Set NEW NOTE alert |
Company Profile |
SEC
News |
Chart |
Request a new note
C
A
S
I |
Symbol/Exchange
Company Name
Industry Group |
PRICE |
CHANGE
(%Change) |
Day High |
Volume
(% DAV)
(% 50 day avg vol) |
52 Wk Hi
% From Hi |
Featured
Date |
Price
Featured |
Pivot Featured |
|
Max Buy |
TSC
-
NASDAQ
TriState Capital Hld Inc
CONSUMER NON-DURABLES - Personal Products
|
$28.50
|
-0.95
-3.23% |
$29.65
|
327,933
218.62% of 50 DAV
50 DAV is 150,000
|
$30.10
-5.32%
|
9/11/2018
|
$29.75
|
PP = $30.20
|
|
MB = $31.71
|
Most Recent Note - 9/13/2018 1:22:18 PM
G - Slumping today, raising concerns while violating its 50 DMA line ($28.77), and its color code is changed to green. Only a prompt rebound above the 50 DMA line would help its outlook improve. See the latest FSU analysis for more details and an annotated graph.
>>> FEATURED STOCK ARTICLE : TriState Bank Perched Near All-Time High - 9/11/2018 |
View all notes |
Set NEW NOTE alert |
Company Profile |
SEC
News |
Chart |
Request a new note
C
A
S
I |
FLT
-
NYSE
Fleetcor Technologies
DIVERSIFIED SERVICES - Business/Management Services
|
$221.64
|
+0.63
0.29% |
$222.50
|
489,685
83.14% of 50 DAV
50 DAV is 589,000
|
$225.92
-1.89%
|
9/12/2018
|
$221.01
|
PP = $226.02
|
|
MB = $237.32
|
Most Recent Note - 9/12/2018 7:22:46 PM
Y - Color code is changed to yellow after rallying above its 50 DMA line ($217). New pivot point cited is based on its 7/25/18 high plus 10 cents. Subsequent volume-driven gains above the pivot point may trigger a new (or add-on) technical buy signal. The prior low ($210.64 on 8/03/18) defines important near-term support above its 200 DMA line($202). Fundamentals remain strong.
>>> FEATURED STOCK ARTICLE : Testing 50-Day Average With Loss on Higher Volume - 8/3/2018 |
View all notes |
Set NEW NOTE alert |
Company Profile |
SEC
News |
Chart |
Request a new note
C
A
S
I |
MA
-
NYSE
Mastercard Inc Cl A
Finance-CrdtCard/PmtPr
|
$217.22
|
+3.19
1.49% |
$218.69
|
3,865,548
126.28% of 50 DAV
50 DAV is 3,061,000
|
$217.35
-0.06%
|
7/11/2018
|
$203.84
|
PP = $204.10
|
|
MB = $214.31
|
Most Recent Note - 9/12/2018 7:29:34 PM
Y - Quietly perched near its all-time high. Its 50 DMA line ($206) defines support above the prior lows in the $193-196 area. Fundamentals remain strong.
>>> FEATURED STOCK ARTICLE : Found Support Near 50-Day Moving Average Line - 8/10/2018 |
View all notes |
Set NEW NOTE alert |
Company Profile |
SEC
News |
Chart |
Request a new note
C
A
S
I |
V
-
NYSE
Visa Inc Cl A
Finance-CrdtCard/PmtPr
|
$147.63
|
+1.06
0.72% |
$148.07
|
5,717,046
79.07% of 50 DAV
50 DAV is 7,230,000
|
$147.86
-0.16%
|
4/26/2018
|
$126.68
|
PP = $126.98
|
|
MB = $133.33
|
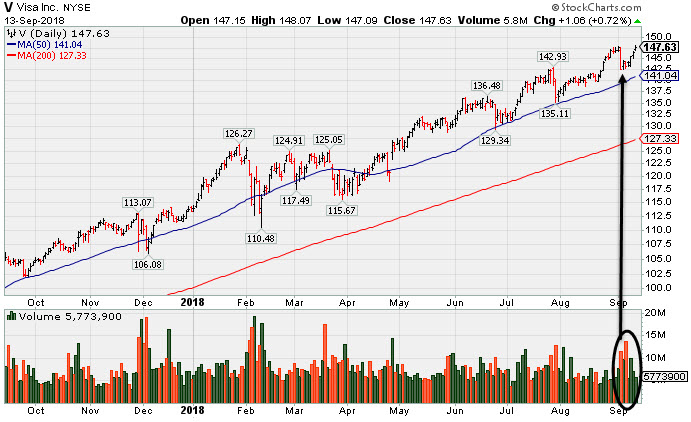
Most Recent Note - 9/13/2018 5:40:45 PM
G - Endured distributional pressure and it is extended from any sound base. Its 50 DMA line ($141) and recent low ($135.31 on 7/30/18) define important near-term support to watch on pullbacks. Fundamentals remain strong. See the latest FSU analysis for more details and an annotated graph.
>>> FEATURED STOCK ARTICLE : Visa Near Record but Endured Distributional Pressure - 9/13/2018 |
View all notes |
Set NEW NOTE alert |
Company Profile |
SEC
News |
Chart |
Request a new note
C
A
S
I |
NANO
-
NASDAQ
Nanometrics Inc
ELECTRONICS - Scientific and Technical Instrum
|
$37.03
|
-0.02
-0.05% |
$37.81
|
509,056
126.00% of 50 DAV
50 DAV is 404,000
|
$48.26
-23.27%
|
8/13/2018
|
$44.17
|
PP = $44.27
|
|
MB = $46.48
|
Most Recent Note - 9/12/2018 7:12:34 PM
G - Slumped further below its 50 DMA line ($40.05) with today's 8th consecutive volume-driven loss raising concerns. A rebound above the 50 DMA line is needed for its outlook to improve. Fundamentals remain strong.
>>> FEATURED STOCK ARTICLE : Five Times Average Volume Behind Breakout Gain - 8/13/2018 |
View all notes |
Set NEW NOTE alert |
Company Profile |
SEC
News |
Chart |
Request a new note
C
A
S
I |
Symbol/Exchange
Company Name
Industry Group |
PRICE |
CHANGE
(%Change) |
Day High |
Volume
(% DAV)
(% 50 day avg vol) |
52 Wk Hi
% From Hi |
Featured
Date |
Price
Featured |
Pivot Featured |
|
Max Buy |
ENV
-
NYSE
Envestnet Inc
FINANCIAL SERVICES - Diversified Investments
|
$63.80
|
+0.65
1.03% |
$63.95
|
187,711
69.52% of 50 DAV
50 DAV is 270,000
|
$64.00
-0.31%
|
6/15/2018
|
$57.85
|
PP = $60.37
|
|
MB = $63.39
|
Most Recent Note - 9/12/2018 7:19:17 PM
Y - Perched near its all-time high, stubbornly holding its ground. Found prompt support near its 50 DMA line ($60.23) in recent weeks. Fundamentals remain strong.
>>> FEATURED STOCK ARTICLE : Earnings News Due for Financial Firm Perched Near High - 8/6/2018 |
View all notes |
Set NEW NOTE alert |
Company Profile |
SEC
News |
Chart |
Request a new note
C
A
S
I |
TPL
-
NYSE
Texas Pacific Land Trust
Real Estate Dvlpmt/Ops
|
$841.16
|
+6.16
0.74% |
$844.99
|
7,744
59.57% of 50 DAV
50 DAV is 13,000
|
$874.00
-3.76%
|
7/5/2018
|
$714.90
|
PP = $739.99
|
|
MB = $776.99
|
Most Recent Note - 9/11/2018 12:30:40 PM
G - Stubbornly holding its ground perched near its all-time high, extended from any sound base. The 50 DMA line ($789) and recent low ($760 on 8/15/18) define important near-term support to watch on pullbacks.
>>> FEATURED STOCK ARTICLE : Best Ever Close After a Solid Gain on Higher Volume - 9/4/2018 |
View all notes |
Set NEW NOTE alert |
Company Profile |
SEC
News |
Chart |
Request a new note
C
A
S
I |
FIZZ
-
NASDAQ
National Beverage Corp
FOOD and BEVERAGE - Beverages - Soft Drinks
|
$123.50
|
-0.65
-0.52% |
$124.94
|
161,377
80.29% of 50 DAV
50 DAV is 201,000
|
$127.32
-3.00%
|
9/6/2018
|
$125.92
|
PP = $129.92
|
|
MB = $136.42
|
Most Recent Note - 9/12/2018 12:16:01 PM
Y - Rallying near prior highs with today's 3rd consecutive gain backed by above average volume. Highlighted in yellow with new pivot point cited based on its 9/11/17 high plus 10 cents in the 9/06/18 mid-day report, it challenged its high with a big gain backed by +111% above average volume, but met resistance. Subsequent gains above the pivot point for a a new high (N criteria) backed by at least +40% above average volume may trigger a proper technical buy signal. Reported Jun '17 quarterly earnings +32% on +20% sales revenues, continuing its streak of strong quarterly earnings (C criteria) results. Annual earnings (A criteria) growth has been strong after a downturn in FY '14. Small supply of only 11.2 million shares (S criteria) in the public float can contribute to greater volatility.
>>> FEATURED STOCK ARTICLE : Strong Beverage Firm Challenges Prior High - 9/6/2018 |
View all notes |
Set NEW NOTE alert |
Company Profile |
SEC
News |
Chart |
Request a new note
C
A
S
I |
ODFL
-
NASDAQ
Old Dominion Fght Line
TRANSPORTATION - Trucking
|
$166.38
|
-0.23
-0.14% |
$168.02
|
400,828
68.63% of 50 DAV
50 DAV is 584,000
|
$170.22
-2.26%
|
9/6/2018
|
$163.11
|
PP = $164.20
|
|
MB = $172.41
|
Most Recent Note - 9/7/2018 6:04:46 PM
Y -Reversed into the red today after early gains into new high territory. Highlighted in yellow with new pivot point cited based on its 6/12/18 high plus 10 cents in the prior mid-day report. Gain above the pivot point backed by +80% above average volume triggered a technical buy signal. Found support near its 200 DMA line during the consolidation since last noted in the 7/26/18 mid-day report - "Reported Jun '18 quarterly earnings +67% on +23% sales revenues, its 3rd consecutive strong quarterly comparison versus the year-ago period." See the latest FSU analysis for more details and a new annotated graph.
>>> FEATURED STOCK ARTICLE : Trucking Firm Perched at All-Time High - 9/7/2018 |
View all notes |
Set NEW NOTE alert |
Company Profile |
SEC
News |
Chart |
Request a new note
C
A
S
I |
DPZ
-
NYSE
Dominos Pizza Inc
Retail-Restaurants
|
$284.84
|
+0.15
0.05% |
$286.18
|
275,664
48.19% of 50 DAV
50 DAV is 572,000
|
$305.34
-6.71%
|
8/13/2018
|
$288.60
|
PP = $293.91
|
|
MB = $308.61
|
Most Recent Note - 9/11/2018 5:12:23 PM
Y - Still enduring mild distributional pressure after recently wedging to new 52-week highs with gains lacking volume conviction. Subsequent gains above the pivot point backed by at least +40% above average volume are still needed to clinch a proper new (or add-on) technical buy signal.
>>> FEATURED STOCK ARTICLE : Pulling Back After Wedging Gains for Highs Lacked Great Volume - 9/5/2018 |
View all notes |
Set NEW NOTE alert |
Company Profile |
SEC
News |
Chart |
Request a new note
C
A
S
I |
Symbol/Exchange
Company Name
Industry Group |
PRICE |
CHANGE
(%Change) |
Day High |
Volume
(% DAV)
(% 50 day avg vol) |
52 Wk Hi
% From Hi |
Featured
Date |
Price
Featured |
Pivot Featured |
|
Max Buy |
FIVE
-
NASDAQ
Five Below Inc
Retail-DiscountandVariety
|
$130.85
|
-0.52
-0.40% |
$132.95
|
798,399
86.97% of 50 DAV
50 DAV is 918,000
|
$136.13
-3.88%
|
7/6/2018
|
$98.90
|
PP = $104.09
|
|
MB = $109.29
|
Most Recent Note - 9/7/2018 11:42:12 AM
G - Gapped up today hitting a new all-time high and getting very extended from any sound base. Bullish action came after reporting earnings +40% on +23% sales revenues for the Jul '18 quarter, continuing its strong earnings track record. Prior highs and its 50 DMA line ($105.50) define near-term support to watch on pullbacks.
>>> FEATURED STOCK ARTICLE : Volume Totals Cooling While Perched Near Record High - 8/16/2018 |
View all notes |
Set NEW NOTE alert |
Company Profile |
SEC
News |
Chart |
Request a new note
C
A
S
I |
NOW
-
NYSE
Servicenow Inc
Computer Sftwr-Enterprse
|
$204.58
|
+1.81
0.89% |
$206.30
|
1,469,903
85.41% of 50 DAV
50 DAV is 1,721,000
|
$203.34
0.61%
|
8/24/2018
|
$193.83
|
PP = $194.91
|
|
MB = $204.66
|
Most Recent Note - 9/12/2018 7:35:15 PM
Y - Finished strong today as it posted a 5th consecutive gain with near average volume and hit a new 52-week high. The 8/29/18 gain above the pivot point backed by +77% above average volume clinched a new (or add-on) technical buy signal. The recent low ($174) defines the next important near-term support. Fundamentals remain strong.
>>> FEATURED STOCK ARTICLE : Slump Below 50-Day Average Line Raises Concerns - 8/17/2018 |
View all notes |
Set NEW NOTE alert |
Company Profile |
SEC
News |
Chart |
Request a new note
C
A
S
I |
NVEE
-
NASDAQ
N V 5 Global Inc
Comml Svcs-Consulting
|
$89.20
|
-0.25
-0.28% |
$90.80
|
85,732
114.31% of 50 DAV
50 DAV is 75,000
|
$92.75
-3.83%
|
6/15/2018
|
$7,070.00
|
PP = $72.00
|
|
MB = $75.60
|
Most Recent Note - 9/12/2018 7:31:07 PM
G - Perched near its all-time high, extended from any sound base. Completed a new Public Offering on 8/09/18. Its 50 DMA line ($81.32) defines near-term support to watch on pullbacks.
>>> FEATURED STOCK ARTICLE : Remains Perched Near All-Time High Following Offering - 8/21/2018 |
View all notes |
Set NEW NOTE alert |
Company Profile |
SEC
News |
Chart |
Request a new note
C
A
S
I |
PANW
-
NYSE
Palo Alto Networks
Computer Sftwr-Security
|
$236.10
|
-0.13
-0.06% |
$239.50
|
703,568
56.56% of 50 DAV
50 DAV is 1,244,000
|
$238.25
-0.90%
|
6/12/2018
|
$206.55
|
PP = $214.69
|
|
MB = $225.42
|
Most Recent Note - 9/10/2018 12:29:10 PM
G - Hitting another new all-time high with today's 2nd consecutive volume-driven gain. Its 50 DMA line ($214.64) defines initial support above the prior low ($193 on 7/30/18). Reported +39% earnings on +29% sales revenues for the Jul '18 quarter, continuing its strong earnings track record.
>>> FEATURED STOCK ARTICLE : Violated 50-day Average With Volume-driven Loss - 7/31/2018 |
View all notes |
Set NEW NOTE alert |
Company Profile |
SEC
News |
Chart |
Request a new note
C
A
S
I |
QLYS
-
NASDAQ
Qualys Inc
Computer Sftwr-Security
|
$94.85
|
-0.50
-0.52% |
$96.70
|
183,932
55.74% of 50 DAV
50 DAV is 330,000
|
$98.30
-3.51%
|
8/31/2018
|
$91.05
|
PP = $98.40
|
|
MB = $103.32
|
Most Recent Note - 9/12/2018 7:37:18 PM
Y - Color code is changed to yellow while consolidating above its 50 DMA line ($90.04). Subsequent volume-driven gains above the pivot point may trigger a technical buy signal. The recent low ($82.91 on 8/15/18) defines the next important near term support to watch.
>>> FEATURED STOCK ARTICLE : Cloud Security Firm Faces Some Near Term Resistance - 9/3/2018 |
View all notes |
Set NEW NOTE alert |
Company Profile |
SEC
News |
Chart |
Request a new note
C
A
S
I |
Symbol/Exchange
Company Name
Industry Group |
PRICE |
CHANGE
(%Change) |
Day High |
Volume
(% DAV)
(% 50 day avg vol) |
52 Wk Hi
% From Hi |
Featured
Date |
Price
Featured |
Pivot Featured |
|
Max Buy |
ANET
-
NYSE
"Arista Networks, Inc"
TELECOMMUNICATIONS - Communication Equipment
|
$270.06
|
+2.21
0.83% |
$272.00
|
826,862
76.19% of 50 DAV
50 DAV is 1,085,200
|
$313.37
-13.82%
|
8/24/2018
|
$308.26
|
PP = $311.77
|
|
MB = $327.36
|
Most Recent Note - 9/13/2018 5:44:23 PM
G - Color code is changed to green while sputtering below its 50 DMA line ($273.59). Found support at its 200 DMA line ($263), but more damaging losses would raise serious concerns. Subsequent gains above its 50 DMA line are needed for its outlook to improve.
>>> FEATURED STOCK ARTICLE : Considerable Gap Up Gain With Heavy Volume - 8/24/2018 |
View all notes |
Set NEW NOTE alert |
Company Profile |
SEC
News |
Chart |
Request a new note
C
A
S
I |
PAYC
-
NYSE
Paycom Software Inc
COMPUTER SOFTWARE and SERVICES - Application Software
|
$162.09
|
+3.23
2.03% |
$162.72
|
653,944
87.66% of 50 DAV
50 DAV is 746,000
|
$159.85
1.40%
|
8/1/2018
|
$122.87
|
PP = $118.55
|
|
MB = $124.48
|
Most Recent Note - 9/13/2018 5:45:46 PM
G - Hit yet another new all-time high today, getting very extended from any sound base. Fundamentals remain strong.
>>> FEATURED STOCK ARTICLE : Bullish Action Followed Strong Earnings News - 8/1/2018 |
View all notes |
Set NEW NOTE alert |
Company Profile |
SEC
News |
Chart |
Request a new note
C
A
S
I |
GRUB
-
NYSE
Grubhub Inc
INTERNET - Content
|
$144.97
|
+2.37
1.66% |
$145.40
|
693,476
48.84% of 50 DAV
50 DAV is 1,420,000
|
$147.72
-1.86%
|
8/24/2018
|
$138.44
|
PP = $141.16
|
|
MB = $148.22
|
Most Recent Note - 9/11/2018 5:13:47 PM
Y - Posted a solid gain today with only average volume as it hit a new all-time high. Recent gains lacked great volume conviction. Gains above the pivot point backed by at least +40% above average volume are needed to trigger a proper new (or add-on) technical buy signal.
>>> FEATURED STOCK ARTICLE : Hovering Near Record High Following Considerable Rally - 8/2/2018 |
View all notes |
Set NEW NOTE alert |
Company Profile |
SEC
News |
Chart |
Request a new note
C
A
S
I |
HQY
-
NASDAQ
Healthequity Inc
COMPUTER SOFTWARE and SERVICES - Healthcare Information Service
|
$94.31
|
-0.20
-0.21% |
$95.77
|
742,315
186.04% of 50 DAV
50 DAV is 399,000
|
$97.94
-3.71%
|
8/13/2018
|
$82.39
|
PP = $83.44
|
|
MB = $87.61
|
Most Recent Note - 9/13/2018 12:53:22 PM
G - Very extended from any sound base. Its 50 DMA line ($85) and prior highs in the $82-83 area define support to watch on pullbacks.
>>> FEATURED STOCK ARTICLE : Very Extended From Any Sound Base After Streak of Gains - 9/10/2018 |
View all notes |
Set NEW NOTE alert |
Company Profile |
SEC
News |
Chart |
Request a new note
C
A
S
I |
PYPL
-
NASDAQ
Paypal Holdings Inc
Finance-CrdtCard/PmtPr
|
$92.19
|
-0.21
-0.23% |
$93.70
|
7,995,183
114.01% of 50 DAV
50 DAV is 7,013,000
|
$93.44
-1.34%
|
7/23/2018
|
$89.24
|
PP = $87.55
|
|
MB = $91.93
|
Most Recent Note - 9/12/2018 7:17:06 PM
G - Posted a 3rd consecutive gain and its color code is changed to green after rising back above its "max buy" level. Its 50 DMA line ($87.71) defines support above prior lows in the $80-81 area. See the latest FSU analysis for more details and a new annotated graph.
>>> FEATURED STOCK ARTICLE : Consolidating Above 50-Day Moving Average Near High - 9/12/2018 |
View all notes |
Set NEW NOTE alert |
Company Profile |
SEC
News |
Chart |
Request a new note
C
A
S
I |
Symbol/Exchange
Company Name
Industry Group |
PRICE |
CHANGE
(%Change) |
Day High |
Volume
(% DAV)
(% 50 day avg vol) |
52 Wk Hi
% From Hi |
Featured
Date |
Price
Featured |
Pivot Featured |
|
Max Buy |
OLLI
-
NASDAQ
Ollie's Bargain Outlet
Retail-DiscountandVariety
|
$90.55
|
-0.30
-0.33% |
$92.14
|
495,943
80.64% of 50 DAV
50 DAV is 615,000
|
$94.70
-4.38%
|
7/12/2018
|
$74.43
|
PP = $77.60
|
|
MB = $81.48
|
Most Recent Note - 9/6/2018 1:19:28 PM
G - Reported earnings +48% on +13% sales revenues for the Jul '18 quarter, continuing its strong earnings track record. Extended from any sound base and perched at its all-time high after 14 consecutive gains. Prior highs in the $77 area define initial support to watch above its 50 DMA line ($75.24).
>>> FEATURED STOCK ARTICLE : Hitting New Highs With More Volume-Driven Gains - 8/22/2018 |
View all notes |
Set NEW NOTE alert |
Company Profile |
SEC
News |
Chart |
Request a new note
C
A
S
I |
NOVT
-
NASDAQ
Novanta Inc
Elec-Scientific/Msrng
|
$74.20
|
-0.85
-1.13% |
$76.15
|
140,975
75.39% of 50 DAV
50 DAV is 187,000
|
$78.85
-5.90%
|
7/12/2018
|
$65.90
|
PP = $68.10
|
|
MB = $71.51
|
Most Recent Note - 9/12/2018 7:14:24 PM
G - Managed a "positive reversal" today. It is extended from the prior base. Its 50 DMA line ($69.94) and prior highs in the $68-69 area define support
>>> FEATURED STOCK ARTICLE : Electronic Systems Leader is Extended From Prior Base - 8/30/2018 |
View all notes |
Set NEW NOTE alert |
Company Profile |
SEC
News |
Chart |
Request a new note
C
A
S
I |
TEAM
-
NASDAQ
Atlassian Corp Plc Cl A
Comp Sftwr-Spec Enterprs
|
$93.42
|
+3.84
4.29% |
$94.72
|
1,878,794
142.77% of 50 DAV
50 DAV is 1,316,000
|
$92.26
1.26%
|
7/27/2018
|
$73.73
|
PP = $68.85
|
|
MB = $72.29
|
Most Recent Note - 9/11/2018 5:15:57 PM
G - Posted a gain on light volume ending near its all-time high, very extended from any sound base. The 50 DMA line ($75.68) defines near-term support to watch on pullbacks. Fundamentals through Jun '18 have been strong.
>>> FEATURED STOCK ARTICLE : Pullback Following Recent technical Breakout - 7/30/2018 |
View all notes |
Set NEW NOTE alert |
Company Profile |
SEC
News |
Chart |
Request a new note
C
A
S
I |
SEND
-
NYSE
Sendgrid Inc
INTERNET - Content
|
$37.26
|
+0.22
0.59% |
$37.99
|
520,030
57.08% of 50 DAV
50 DAV is 911,000
|
$38.66
-3.62%
|
8/13/2018
|
$32.20
|
PP = $32.13
|
|
MB = $33.74
|
Most Recent Note - 9/12/2018 7:24:38 PM
G - Very extended from the latest base, it pulled back from its all-time high with a loss today on light volume. Prior highs in the $32 area define initial support to watch above its 50 DMA line.
>>> FEATURED STOCK ARTICLE : Strength Returned After Finding Support Near Prior Lows - 8/14/2018 |
View all notes |
Set NEW NOTE alert |
Company Profile |
SEC
News |
Chart |
Request a new note
C
A
S
I |