***Last / Change / Volume data in this table is the closing quote data***
Symbol/Exchange
Company Name
Industry Group |
PRICE |
CHANGE
(%Change) |
Day High |
Volume
(% DAV)
(% 50 day avg vol) |
52 Wk Hi
% From Hi |
Featured
Date |
Price
Featured |
Pivot Featured |
|
Max Buy |
OSBC
-
NASDAQ
Old Second Bancorp Inc
BANKING - Regional - Midwest Banks
|
$14.95
|
-0.15
-0.99% |
$15.18
|
55,645
56.49% of 50 DAV
50 DAV is 98,500
|
$16.30
-8.28%
|
5/21/2018
|
$15.50
|
PP = $15.10
|
|
MB = $15.86
|
 Most Recent Note - 8/13/2018 7:04:11 PM
G - Color code is changed to green while still sputtering near its 50 DMA line ($15.06) while the prior low ($14) and 200 DMA line define additional near-term support. Met stubborn resistance after hitting a new high on 7/26/18 with a big volume-driven gain. Its Relative Strength Rating has slumped to 78, below the 80+ minimum guideline for buy candidates. Fundamentals remain strong after it reported Jun '18 quarterly earnings +71% on +23% sales revenues.
>>> FEATURED STOCK ARTICLE : Consolidating Above 50-Day Moving Average - 7/9/2018 |
View all notes |
Set NEW NOTE alert |
Company Profile |
SEC
News |
Chart |
Request a new note
C
A
S
I |
SIVB
-
NASDAQ
S V B Financial Group
BANKING - Regional - Pacific Banks
|
$315.29
|
-1.46
-0.46% |
$321.80
|
345,610
72.45% of 50 DAV
50 DAV is 477,000
|
$333.74
-5.53%
|
8/6/2018
|
$314.77
|
PP = $329.75
|
|
MB = $346.24
|
Most Recent Note - 8/13/2018 7:06:13 PM
Y - Still quietly perched near its all-time high. Subsequent gains above the pivot point backed by at least +40% above average volume may trigger a new technical buy signal. The 50 DMA line ($310) and recent low ($284.42 on 7/02/18) define near-term support to watch on pullbacks. Fundamentals remain strong.
>>> FEATURED STOCK ARTICLE : Still Sputtering Below 50-Day Moving Average - 7/10/2018 |
View all notes |
Set NEW NOTE alert |
Company Profile |
SEC
News |
Chart |
Request a new note
C
A
S
I |
ZBRA
-
NASDAQ
Zebra Tech Corp Cl A
COMPUTER HARDWARE - Computer Peripherals
|
$161.94
|
+0.68
0.42% |
$164.65
|
483,654
113.00% of 50 DAV
50 DAV is 428,000
|
$167.61
-3.38%
|
8/7/2018
|
$164.26
|
PP = $161.82
|
|
MB = $169.91
|
Most Recent Note - 8/8/2018 1:15:24 PM
Y - Pulling back below its pivot point today following a considerable volume-driven gain on the prior session. Finished strong after highlighted in yellow with pivot point cited based on its 6/08/18 high plus 10 cents in the prior mid-day report. Triggered a technical buy signal as it gapped up today hitting a new all-time high with more than 4 times average volume, rebounding from below its 50 DMA line. Reported Jun '18 earnings +64% on +13% sales revenues. Three of the past 4 quarters showed earnings increases above the +25% minimum guideline (C criteria). Recent sequential comparisons show encouraging sales revenues acceleration. Annual earnings (A criteria) history has been strong since a downturn in FY '08 and '09. See the latest FSU analysis for more details and an annotated graph.
>>> FEATURED STOCK ARTICLE : Big Gain for New High Backed by Heavy Volume - 8/7/2018 |
View all notes |
Set NEW NOTE alert |
Company Profile |
SEC
News |
Chart |
Request a new note
C
A
S
I |
EPAM
-
NYSE
Epam Systems Inc
COMPUTER SOFTWARE and SERVICES - Information Technology Service
|
$128.30
|
-1.97
-1.51% |
$131.05
|
292,822
52.20% of 50 DAV
50 DAV is 561,000
|
$137.73
-6.85%
|
7/5/2018
|
$123.70
|
PP = $131.85
|
|
MB = $138.44
|
Most Recent Note - 8/10/2018 7:44:22 PM
Y - Finding support above its 50 DMA line ($127.81). Fundamentals remain strong. The recent low ($115) and 200 DMA line define important near term support to watch on pullbacks,
>>> FEATURED STOCK ARTICLE : Sputtering Below 50-Day Average After Negating Prior Breakout - 6/27/2018 |
View all notes |
Set NEW NOTE alert |
Company Profile |
SEC
News |
Chart |
Request a new note
C
A
S
I |
FLT
-
NYSE
Fleetcor Technologies
DIVERSIFIED SERVICES - Business/Management Services
|
$214.82
|
-2.71
-1.25% |
$218.84
|
471,470
37.30% of 50 DAV
50 DAV is 1,264,000
|
$225.92
-4.91%
|
6/18/2018
|
$219.31
|
PP = $213.84
|
|
MB = $224.53
|
Most Recent Note - 8/13/2018 7:02:05 PM
Y - Consolidating near its 50 DMA line ($214.75) which has been acting as support.. The prior low ($210.64 on 8/03/18) also defines important near-term support. Reported earnings +29% on +8% sales revenues for the Jun '18 quarter, its 3rd consecutive quarterly comparison above the +25% minimum guideline (C criteria).
>>> FEATURED STOCK ARTICLE : Testing 50-Day Average With Loss on Higher Volume - 8/3/2018 |
View all notes |
Set NEW NOTE alert |
Company Profile |
SEC
News |
Chart |
Request a new note
C
A
S
I |
Symbol/Exchange
Company Name
Industry Group |
PRICE |
CHANGE
(%Change) |
Day High |
Volume
(% DAV)
(% 50 day avg vol) |
52 Wk Hi
% From Hi |
Featured
Date |
Price
Featured |
Pivot Featured |
|
Max Buy |
MA
-
NYSE
Mastercard Inc Cl A
Finance-CrdtCard/PmtPr
|
$202.31
|
-0.34
-0.17% |
$204.34
|
1,907,839
58.24% of 50 DAV
50 DAV is 3,276,000
|
$214.28
-5.59%
|
7/11/2018
|
$203.84
|
PP = $204.10
|
|
MB = $214.31
|
Most Recent Note - 8/10/2018 7:41:57 PM
Y - Found prompt support near its 50 DMA line ($201) following another strong earnings report. Recent lows in the $193-196 area define important near-term support to watch. See the latest FSU analysis for more details and a new annotated graph.
>>> FEATURED STOCK ARTICLE : Found Support Near 50-Day Moving Average Line - 8/10/2018 |
View all notes |
Set NEW NOTE alert |
Company Profile |
SEC
News |
Chart |
Request a new note
C
A
S
I |
V
-
NYSE
Visa Inc Cl A
Finance-CrdtCard/PmtPr
|
$140.21
|
+0.48
0.34% |
$141.24
|
4,817,267
64.58% of 50 DAV
50 DAV is 7,459,000
|
$143.14
-2.05%
|
4/26/2018
|
$126.68
|
PP = $126.98
|
|
MB = $133.33
|
Most Recent Note - 8/13/2018 7:13:27 PM
G - Remains perched near its all-time high, extended frm any sound base. Its 50 DMA line ($136.78) and recent low ($135.31 on 7/30/18) define important near-term support to watch on pullbacks. Fundamentals remain strong.
>>> FEATURED STOCK ARTICLE : Perched Near All-Time High After Rally From 50-Day Average - 7/27/2018 |
View all notes |
Set NEW NOTE alert |
Company Profile |
SEC
News |
Chart |
Request a new note
C
A
S
I |
NANO
-
NASDAQ
Nanometrics Inc
ELECTRONICS - Scientific and Technical Instrum
|
$45.17
|
+3.34
7.98% |
$45.34
|
1,613,149
510.49% of 50 DAV
50 DAV is 316,000
|
$44.17
2.26%
|
8/13/2018
|
$44.17
|
PP = $44.27
|
|
MB = $46.48
|
Most Recent Note - 8/13/2018 6:32:42 PM
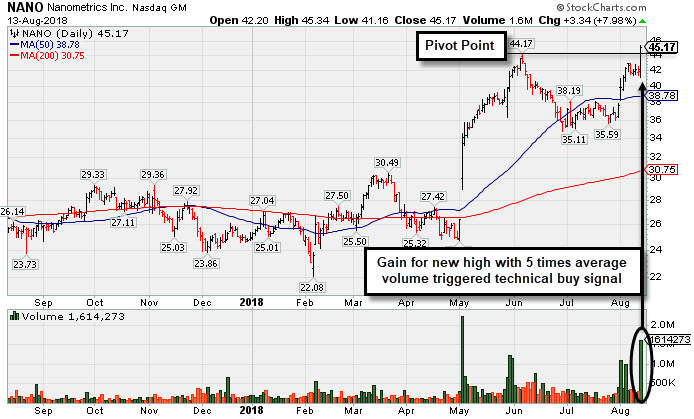
Y - Finished strong with a gain for a new 52-week high backed by 5 times average volume. It was highlighted in yellow with pivot point cited based on its 6/06/18 high plus 10 cents in the earlier mid-day report. It rallied from a cup shaped base, and it faces no resistance due to overhead supply. Recent quarters through Jun '18 showed much better sales and earnings increases versus the year earlier. Annual earnings (A criteria) have improved greatly since a downturn and losses FY '13 and '14. See the latest FSU analysis for more details and a new annotated graph.
>>> FEATURED STOCK ARTICLE : Five Times Average Volume Behind Breakout Gain - 8/13/2018 |
View all notes |
Set NEW NOTE alert |
Company Profile |
SEC
News |
Chart |
Request a new note
C
A
S
I |
ENV
-
NYSE
Envestnet Inc
FINANCIAL SERVICES - Diversified Investments
|
$59.25
|
+0.30
0.51% |
$59.35
|
266,698
81.56% of 50 DAV
50 DAV is 327,000
|
$62.95
-5.88%
|
6/15/2018
|
$57.85
|
PP = $60.37
|
|
MB = $63.39
|
Most Recent Note - 8/8/2018 1:23:00 PM
Y - Reported Jun '18 earnings +41% on +20% sales revenues, continuing its strong earnings track record. Volume and volatility often increase near earnings news. Testing support near its 50 DMA line ($57.85). Encountered distributional pressure after a volume-driven gain for a new high on 7/23/18 triggered a technical buy signal. The recent low ($53.75 on 6/28/18) and 200 DMA line define important near-term support.
>>> FEATURED STOCK ARTICLE : Earnings News Due for Financial Firm Perched Near High - 8/6/2018 |
View all notes |
Set NEW NOTE alert |
Company Profile |
SEC
News |
Chart |
Request a new note
C
A
S
I |
TPL
-
NYSE
Texas Pacific Land Trust
Real Estate Dvlpmt/Ops
|
$799.20
|
-5.80
-0.72% |
$823.06
|
13,331
88.87% of 50 DAV
50 DAV is 15,000
|
$825.90
-3.23%
|
7/5/2018
|
$714.90
|
PP = $739.99
|
|
MB = $776.99
|
Most Recent Note - 8/10/2018 7:56:39 PM
G - Hovering near its all-time high, stubbornly holding its ground. The 50 DMA line ($739) and recent low ($720 on 7/30/18) define important near-term support.
>>> FEATURED STOCK ARTICLE : Volume Totals Cooling While Consolidating Above Prior High - 7/20/2018 |
View all notes |
Set NEW NOTE alert |
Company Profile |
SEC
News |
Chart |
Request a new note
C
A
S
I |
Symbol/Exchange
Company Name
Industry Group |
PRICE |
CHANGE
(%Change) |
Day High |
Volume
(% DAV)
(% 50 day avg vol) |
52 Wk Hi
% From Hi |
Featured
Date |
Price
Featured |
Pivot Featured |
|
Max Buy |
STMP
-
NASDAQ
Stamps.com Inc
Retail-Internet
|
$237.60
|
-17.90
-7.01% |
$257.70
|
430,420
145.41% of 50 DAV
50 DAV is 296,000
|
$285.75
-16.85%
|
8/2/2018
|
$280.60
|
PP = $285.85
|
|
MB = $300.14
|
Most Recent Note - 8/13/2018 7:08:12 PM
G - Suffered another big loss today. Weakness last week was noted as it triggered a technical sell signal and nearly tested its 200 DMA line ($217) before rebounding. Recently met resistance near the prior high. A rebound above the 50 DMA line ($265) still is needed for its outlook to improve. Reported Jun '18 quarterly earnings +32% on +20% sales revenues, continuing its strong earnings history.
>>> FEATURED STOCK ARTICLE : Big Loss on Heavy Volume Tests 50-Day Moving Average - 6/21/2018 |
View all notes |
Set NEW NOTE alert |
Company Profile |
SEC
News |
Chart |
Request a new note
C
A
S
I |
CHDN
-
NASDAQ
Churchill Downs Inc
LEISURE - Gaming Activities
|
$286.40
|
+6.25
2.23% |
$287.25
|
74,527
122.18% of 50 DAV
50 DAV is 61,000
|
$314.60
-8.96%
|
6/20/2018
|
$285.80
|
PP = $314.70
|
|
MB = $330.44
|
Most Recent Note - 8/13/2018 6:48:17 PM
G - Posted a solid gain today with higher volume. A rebound above its downward sloping 50 DMA line ($295.54) still is needed for its outlook to improve. Fundamentals remain strong.
>>> FEATURED STOCK ARTICLE : Consolidating Near 50-Day Moving Average - 6/29/2018 |
View all notes |
Set NEW NOTE alert |
Company Profile |
SEC
News |
Chart |
Request a new note
C
A
S
I |
DPZ
-
NYSE
Dominos Pizza Inc
Retail-Restaurants
|
$288.60
|
-2.71
-0.93% |
$293.11
|
334,561
51.23% of 50 DAV
50 DAV is 653,000
|
$295.24
-2.25%
|
8/13/2018
|
$288.60
|
PP = $293.91
|
|
MB = $308.61
|
Most Recent Note - 8/13/2018 6:59:50 PM
Y - New pivot point is cited based on its 6/22/18 high plus 10 cents. Wedged up to a new 52-week high last week and it is holding its ground with volume totals cooling. Subsequent gains above the pivot point backed by at least +40% above average volume may trigger a new (or add-on) technical buy signal.
>>> FEATURED STOCK ARTICLE : Consolidating Near 50-Day Moving Average Line - 7/23/2018 |
View all notes |
Set NEW NOTE alert |
Company Profile |
SEC
News |
Chart |
Request a new note
C
A
S
I |
FIVE
-
NASDAQ
Five Below Inc
Retail-DiscountandVariety
|
$104.48
|
-1.45
-1.37% |
$106.79
|
507,978
38.72% of 50 DAV
50 DAV is 1,312,000
|
$109.09
-4.23%
|
7/6/2018
|
$98.90
|
PP = $104.09
|
|
MB = $109.29
|
Most Recent Note - 8/13/2018 7:20:11 PM
Y - Quietly perched within close striking distance of its prior high. Its 50 DMA line ($99.21) defines near-term support above prior lows in the $95-96 area. Subsequent gains above the pivot point must have a minimum of +40% above average volume to trigger a proper technical buy signal.
>>> FEATURED STOCK ARTICLE : Hovering Near Record High After Big Gap Up and Volume-Driven Gain - 6/25/2018 |
View all notes |
Set NEW NOTE alert |
Company Profile |
SEC
News |
Chart |
Request a new note
C
A
S
I |
NOW
-
NYSE
Servicenow Inc
Computer Sftwr-Enterprse
|
$185.02
|
-2.45
-1.31% |
$189.17
|
872,392
51.17% of 50 DAV
50 DAV is 1,705,000
|
$194.81
-5.03%
|
5/8/2018
|
$174.63
|
PP = $176.66
|
|
MB = $185.49
|
Most Recent Note - 8/10/2018 7:53:16 PM
Y - Volume totals have been cooling while consolidating above its 50 DMA line ($183). The recent low ($174) defines the next important near-term support. Fundamentals remain strong.
>>> FEATURED STOCK ARTICLE : Recent Slump Below 50-Day Average Hurt Outlook - 6/26/2018 |
View all notes |
Set NEW NOTE alert |
Company Profile |
SEC
News |
Chart |
Request a new note
C
A
S
I |
Symbol/Exchange
Company Name
Industry Group |
PRICE |
CHANGE
(%Change) |
Day High |
Volume
(% DAV)
(% 50 day avg vol) |
52 Wk Hi
% From Hi |
Featured
Date |
Price
Featured |
Pivot Featured |
|
Max Buy |
NVEE
-
NASDAQ
N V 5 Global Inc
Comml Svcs-Consulting
|
$82.80
|
-1.85
-2.19% |
$85.90
|
80,706
109.06% of 50 DAV
50 DAV is 74,000
|
$91.55
-9.56%
|
6/15/2018
|
$7,070.00
|
PP = $72.00
|
|
MB = $75.60
|
Most Recent Note - 8/10/2018 1:09:17 PM
G - Gapped down on the prior session after pricing a new Public Offering while perched at its all-time high. Its 50 DMA line and prior highs in the $71 area define near-term support to watch on pullbacks.
>>> FEATURED STOCK ARTICLE : Holding its Ground in Tight Range Near All-Time High - 6/28/2018 |
View all notes |
Set NEW NOTE alert |
Company Profile |
SEC
News |
Chart |
Request a new note
C
A
S
I |
PANW
-
NYSE
Palo Alto Networks
Computer Sftwr-Security
|
$210.55
|
-2.07
-0.97% |
$215.24
|
1,440,882
104.03% of 50 DAV
50 DAV is 1,385,000
|
$219.38
-4.02%
|
6/12/2018
|
$206.55
|
PP = $214.69
|
|
MB = $225.42
|
Most Recent Note - 8/13/2018 7:22:45 PM
Y - Still consolidating just above its 50 DMA line ($209), and very little resistance remains up to the $219 level. Prior low ($193 on 7/30/18) defines an important near-term support level.
>>> FEATURED STOCK ARTICLE : Violated 50-day Average With Volume-driven Loss - 7/31/2018 |
View all notes |
Set NEW NOTE alert |
Company Profile |
SEC
News |
Chart |
Request a new note
C
A
S
I |
QLYS
-
NASDAQ
Qualys Inc
Computer Sftwr-Security
|
$85.50
|
-2.50
-2.84% |
$88.52
|
351,779
89.97% of 50 DAV
50 DAV is 391,000
|
$98.30
-13.02%
|
7/23/2018
|
$97.05
|
PP = $97.85
|
|
MB = $102.74
|
Most Recent Note - 8/13/2018 7:17:43 PM
G - Slumped further below its 50 DMA line ($89.42) which has acted as resistance in recent weeks after damaging volume-driven losses. A rebound above the 50 DMA line is needed for its outlook to improve.
>>> FEATURED STOCK ARTICLE : Computer Software-Security Firm Hovering Near All-Time High - 7/16/2018 |
View all notes |
Set NEW NOTE alert |
Company Profile |
SEC
News |
Chart |
Request a new note
C
A
S
I |
PAYC
-
NYSE
Paycom Software Inc
COMPUTER SOFTWARE and SERVICES - Application Software
|
$134.60
|
-1.16
-0.85% |
$136.86
|
398,731
44.06% of 50 DAV
50 DAV is 905,000
|
$136.80
-1.61%
|
8/1/2018
|
$122.87
|
PP = $118.55
|
|
MB = $124.48
|
Most Recent Note - 8/10/2018 7:48:25 PM
G - Stubbornly holding its ground, extended from prior highs in the $118 area defining initial support to watch on pullbacks. Fundamentals remain strong.
>>> FEATURED STOCK ARTICLE : Bullish Action Followed Strong Earnings News - 8/1/2018 |
View all notes |
Set NEW NOTE alert |
Company Profile |
SEC
News |
Chart |
Request a new note
C
A
S
I |
GRUB
-
NYSE
Grubhub Inc
INTERNET - Content
|
$129.92
|
-0.50
-0.38% |
$132.51
|
1,108,927
56.35% of 50 DAV
50 DAV is 1,968,000
|
$141.06
-7.90%
|
5/30/2018
|
$107.56
|
PP = $105.68
|
|
MB = $110.96
|
Most Recent Note - 8/10/2018 7:46:31 PM
G - Found support above the prior high ($120), but its has not formed a sound new base. Fundamentals remain strong. Patient investors may watch for a new base or secondary buy point to develop and be noted in the weeks ahead.
>>> FEATURED STOCK ARTICLE : Hovering Near Record High Following Considerable Rally - 8/2/2018 |
View all notes |
Set NEW NOTE alert |
Company Profile |
SEC
News |
Chart |
Request a new note
C
A
S
I |
Symbol/Exchange
Company Name
Industry Group |
PRICE |
CHANGE
(%Change) |
Day High |
Volume
(% DAV)
(% 50 day avg vol) |
52 Wk Hi
% From Hi |
Featured
Date |
Price
Featured |
Pivot Featured |
|
Max Buy |
HQY
-
NASDAQ
Healthequity Inc
COMPUTER SOFTWARE and SERVICES - Healthcare Information Service
|
$82.39
|
-0.09
-0.11% |
$83.20
|
180,041
37.74% of 50 DAV
50 DAV is 477,000
|
$83.34
-1.14%
|
8/13/2018
|
$82.39
|
PP = $83.44
|
|
MB = $87.61
|
Most Recent Note - 8/13/2018 6:44:30 PM
Y - Color code is changed to yellow while quietly consolidating above its 50 DMA line ($79.45) and perched within close striking distance of its 52-week high. It has formed an advanced ascending base and the new pivot point cited is based on its 7/23/18 high plus 10 cents. Prior low ($72.63 on 7/31/18) defines important near-term support to watch.
>>> FEATURED STOCK ARTICLE : Perched Near All-Time High After Testing Support at 50-Day Average - 7/25/2018 |
View all notes |
Set NEW NOTE alert |
Company Profile |
SEC
News |
Chart |
Request a new note
C
A
S
I |
LOB
-
NASDAQ
"Live Oak Bancshares, Inc."
Banks-Southeast
|
$29.45
|
-0.25
-0.84% |
$30.05
|
80,984
46.60% of 50 DAV
50 DAV is 173,800
|
$32.95
-10.62%
|
5/21/2018
|
$29.35
|
PP = $30.15
|
|
MB = $31.66
|
Most Recent Note - 8/13/2018 6:45:33 PM
G - A rebound above the 50 DMA line ($30.60) still is needed for its outlook to improve. The recent low and 200 DMA line ($27.51) define important near-term chart support.
>>> FEATURED STOCK ARTICLE : Bank Making Gradual Progress After Support Found at 50-Day Average - 7/11/2018 |
View all notes |
Set NEW NOTE alert |
Company Profile |
SEC
News |
Chart |
Request a new note
C
A
S
I |
PYPL
-
NASDAQ
Paypal Holdings Inc
Finance-CrdtCard/PmtPr
|
$87.01
|
+0.00
0.00% |
$88.50
|
5,977,839
78.94% of 50 DAV
50 DAV is 7,573,000
|
$92.35
-5.78%
|
7/23/2018
|
$89.24
|
PP = $87.55
|
|
MB = $91.93
|
Most Recent Note - 8/10/2018 7:50:17 PM
Y - Volume totals have been cooling while consolidating above its 50 DMA line ($85.61). Prior low defines important near-term support in the $81 area.
>>> FEATURED STOCK ARTICLE : Paypal Pulling Back From Record High - 7/26/2018 |
View all notes |
Set NEW NOTE alert |
Company Profile |
SEC
News |
Chart |
Request a new note
C
A
S
I |
OLLI
-
NASDAQ
Ollie's Bargain Outlet
Retail-DiscountandVariety
|
$72.25
|
+0.90
1.26% |
$72.48
|
391,557
43.51% of 50 DAV
50 DAV is 900,000
|
$77.50
-6.77%
|
7/12/2018
|
$74.43
|
PP = $77.60
|
|
MB = $81.48
|
Most Recent Note - 8/10/2018 7:54:53 PM
G - Still needs to rebound above its 50 DMA line ($73.09) for its outlook to improve. Fundamentals remain strong.
>>> FEATURED STOCK ARTICLE : Found Recent Support at 50-Day Moving Average Line - 7/5/2018 |
View all notes |
Set NEW NOTE alert |
Company Profile |
SEC
News |
Chart |
Request a new note
C
A
S
I |
NOVT
-
NASDAQ
Novanta Inc
Elec-Scientific/Msrng
|
$68.10
|
+0.40
0.59% |
$68.75
|
73,738
39.43% of 50 DAV
50 DAV is 187,000
|
$69.90
-2.58%
|
7/12/2018
|
$65.90
|
PP = $68.10
|
|
MB = $71.51
|
Most Recent Note - 8/13/2018 6:36:46 PM
Y - Color code is changed to yellow while quietly consolidating above its 50 DMA line ($65.50) and perched within close striking distance of its 52-week high. The prior low ($61.15 on 7/31/18) defines important near-term support where more damaging losses would raise serious concerns
>>> FEATURED STOCK ARTICLE : Gain Challenged 52-Week High and New Pivot Point - 7/12/2018 |
View all notes |
Set NEW NOTE alert |
Company Profile |
SEC
News |
Chart |
Request a new note
C
A
S
I |
Symbol/Exchange
Company Name
Industry Group |
PRICE |
CHANGE
(%Change) |
Day High |
Volume
(% DAV)
(% 50 day avg vol) |
52 Wk Hi
% From Hi |
Featured
Date |
Price
Featured |
Pivot Featured |
|
Max Buy |
BZUN
-
NASDAQ
Baozun Inc Cl A Ads
Computer Sftwr-Enterprse
|
$52.72
|
-2.59
-4.68% |
$55.16
|
4,819,341
267.00% of 50 DAV
50 DAV is 1,805,000
|
$67.41
-21.79%
|
5/15/2018
|
$45.38
|
PP = $52.43
|
|
MB = $55.05
|
Most Recent Note - 8/13/2018 7:16:28 PM
Slumped further below its 50 DMA line ($59.63) with today's big volume-driven loss intra-day also undercutting the recent low ($51.50 on 6/27/18) raising greater concerns. It will be dropped from the Featured Stocks list tonight. A rebound above the 50 DMA line is needed for its outlook to improve.
>>> FEATURED STOCK ARTICLE : Found Support Near Prior Highs and 50 Day Moving Average - 7/6/2018 |
View all notes |
Set NEW NOTE alert |
Company Profile |
SEC
News |
Chart |
Request a new note
C
A
S
I |
TEAM
-
NASDAQ
Atlassian Corp Plc Cl A
Comp Sftwr-Spec Enterprs
|
$78.23
|
+0.16
0.20% |
$79.52
|
763,939
61.66% of 50 DAV
50 DAV is 1,239,000
|
$79.82
-1.99%
|
7/27/2018
|
$73.73
|
PP = $68.85
|
|
MB = $72.29
|
Most Recent Note - 8/13/2018 7:11:19 PM
G - Posted a small gain today with light volume. It has recently wedged to new highs with gains lacking great volume conviction, and it is extended from any sound base. Fundamentals through Jun '18 have been strong.
>>> FEATURED STOCK ARTICLE : Pullback Following Recent technical Breakout - 7/30/2018 |
View all notes |
Set NEW NOTE alert |
Company Profile |
SEC
News |
Chart |
Request a new note
C
A
S
I |
SEND
-
NYSE
Sendgrid Inc
INTERNET - Content
|
$32.42
|
+0.58
1.82% |
$33.85
|
1,616,035
184.48% of 50 DAV
50 DAV is 876,000
|
$32.03
1.23%
|
8/13/2018
|
$32.20
|
PP = $32.13
|
|
MB = $33.74
|
Most Recent Note - 8/13/2018 3:28:41 PM
Y - Color code is changed to yellow with new pivot point cited based on its 3/12/18 high plus 10 cents. Hit a new 52-week high with today's 6th consecutive gain. A gain and close above the pivot point backed by at least +40% above average volume may trigger a new technical buy signal. Prior lows in the $24 area define important support. Completed a new Public Offering and Secondary Offering on 4/05/18.
>>> FEATURED STOCK ARTICLE : Volume-Driven Gains Above 50-Day Average Help Outlook Improve - 6/14/2018 |
View all notes |
Set NEW NOTE alert |
Company Profile |
SEC
News |
Chart |
Request a new note
C
A
S
I |