***Last / Change / Volume data in this table is the closing quote data***
Symbol/Exchange
Company Name
Industry Group |
PRICE |
CHANGE
(%Change) |
Day High |
Volume
(% DAV)
(% 50 day avg vol) |
52 Wk Hi
% From Hi |
Featured
Date |
Price
Featured |
Pivot Featured |
|
Max Buy |
OSBC
-
NASDAQ
Old Second Bancorp Inc
BANKING - Regional - Midwest Banks
|
$15.10
|
-0.10
-0.66% |
$15.25
|
43,141
44.02% of 50 DAV
50 DAV is 98,000
|
$16.30
-7.36%
|
5/21/2018
|
$15.50
|
PP = $15.10
|
|
MB = $15.86
|
Most Recent Note - 8/3/2018 2:40:29 PM
Y - Met stubborn resistance after hitting a new high on 7/26/18 with a big volume-driven gain. Consolidating above its 50 DMA line ($15) while the prior low ($14) and 200 DMA line define additional near-term support. Its Relative Strength Rating improved to 81, above the 80+ minimum guideline for buy candidates. Fundamentals remain strong after it reported Jun '18 quarterly earnings +71% on +23% sales revenues.
>>> FEATURED STOCK ARTICLE : Consolidating Above 50-Day Moving Average - 7/9/2018 |
View all notes |
Set NEW NOTE alert |
Company Profile |
SEC
News |
Chart |
Request a new note
C
A
S
I |
SIVB
-
NASDAQ
S V B Financial Group
BANKING - Regional - Pacific Banks
|
$316.75
|
-2.25
-0.71% |
$318.69
|
297,178
61.66% of 50 DAV
50 DAV is 482,000
|
$333.74
-5.09%
|
8/6/2018
|
$314.77
|
PP = $329.75
|
|
MB = $346.24
|
Most Recent Note - 8/6/2018 6:21:16 PM
Y - Perched near its all-time high after today's 5th consecutive gain with near average volume. Color code is changed to yellow with new pivot point cited based on its 6/11/18 high plus 10 cents. Subsequent gains above the pivot point based by at least +40% above average volume may trigger a new technical buy signal. Reported earnings +91% on +40% sales revenues for the Jun '18 quarter, continuing its strong earnings track record. The 50 DMA line and recent low ($284.42 on 7/02/18) define near-term support to watch on pullbacks.
>>> FEATURED STOCK ARTICLE : Still Sputtering Below 50-Day Moving Average - 7/10/2018 |
View all notes |
Set NEW NOTE alert |
Company Profile |
SEC
News |
Chart |
Request a new note
C
A
S
I |
ZBRA
-
NASDAQ
Zebra Tech Corp Cl A
COMPUTER HARDWARE - Computer Peripherals
|
$161.26
|
-0.68
-0.42% |
$164.44
|
306,240
70.73% of 50 DAV
50 DAV is 433,000
|
$167.61
-3.79%
|
8/7/2018
|
$164.26
|
PP = $161.82
|
|
MB = $169.91
|
Most Recent Note - 8/8/2018 1:15:24 PM
Y - Pulling back below its pivot point today following a considerable volume-driven gain on the prior session. Finished strong after highlighted in yellow with pivot point cited based on its 6/08/18 high plus 10 cents in the prior mid-day report. Triggered a technical buy signal as it gapped up today hitting a new all-time high with more than 4 times average volume, rebounding from below its 50 DMA line. Reported Jun '18 earnings +64% on +13% sales revenues. Three of the past 4 quarters showed earnings increases above the +25% minimum guideline (C criteria). Recent sequential comparisons show encouraging sales revenues acceleration. Annual earnings (A criteria) history has been strong since a downturn in FY '08 and '09. See the latest FSU analysis for more details and an annotated graph.
>>> FEATURED STOCK ARTICLE : Big Gain for New High Backed by Heavy Volume - 8/7/2018 |
View all notes |
Set NEW NOTE alert |
Company Profile |
SEC
News |
Chart |
Request a new note
C
A
S
I |
EPAM
-
NYSE
Epam Systems Inc
COMPUTER SOFTWARE and SERVICES - Information Technology Service
|
$130.27
|
+0.12
0.09% |
$130.97
|
300,759
53.90% of 50 DAV
50 DAV is 558,000
|
$137.73
-5.42%
|
7/5/2018
|
$123.70
|
PP = $131.85
|
|
MB = $138.44
|
 Most Recent Note - 8/10/2018 7:44:22 PM
Y - Finding support above its 50 DMA line ($127.81). Fundamentals remain strong. The recent low ($115) and 200 DMA line define important near term support to watch on pullbacks,
>>> FEATURED STOCK ARTICLE : Sputtering Below 50-Day Average After Negating Prior Breakout - 6/27/2018 |
View all notes |
Set NEW NOTE alert |
Company Profile |
SEC
News |
Chart |
Request a new note
C
A
S
I |
FLT
-
NYSE
Fleetcor Technologies
DIVERSIFIED SERVICES - Business/Management Services
|
$217.53
|
+1.63
0.75% |
$218.55
|
450,211
35.51% of 50 DAV
50 DAV is 1,268,000
|
$225.92
-3.71%
|
6/18/2018
|
$219.31
|
PP = $213.84
|
|
MB = $224.53
|
Most Recent Note - 8/3/2018 5:45:22 PM
Y - Loss on higher volume today tested its 50 DMA line and prior highs in the $212 area defining important near-term support. Reported earnings +29% on +8% sales revenues for the Jun '18 quarter, its 3rd consecutive quarterly comparison above the +25% minimum guideline (C criteria). See the latest FSU analysis for more details and a new annotated graph.
>>> FEATURED STOCK ARTICLE : Testing 50-Day Average With Loss on Higher Volume - 8/3/2018 |
View all notes |
Set NEW NOTE alert |
Company Profile |
SEC
News |
Chart |
Request a new note
C
A
S
I |
Symbol/Exchange
Company Name
Industry Group |
PRICE |
CHANGE
(%Change) |
Day High |
Volume
(% DAV)
(% 50 day avg vol) |
52 Wk Hi
% From Hi |
Featured
Date |
Price
Featured |
Pivot Featured |
|
Max Buy |
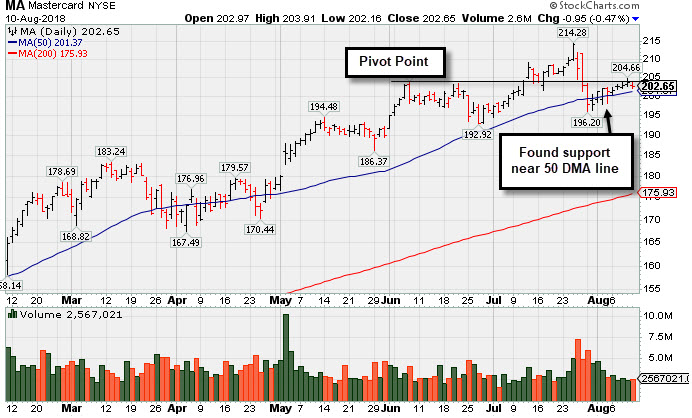
MA
-
NYSE
Mastercard Inc Cl A
Finance-CrdtCard/PmtPr
|
$202.65
|
-0.95
-0.47% |
$203.91
|
2,567,042
77.37% of 50 DAV
50 DAV is 3,318,000
|
$214.28
-5.43%
|
7/11/2018
|
$203.84
|
PP = $204.10
|
|
MB = $214.31
|
Most Recent Note - 8/10/2018 7:41:57 PM
Y - Found prompt support near its 50 DMA line ($201) following another strong earnings report. Recent lows in the $193-196 area define important near-term support to watch. See the latest FSU analysis for more details and a new annotated graph.
>>> FEATURED STOCK ARTICLE : Found Support Near 50-Day Moving Average Line - 8/10/2018 |
View all notes |
Set NEW NOTE alert |
Company Profile |
SEC
News |
Chart |
Request a new note
C
A
S
I |
V
-
NYSE
Visa Inc Cl A
Finance-CrdtCard/PmtPr
|
$139.73
|
-0.28
-0.20% |
$140.74
|
6,523,541
86.40% of 50 DAV
50 DAV is 7,550,000
|
$143.14
-2.38%
|
4/26/2018
|
$126.68
|
PP = $126.98
|
|
MB = $133.33
|
Most Recent Note - 8/3/2018 2:42:33 PM
G - Remains perched near its all-time high after recent losses tested support near the prior high in the $136 area and its 50 DMA line ($135). Reported earnings +40% on +15% sales revenues for the Jun '18 quarter.
>>> FEATURED STOCK ARTICLE : Perched Near All-Time High After Rally From 50-Day Average - 7/27/2018 |
View all notes |
Set NEW NOTE alert |
Company Profile |
SEC
News |
Chart |
Request a new note
C
A
S
I |
ENV
-
NYSE
Envestnet Inc
FINANCIAL SERVICES - Diversified Investments
|
$58.95
|
+0.00
0.00% |
$59.63
|
250,110
76.02% of 50 DAV
50 DAV is 329,000
|
$62.95
-6.35%
|
6/15/2018
|
$57.85
|
PP = $60.37
|
|
MB = $63.39
|
Most Recent Note - 8/8/2018 1:23:00 PM
Y - Reported Jun '18 earnings +41% on +20% sales revenues, continuing its strong earnings track record. Volume and volatility often increase near earnings news. Testing support near its 50 DMA line ($57.85). Encountered distributional pressure after a volume-driven gain for a new high on 7/23/18 triggered a technical buy signal. The recent low ($53.75 on 6/28/18) and 200 DMA line define important near-term support.
>>> FEATURED STOCK ARTICLE : Earnings News Due for Financial Firm Perched Near High - 8/6/2018 |
View all notes |
Set NEW NOTE alert |
Company Profile |
SEC
News |
Chart |
Request a new note
C
A
S
I |
TPL
-
NYSE
Texas Pacific Land Trust
Real Estate Dvlpmt/Ops
|
$805.00
|
-2.96
-0.37% |
$814.70
|
10,030
66.87% of 50 DAV
50 DAV is 15,000
|
$825.90
-2.53%
|
7/5/2018
|
$714.90
|
PP = $739.99
|
|
MB = $776.99
|
Most Recent Note - 8/10/2018 7:56:39 PM
G - Hovering near its all-time high, stubbornly holding its ground. The 50 DMA line ($739) and recent low ($720 on 7/30/18) define important near-term support.
>>> FEATURED STOCK ARTICLE : Volume Totals Cooling While Consolidating Above Prior High - 7/20/2018 |
View all notes |
Set NEW NOTE alert |
Company Profile |
SEC
News |
Chart |
Request a new note
C
A
S
I |
STMP
-
NASDAQ
Stamps.com Inc
Retail-Internet
|
$255.50
|
+7.40
2.98% |
$257.75
|
388,315
133.44% of 50 DAV
50 DAV is 291,000
|
$285.75
-10.58%
|
8/2/2018
|
$280.60
|
PP = $285.85
|
|
MB = $300.14
|
Most Recent Note - 8/9/2018 12:32:47 PM
G - Color code is changed to green after gapping down today slumping well below the prior low triggering a technical sell signal and nearly testing its 200 DMA line ($217)before rebounding. Recently met resistance near the prior high. A rebound above the 50 DMA line is needed for its outlook to improve. Reported Jun '18 quarterly earnings +32% on +20% sales revenues, continuing its strong earnings history.
>>> FEATURED STOCK ARTICLE : Big Loss on Heavy Volume Tests 50-Day Moving Average - 6/21/2018 |
View all notes |
Set NEW NOTE alert |
Company Profile |
SEC
News |
Chart |
Request a new note
C
A
S
I |
Symbol/Exchange
Company Name
Industry Group |
PRICE |
CHANGE
(%Change) |
Day High |
Volume
(% DAV)
(% 50 day avg vol) |
52 Wk Hi
% From Hi |
Featured
Date |
Price
Featured |
Pivot Featured |
|
Max Buy |
CHDN
-
NASDAQ
Churchill Downs Inc
LEISURE - Gaming Activities
|
$280.15
|
-1.25
-0.44% |
$282.25
|
27,492
43.64% of 50 DAV
50 DAV is 63,000
|
$314.60
-10.95%
|
6/20/2018
|
$285.80
|
PP = $314.70
|
|
MB = $330.44
|
Most Recent Note - 8/6/2018 6:16:28 PM
G - A rebound above the 50 DMA line ($297.59) is still needed for its outlook to improve. Reported +69% earnings on +12% sales revenues for the Jun '18 quarter versus the year ago period, continuing its strong earnings track record.
>>> FEATURED STOCK ARTICLE : Consolidating Near 50-Day Moving Average - 6/29/2018 |
View all notes |
Set NEW NOTE alert |
Company Profile |
SEC
News |
Chart |
Request a new note
C
A
S
I |
DPZ
-
NYSE
Dominos Pizza Inc
Retail-Restaurants
|
$291.31
|
-0.14
-0.05% |
$293.69
|
455,286
69.51% of 50 DAV
50 DAV is 655,000
|
$295.24
-1.33%
|
5/21/2018
|
$248.13
|
PP = $255.10
|
|
MB = $267.86
|
Most Recent Note - 8/7/2018 3:35:11 PM
Y - Color code is changed to yellow as its rebound above its 50 DMA line ($273) with recent gains helped its outlook to improve. Faces some near-term resistance up to the $293 level.
>>> FEATURED STOCK ARTICLE : Consolidating Near 50-Day Moving Average Line - 7/23/2018 |
View all notes |
Set NEW NOTE alert |
Company Profile |
SEC
News |
Chart |
Request a new note
C
A
S
I |
FIVE
-
NASDAQ
Five Below Inc
Retail-DiscountandVariety
|
$105.93
|
+1.69
1.62% |
$106.47
|
491,966
37.13% of 50 DAV
50 DAV is 1,325,000
|
$109.09
-2.90%
|
7/6/2018
|
$98.90
|
PP = $104.09
|
|
MB = $109.29
|
Most Recent Note - 8/7/2018 3:38:31 PM
Y - Rebounding near its prior high with a streak of 4 consecutive gains marked by light volume. Its 50 DMA line ($96.55) and recent lows define important near-term support to watch on pullbacks. Gains above the pivot point must have a minimum of +40% above average volume to trigger a proper technical buy signal.
>>> FEATURED STOCK ARTICLE : Hovering Near Record High After Big Gap Up and Volume-Driven Gain - 6/25/2018 |
View all notes |
Set NEW NOTE alert |
Company Profile |
SEC
News |
Chart |
Request a new note
C
A
S
I |
NOW
-
NYSE
Servicenow Inc
Computer Sftwr-Enterprse
|
$187.47
|
-0.87
-0.46% |
$190.00
|
829,647
48.01% of 50 DAV
50 DAV is 1,728,000
|
$194.81
-3.77%
|
5/8/2018
|
$174.63
|
PP = $176.66
|
|
MB = $185.49
|
Most Recent Note - 8/10/2018 7:53:16 PM
Y - Volume totals have been cooling while consolidating above its 50 DMA line ($183). The recent low ($174) defines the next important near-term support. Fundamentals remain strong.
>>> FEATURED STOCK ARTICLE : Recent Slump Below 50-Day Average Hurt Outlook - 6/26/2018 |
View all notes |
Set NEW NOTE alert |
Company Profile |
SEC
News |
Chart |
Request a new note
C
A
S
I |
NVEE
-
NASDAQ
N V 5 Global Inc
Comml Svcs-Consulting
|
$84.65
|
+1.65
1.99% |
$85.00
|
133,971
183.52% of 50 DAV
50 DAV is 73,000
|
$91.55
-7.54%
|
6/15/2018
|
$7,070.00
|
PP = $72.00
|
|
MB = $75.60
|
Most Recent Note - 8/10/2018 1:09:17 PM
G - Gapped down on the prior session after pricing a new Public Offering while perched at its all-time high. Its 50 DMA line and prior highs in the $71 area define near-term support to watch on pullbacks.
>>> FEATURED STOCK ARTICLE : Holding its Ground in Tight Range Near All-Time High - 6/28/2018 |
View all notes |
Set NEW NOTE alert |
Company Profile |
SEC
News |
Chart |
Request a new note
C
A
S
I |
Symbol/Exchange
Company Name
Industry Group |
PRICE |
CHANGE
(%Change) |
Day High |
Volume
(% DAV)
(% 50 day avg vol) |
52 Wk Hi
% From Hi |
Featured
Date |
Price
Featured |
Pivot Featured |
|
Max Buy |
PANW
-
NYSE
Palo Alto Networks
Computer Sftwr-Security
|
$212.62
|
-0.48
-0.23% |
$214.88
|
1,386,650
99.90% of 50 DAV
50 DAV is 1,388,000
|
$219.38
-3.08%
|
6/12/2018
|
$206.55
|
PP = $214.69
|
|
MB = $225.42
|
Most Recent Note - 8/7/2018 3:40:50 PM
Y - Rebound above the 50 DMA line ($209) helped its outlook to improve and its color code is changed to yellow. Very little resistance remains up to the $219 level.
>>> FEATURED STOCK ARTICLE : Violated 50-day Average With Volume-driven Loss - 7/31/2018 |
View all notes |
Set NEW NOTE alert |
Company Profile |
SEC
News |
Chart |
Request a new note
C
A
S
I |
QLYS
-
NASDAQ
Qualys Inc
Computer Sftwr-Security
|
$88.00
|
-0.45
-0.51% |
$88.75
|
293,146
74.97% of 50 DAV
50 DAV is 391,000
|
$98.30
-10.48%
|
7/23/2018
|
$97.05
|
PP = $97.85
|
|
MB = $102.74
|
Most Recent Note - 8/7/2018 7:50:08 PM
G - Still sputtering below its 50 DMA line ($88.61) which may act as resistance after damaging volume-driven losses. A rebound above the 50 DMA line is needed for its outlook to improve.
>>> FEATURED STOCK ARTICLE : Computer Software-Security Firm Hovering Near All-Time High - 7/16/2018 |
View all notes |
Set NEW NOTE alert |
Company Profile |
SEC
News |
Chart |
Request a new note
C
A
S
I |
PAYC
-
NYSE
Paycom Software Inc
COMPUTER SOFTWARE and SERVICES - Application Software
|
$135.76
|
+1.91
1.43% |
$136.13
|
639,092
70.62% of 50 DAV
50 DAV is 905,000
|
$136.80
-0.76%
|
8/1/2018
|
$122.87
|
PP = $118.55
|
|
MB = $124.48
|
Most Recent Note - 8/10/2018 7:48:25 PM
G - Stubbornly holding its ground, extended from prior highs in the $118 area defining initial support to watch on pullbacks. Fundamentals remain strong.
>>> FEATURED STOCK ARTICLE : Bullish Action Followed Strong Earnings News - 8/1/2018 |
View all notes |
Set NEW NOTE alert |
Company Profile |
SEC
News |
Chart |
Request a new note
C
A
S
I |
GRUB
-
NYSE
Grubhub Inc
INTERNET - Content
|
$130.42
|
-0.02
-0.02% |
$130.74
|
754,143
37.82% of 50 DAV
50 DAV is 1,994,000
|
$141.06
-7.54%
|
5/30/2018
|
$107.56
|
PP = $105.68
|
|
MB = $110.96
|
Most Recent Note - 8/10/2018 7:46:31 PM
G - Found support above the prior high ($120), but its has not formed a sound new base. Fundamentals remain strong. Patient investors may watch for a new base or secondary buy point to develop and be noted in the weeks ahead.
>>> FEATURED STOCK ARTICLE : Hovering Near Record High Following Considerable Rally - 8/2/2018 |
View all notes |
Set NEW NOTE alert |
Company Profile |
SEC
News |
Chart |
Request a new note
C
A
S
I |
HQY
-
NASDAQ
Healthequity Inc
COMPUTER SOFTWARE and SERVICES - Healthcare Information Service
|
$82.48
|
+0.37
0.45% |
$83.29
|
241,103
49.20% of 50 DAV
50 DAV is 490,000
|
$83.34
-1.03%
|
5/2/2018
|
$66.31
|
PP = $68.85
|
|
MB = $72.29
|
Most Recent Note - 8/3/2018 2:35:57 PM
G - Meeting resistance and reversing into the red today while trying to rebound above its 50 DMA line ($78.81). Prior lows ($70.16 on 6/28/18) define important near-term support to watch.
>>> FEATURED STOCK ARTICLE : Perched Near All-Time High After Testing Support at 50-Day Average - 7/25/2018 |
View all notes |
Set NEW NOTE alert |
Company Profile |
SEC
News |
Chart |
Request a new note
C
A
S
I |
Symbol/Exchange
Company Name
Industry Group |
PRICE |
CHANGE
(%Change) |
Day High |
Volume
(% DAV)
(% 50 day avg vol) |
52 Wk Hi
% From Hi |
Featured
Date |
Price
Featured |
Pivot Featured |
|
Max Buy |
LOB
-
NASDAQ
Live Oak Bancshares Inc
Banks-Southeast
|
$29.70
|
-0.15
-0.50% |
$29.90
|
81,140
46.90% of 50 DAV
50 DAV is 173,000
|
$32.95
-9.86%
|
5/21/2018
|
$29.35
|
PP = $30.15
|
|
MB = $31.66
|
Most Recent Note - 8/3/2018 2:37:53 PM
G - The recent low and 200 DMA line ($27.33) define important near-term chart support. A rebound above the 50 DMA line ($30.60) still is needed for its outlook to improve.
>>> FEATURED STOCK ARTICLE : Bank Making Gradual Progress After Support Found at 50-Day Average - 7/11/2018 |
View all notes |
Set NEW NOTE alert |
Company Profile |
SEC
News |
Chart |
Request a new note
C
A
S
I |
PYPL
-
NASDAQ
Paypal Holdings Inc
Finance-CrdtCard/PmtPr
|
$87.01
|
-0.16
-0.18% |
$88.03
|
5,795,667
76.03% of 50 DAV
50 DAV is 7,623,000
|
$92.35
-5.78%
|
7/23/2018
|
$89.24
|
PP = $87.55
|
|
MB = $91.93
|
Most Recent Note - 8/10/2018 7:50:17 PM
Y - Volume totals have been cooling while consolidating above its 50 DMA line ($85.61). Prior low defines important near-term support in the $81 area.
>>> FEATURED STOCK ARTICLE : Paypal Pulling Back From Record High - 7/26/2018 |
View all notes |
Set NEW NOTE alert |
Company Profile |
SEC
News |
Chart |
Request a new note
C
A
S
I |
OLLI
-
NASDAQ
Ollie's Bargain Outlet
Retail-DiscountandVariety
|
$71.35
|
-0.45
-0.63% |
$72.53
|
442,808
49.26% of 50 DAV
50 DAV is 899,000
|
$77.50
-7.94%
|
7/12/2018
|
$74.43
|
PP = $77.60
|
|
MB = $81.48
|
Most Recent Note - 8/10/2018 7:54:53 PM
G - Still needs to rebound above its 50 DMA line ($73.09) for its outlook to improve. Fundamentals remain strong.
>>> FEATURED STOCK ARTICLE : Found Recent Support at 50-Day Moving Average Line - 7/5/2018 |
View all notes |
Set NEW NOTE alert |
Company Profile |
SEC
News |
Chart |
Request a new note
C
A
S
I |
NOVT
-
NASDAQ
Novanta Inc
Elec-Scientific/Msrng
|
$67.70
|
+1.25
1.88% |
$67.80
|
98,316
51.21% of 50 DAV
50 DAV is 192,000
|
$69.90
-3.15%
|
7/12/2018
|
$65.90
|
PP = $68.10
|
|
MB = $71.51
|
Most Recent Note - 8/3/2018 2:48:58 PM
G - Sputtering near its 50 DMA line ($65.06) after finding support above its prior low ($59.25 on 6/25/18). More damaging losses would raise serious concerns
>>> FEATURED STOCK ARTICLE : Gain Challenged 52-Week High and New Pivot Point - 7/12/2018 |
View all notes |
Set NEW NOTE alert |
Company Profile |
SEC
News |
Chart |
Request a new note
C
A
S
I |
BZUN
-
NASDAQ
Baozun Inc Cl A Ads
Computer Sftwr-Enterprse
|
$55.31
|
-1.22
-2.16% |
$56.25
|
1,592,138
87.34% of 50 DAV
50 DAV is 1,823,000
|
$67.41
-17.95%
|
5/15/2018
|
$45.38
|
PP = $52.43
|
|
MB = $55.05
|
Most Recent Note - 8/7/2018 3:42:53 PM
G - Still sputtering below its 50 DMA line ($60.01). The recent low ($51.50 on 6/27/18) defines the next important chart support.
>>> FEATURED STOCK ARTICLE : Found Support Near Prior Highs and 50 Day Moving Average - 7/6/2018 |
View all notes |
Set NEW NOTE alert |
Company Profile |
SEC
News |
Chart |
Request a new note
C
A
S
I |
Symbol/Exchange
Company Name
Industry Group |
PRICE |
CHANGE
(%Change) |
Day High |
Volume
(% DAV)
(% 50 day avg vol) |
52 Wk Hi
% From Hi |
Featured
Date |
Price
Featured |
Pivot Featured |
|
Max Buy |
TEAM
-
NASDAQ
Atlassian Corp Plc Cl A
Comp Sftwr-Spec Enterprs
|
$78.07
|
-0.24
-0.31% |
$78.70
|
865,379
69.17% of 50 DAV
50 DAV is 1,251,000
|
$79.82
-2.19%
|
7/27/2018
|
$73.73
|
PP = $68.85
|
|
MB = $72.29
|
Most Recent Note - 8/6/2018 6:25:14 PM
G - Posted a gain today with +20% above average volume for a best-ever close, rising above its "max buy" level, and its color code is changed to green. It was highlighted in yellow with pivot point cited based on its 6/06/18 high plus 10 cents. This Australia - based software developer reported earnings +44% on +40% sales revenues for the Jun '18 quarter helping it better match with the fact-based investment system's guidelines.
>>> FEATURED STOCK ARTICLE : Pullback Following Recent technical Breakout - 7/30/2018 |
View all notes |
Set NEW NOTE alert |
Company Profile |
SEC
News |
Chart |
Request a new note
C
A
S
I |