***Last / Change / Volume data in this table is the closing quote data***
Symbol/Exchange
Company Name
Industry Group |
PRICE |
CHANGE
(%Change) |
Day High |
Volume
(% DAV)
(% 50 day avg vol) |
52 Wk Hi
% From Hi |
Featured
Date |
Price
Featured |
Pivot Featured |
|
Max Buy |
OSBC
-
NASDAQ
Old Second Bancorp Inc
BANKING - Regional - Midwest Banks
|
$15.50
|
+0.00
0.00% |
$15.70
|
52,590
53.12% of 50 DAV
50 DAV is 99,000
|
$16.30
-4.91%
|
5/21/2018
|
$15.50
|
PP = $15.10
|
|
MB = $15.86
|
Most Recent Note - 7/27/2018 1:02:51 PM
Y - Met resistance after hitting a new high on the prior session with a big volume-driven gain. Consolidating above its 50 DMA line ($15) while the prior low ($14) and 200 DMA line define additional near-term support. Its Relative Strength Rating is at 79, just below the 80+ minimum guideline for buy candidates. Reported Jun '18 quarterly earnings +71% on +23% sales revenues, continuing its strong earnings track record. Volume and volatility often increase near earnings news.
>>> FEATURED STOCK ARTICLE : Consolidating Above 50-Day Moving Average - 7/9/2018 |
View all notes |
Set NEW NOTE alert |
Company Profile |
SEC
News |
Chart |
Request a new note
C
A
S
I |
PFBC
-
NASDAQ
Preferred Bank Los Angls
BANKING - Regional - Pacific Banks
|
$62.99
|
+0.75
1.21% |
$63.31
|
100,162
50.74% of 50 DAV
50 DAV is 197,400
|
$69.48
-9.34%
|
5/18/2018
|
$62.91
|
PP = $67.75
|
|
MB = $71.14
|
 Most Recent Note - 8/1/2018 4:37:15 PM
Undercut its 200 DMA line raising concerns. Relative Strength Rating is now 50, remaining below the 80+ minimum guideline for buy candidates. It is just -9.3% off its all-time high. It will be dropped from the Featured Stocks list tonight.
>>> FEATURED STOCK ARTICLE : Volume-Driven Gains Hit New All-Time High - 7/3/2018 |
View all notes |
Set NEW NOTE alert |
Company Profile |
SEC
News |
Chart |
Request a new note
C
A
S
I |
SIVB
-
NASDAQ
S V B Financial Group
BANKING - Regional - Pacific Banks
|
$313.54
|
+5.66
1.84% |
$315.88
|
494,846
99.77% of 50 DAV
50 DAV is 496,000
|
$333.74
-6.05%
|
3/12/2018
|
$267.79
|
PP = $263.19
|
|
MB = $276.35
|
Most Recent Note - 7/30/2018 6:48:05 PM
G - Reversed from its high on the prior session and violated its 50 DMA line today with a big volume-driven loss raising concerns. Reported earnings +91% on +40% sales revenues for the Jun '18 quarter, continuing its strong earnings track record. The recent low ($284.42 on 7/02/18) defines the next important near-term support to watch on pullbacks.
>>> FEATURED STOCK ARTICLE : Still Sputtering Below 50-Day Moving Average - 7/10/2018 |
View all notes |
Set NEW NOTE alert |
Company Profile |
SEC
News |
Chart |
Request a new note
C
A
S
I |
UCFC
-
NASDAQ
United Community Finl Cp
BANKING - Savings and Loans
|
$10.44
|
-0.01
-0.10% |
$10.50
|
181,955
85.83% of 50 DAV
50 DAV is 212,000
|
$11.98
-12.85%
|
5/30/2018
|
$10.50
|
PP = $10.80
|
|
MB = $11.34
|
Most Recent Note - 8/1/2018 4:33:54 PM
G - Slumped below its 50 DMA line and below the prior high ($10.70 on 4/19/18) with a streak of 10 consecutive losses and its color code is changed to green. Recently reported earnings +19% on +6% sales revenues for the Jun '18 quarter, below the +25% minimum earnings guideline (C criteria).
>>> FEATURED STOCK ARTICLE : Consolidating Above 50-Day Average and Prior Highs - 7/17/2018 |
View all notes |
Set NEW NOTE alert |
Company Profile |
SEC
News |
Chart |
Request a new note
C
A
S
I |
EPAM
-
NYSE
Epam Systems Inc
COMPUTER SOFTWARE and SERVICES - Information Technology Service
|
$131.53
|
+1.32
1.01% |
$131.98
|
408,914
84.66% of 50 DAV
50 DAV is 483,000
|
$137.73
-4.50%
|
7/5/2018
|
$123.70
|
PP = $131.85
|
|
MB = $138.44
|
Most Recent Note - 7/31/2018 2:44:44 PM
Y - Slumped below prior highs and back into the prior base after recent gains above the pivot point lacked the +40% above average volume needed to trigger a proper new (or add-on) technical buy signal. Its 50 DMA line ($126.89) defines near-term support above the recent low ($118.34 on 6/25/18).
>>> FEATURED STOCK ARTICLE : Sputtering Below 50-Day Average After Negating Prior Breakout - 6/27/2018 |
View all notes |
Set NEW NOTE alert |
Company Profile |
SEC
News |
Chart |
Request a new note
C
A
S
I |
Symbol/Exchange
Company Name
Industry Group |
PRICE |
CHANGE
(%Change) |
Day High |
Volume
(% DAV)
(% 50 day avg vol) |
52 Wk Hi
% From Hi |
Featured
Date |
Price
Featured |
Pivot Featured |
|
Max Buy |
FLT
-
NYSE
Fleetcor Technologies
DIVERSIFIED SERVICES - Business/Management Services
|
$218.23
|
+1.23
0.57% |
$218.86
|
860,027
67.45% of 50 DAV
50 DAV is 1,275,000
|
$225.92
-3.40%
|
6/18/2018
|
$219.31
|
PP = $213.84
|
|
MB = $224.53
|
Most Recent Note - 7/27/2018 11:25:24 AM
Y - Recently wedged to a new 52-week high with a streak of 7 consecutive gains backed by light volume. Its 50 DMA line and prior highs in the $212 area define important near-term support. Due to report earnings news on 8/02/18.
>>> FEATURED STOCK ARTICLE : Breakaway Gap With Heavy Volume - 6/18/2018 |
View all notes |
Set NEW NOTE alert |
Company Profile |
SEC
News |
Chart |
Request a new note
C
A
S
I |
MA
-
NYSE
Mastercard Inc Cl A
Finance-CrdtCard/PmtPr
|
$201.20
|
+3.20
1.62% |
$201.36
|
4,595,381
139.42% of 50 DAV
50 DAV is 3,296,000
|
$214.28
-6.10%
|
7/11/2018
|
$203.84
|
PP = $204.10
|
|
MB = $214.31
|
Most Recent Note - 7/26/2018 12:58:56 PM
Y - Reported earnings +51% on +20% sales revenues for the Jun '18 quarter. Gapped down today, retreating from a new all-time high. Its 50 DMA line ($199) and recent low ($193.16 on 6/27/18) define important near-term support to watch.
>>> FEATURED STOCK ARTICLE : Extended From Prior Base and Perched at All-Time High - 6/20/2018 |
View all notes |
Set NEW NOTE alert |
Company Profile |
SEC
News |
Chart |
Request a new note
C
A
S
I |
V
-
NYSE
Visa Inc Cl A
Finance-CrdtCard/PmtPr
|
$138.25
|
+1.51
1.10% |
$138.74
|
7,086,155
93.08% of 50 DAV
50 DAV is 7,613,000
|
$143.14
-3.42%
|
4/26/2018
|
$126.68
|
PP = $126.98
|
|
MB = $133.33
|
Most Recent Note - 7/27/2018 5:16:51 PM
G - Extended from any sound base, stubbornly holding its ground perched at its all-time high. Reported earnings +40% on +15% sales revenues for the Jun '18 quarter. The prior high in the $136 area and its 50 DMA line ($135) define near term support. See the latest FSU analysis for more details and a new annotated graph.
>>> FEATURED STOCK ARTICLE : Perched Near All-Time High After Rally From 50-Day Average - 7/27/2018 |
View all notes |
Set NEW NOTE alert |
Company Profile |
SEC
News |
Chart |
Request a new note
C
A
S
I |
ENV
-
NYSE
Envestnet Inc
FINANCIAL SERVICES - Diversified Investments
|
$59.20
|
+0.60
1.02% |
$59.70
|
181,237
47.32% of 50 DAV
50 DAV is 383,000
|
$62.95
-5.96%
|
6/15/2018
|
$57.85
|
PP = $60.37
|
|
MB = $63.39
|
Most Recent Note - 7/31/2018 2:41:38 PM
Y - Managed a "positive reversal" today after testing support near its 50 DMA line ($57.19). Encountered distributional pressure after a volume-driven gain for a new high on 7/23/18 triggered a technical buy signal. The recent low ($53.75 on 6/28/18) and 200 DMA line define important near-term support.
>>> FEATURED STOCK ARTICLE : Gain With Above Average Volume Challenged Prior High - 6/19/2018 |
View all notes |
Set NEW NOTE alert |
Company Profile |
SEC
News |
Chart |
Request a new note
C
A
S
I |
TPL
-
NYSE
Texas Pacific Land Trust
Real Estate Dvlpmt/Ops
|
$791.00
|
+50.92
6.88% |
$800.00
|
28,577
190.51% of 50 DAV
50 DAV is 15,000
|
$816.28
-3.10%
|
7/5/2018
|
$714.90
|
PP = $739.99
|
|
MB = $776.99
|
Most Recent Note - 8/1/2018 1:15:00 PM
G - Gapped up and today's big gain has it perched within striking distance of its all-time high. Color code is changed to green after rising back above its "max buy" level. Found support above its 50 DMA line ($723) during the recent consolidation.
>>> FEATURED STOCK ARTICLE : Volume Totals Cooling While Consolidating Above Prior High - 7/20/2018 |
View all notes |
Set NEW NOTE alert |
Company Profile |
SEC
News |
Chart |
Request a new note
C
A
S
I |
Symbol/Exchange
Company Name
Industry Group |
PRICE |
CHANGE
(%Change) |
Day High |
Volume
(% DAV)
(% 50 day avg vol) |
52 Wk Hi
% From Hi |
Featured
Date |
Price
Featured |
Pivot Featured |
|
Max Buy |
STMP
-
NASDAQ
Stamps.com Inc
Retail-Internet
|
$258.30
|
-2.70
-1.03% |
$263.35
|
375,592
155.20% of 50 DAV
50 DAV is 242,000
|
$285.75
-9.60%
|
5/4/2018
|
$234.15
|
PP = $233.23
|
|
MB = $244.89
|
Most Recent Note - 8/1/2018 4:43:27 PM
G - Recently slumped below its 50 DMA line ($264) raising concerns. Reported Jun '18 quarterly earnings news after the close, and volume and volatility often increase near earnings news. The prior low ($241.55 on 6/25/18) defines the next near-term support to watch. .
>>> FEATURED STOCK ARTICLE : Big Loss on Heavy Volume Tests 50-Day Moving Average - 6/21/2018 |
View all notes |
Set NEW NOTE alert |
Company Profile |
SEC
News |
Chart |
Request a new note
C
A
S
I |
CHDN
-
NASDAQ
Churchill Downs Inc
LEISURE - Gaming Activities
|
$277.90
|
-8.05
-2.82% |
$294.00
|
87,147
128.16% of 50 DAV
50 DAV is 68,000
|
$314.60
-11.67%
|
6/20/2018
|
$285.80
|
PP = $314.70
|
|
MB = $330.44
|
Most Recent Note - 7/30/2018 6:27:39 PM
G - Slumped below its 50 DMA line ($300).and below the prior low ($285.50 on 6/28/18) with losses last week raising concerns and triggering technical sell signals. Color code is changed to green. A rebound above the 50 DMA line is needed for its outlook to improve. Due to report earnings news after the close on Wednesday, 8/01/18. Volume and volatility often increase near earnings news.
>>> FEATURED STOCK ARTICLE : Consolidating Near 50-Day Moving Average - 6/29/2018 |
View all notes |
Set NEW NOTE alert |
Company Profile |
SEC
News |
Chart |
Request a new note
C
A
S
I |
DPZ
-
NYSE
Dominos Pizza Inc
Retail-Restaurants
|
$270.34
|
+7.68
2.92% |
$270.74
|
986,612
156.36% of 50 DAV
50 DAV is 631,000
|
$293.81
-7.99%
|
5/21/2018
|
$248.13
|
PP = $255.10
|
|
MB = $267.86
|
Most Recent Note - 7/31/2018 2:39:04 PM
G - Managed a "positive reversal" after today's early loss. Slumped well below its 50 DMA line ($270) in the past week, and needs a rebound above the 50 DMA line for its outlook to improve.
>>> FEATURED STOCK ARTICLE : Consolidating Near 50-Day Moving Average Line - 7/23/2018 |
View all notes |
Set NEW NOTE alert |
Company Profile |
SEC
News |
Chart |
Request a new note
C
A
S
I |
FIVE
-
NASDAQ
Five Below Inc
Retail-DiscountandVariety
|
$97.14
|
-0.02
-0.02% |
$97.66
|
691,085
50.41% of 50 DAV
50 DAV is 1,371,000
|
$109.09
-10.95%
|
7/6/2018
|
$98.90
|
PP = $104.09
|
|
MB = $109.29
|
Most Recent Note - 7/31/2018 2:46:51 PM
Y - Quietly consolidating above its 50 DMA line ($93.77). Stalled after recent gains above the pivot point lacked the minimum +40% above average volume necessary to trigger a proper technical buy signal.
>>> FEATURED STOCK ARTICLE : Hovering Near Record High After Big Gap Up and Volume-Driven Gain - 6/25/2018 |
View all notes |
Set NEW NOTE alert |
Company Profile |
SEC
News |
Chart |
Request a new note
C
A
S
I |
NOW
-
NYSE
Servicenow Inc
Computer Sftwr-Enterprse
|
$177.94
|
+1.98
1.13% |
$180.62
|
1,962,799
112.68% of 50 DAV
50 DAV is 1,742,000
|
$194.81
-8.66%
|
5/8/2018
|
$174.63
|
PP = $176.66
|
|
MB = $185.49
|
Most Recent Note - 7/27/2018 12:55:39 PM
G - Abruptly retreating near its 50 DMA line ($181.35) with today's big loss. The recent low ($167) defines the next important near-term support. Reported earnings +123% on +41% sales revenues, continuing its strong earnings history.
>>> FEATURED STOCK ARTICLE : Recent Slump Below 50-Day Average Hurt Outlook - 6/26/2018 |
View all notes |
Set NEW NOTE alert |
Company Profile |
SEC
News |
Chart |
Request a new note
C
A
S
I |
Symbol/Exchange
Company Name
Industry Group |
PRICE |
CHANGE
(%Change) |
Day High |
Volume
(% DAV)
(% 50 day avg vol) |
52 Wk Hi
% From Hi |
Featured
Date |
Price
Featured |
Pivot Featured |
|
Max Buy |
NVEE
-
NASDAQ
N V 5 Global Inc
Comml Svcs-Consulting
|
$76.00
|
+0.70
0.93% |
$76.10
|
68,320
119.86% of 50 DAV
50 DAV is 57,000
|
$77.00
-1.30%
|
6/15/2018
|
$7,070.00
|
PP = $72.00
|
|
MB = $75.60
|
Most Recent Note - 7/27/2018 11:37:28 AM
Y - Wedged to a new all-time high, approaching its "max buy" level with gains lacking great volume conviction. Confirming gains above the pivot point backed by at least +40% above average volume are required to trigger a proper technical buy signal. Its 50 DMA line ($67.96) defines near-term support above the prior low ($56.65 on 5/15/18).
>>> FEATURED STOCK ARTICLE : Holding its Ground in Tight Range Near All-Time High - 6/28/2018 |
View all notes |
Set NEW NOTE alert |
Company Profile |
SEC
News |
Chart |
Request a new note
C
A
S
I |
PANW
-
NYSE
Palo Alto Networks
Computer Sftwr-Security
|
$200.18
|
+1.92
0.97% |
$201.71
|
970,207
69.65% of 50 DAV
50 DAV is 1,393,000
|
$219.38
-8.75%
|
6/12/2018
|
$206.55
|
PP = $214.69
|
|
MB = $225.42
|
Most Recent Note - 7/31/2018 6:20:40 PM
G - Violated its 50 DMA line ($208) with a damaging volume-driven loss on the prior session also undercutting the prior low ($199.22 on 6/28/18) triggering technical sell signals. Color code was changed to green. A prompt rebound above the 50 DMA line is needed for its outlook to improve. See the latest FSU analysis for more details and a new annotated graph.
>>> FEATURED STOCK ARTICLE : Violated 50-day Average With Volume-driven Loss - 7/31/2018 |
View all notes |
Set NEW NOTE alert |
Company Profile |
SEC
News |
Chart |
Request a new note
C
A
S
I |
QLYS
-
NASDAQ
Qualys Inc
Computer Sftwr-Security
|
$85.05
|
-2.05
-2.35% |
$93.05
|
880,144
240.48% of 50 DAV
50 DAV is 366,000
|
$98.30
-13.48%
|
7/23/2018
|
$97.05
|
PP = $97.85
|
|
MB = $102.74
|
Most Recent Note - 8/1/2018 1:06:41 PM
G - Color code is changed to green while slumping below its 50 DMA line ($87.59) and raising concerns with today's 5th consecutive volume-driven loss. A prompt rebound above the 50 DMA line is needed for its outlook to improve.
>>> FEATURED STOCK ARTICLE : Computer Software-Security Firm Hovering Near All-Time High - 7/16/2018 |
View all notes |
Set NEW NOTE alert |
Company Profile |
SEC
News |
Chart |
Request a new note
C
A
S
I |
SUPN
-
NASDAQ
Supernus Pharmaceuticals
Medical-Biomed/Biotech
|
$53.30
|
+0.35
0.66% |
$54.75
|
551,998
76.35% of 50 DAV
50 DAV is 723,000
|
$61.25
-12.98%
|
6/20/2018
|
$58.05
|
PP = $59.15
|
|
MB = $62.11
|
Most Recent Note - 7/31/2018 2:48:49 PM
G - Recently met resistance at its 50 DMA line ($54.98), and subsequent gains above that short-term average are needed for its outlook to improve. Deterioration below the recent low ($49.75 on 7/09/18) would raise more serious concerns.
>>> FEATURED STOCK ARTICLE : Met Resistance at 50-Day Moving Average - 7/24/2018 |
View all notes |
Set NEW NOTE alert |
Company Profile |
SEC
News |
Chart |
Request a new note
C
A
S
I |
PAYC
-
NYSE
Paycom Software Inc
COMPUTER SOFTWARE and SERVICES - Application Software
|
$125.94
|
+19.69
18.53% |
$128.00
|
4,366,632
567.83% of 50 DAV
50 DAV is 769,000
|
$118.45
6.32%
|
8/1/2018
|
$122.87
|
PP = $118.55
|
|
MB = $124.48
|
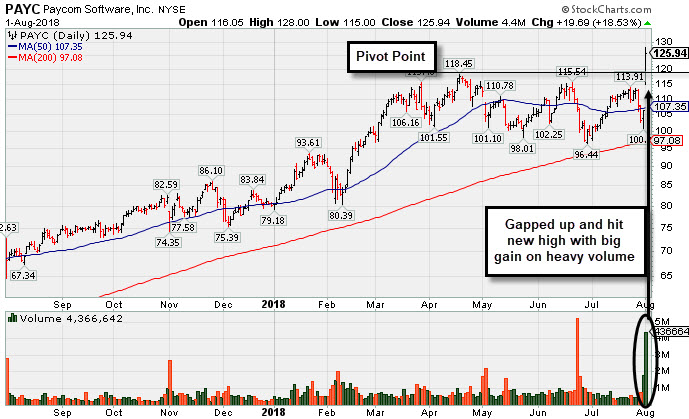
Most Recent Note - 8/1/2018 5:32:27 PM
Y - Finished strong after highlighted in yellow with new pivot point cited based on its 4/18/18 high plus 10 cents. Reported earnings +69% on +31% sales revenues for the Jun '18 quarter, continuing its strong earnings track record. Gapped up today hitting a new all-time high with a considerable volume-driven gain. See the latest FSU analysis for more details and a new annotated graph.
>>> FEATURED STOCK ARTICLE : Bullish Action Followed Strong Earnings News - 8/1/2018 |
View all notes |
Set NEW NOTE alert |
Company Profile |
SEC
News |
Chart |
Request a new note
C
A
S
I |
Symbol/Exchange
Company Name
Industry Group |
PRICE |
CHANGE
(%Change) |
Day High |
Volume
(% DAV)
(% 50 day avg vol) |
52 Wk Hi
% From Hi |
Featured
Date |
Price
Featured |
Pivot Featured |
|
Max Buy |
GRUB
-
NYSE
Grubhub Inc
INTERNET - Content
|
$125.00
|
+3.11
2.55% |
$126.64
|
1,799,233
92.17% of 50 DAV
50 DAV is 1,952,000
|
$141.06
-11.39%
|
5/30/2018
|
$107.56
|
PP = $105.68
|
|
MB = $110.96
|
Most Recent Note - 7/30/2018 6:45:56 PM
G - Suffered a large loss today retreating toward the prior high ($120). Fundamentals remain strong. Patient investors may watch for a new base or secondary buy point to develop and be noted in the weeks ahead.
>>> FEATURED STOCK ARTICLE : Gain With +25% Above Average Volume for Best Ever Close - 6/12/2018 |
View all notes |
Set NEW NOTE alert |
Company Profile |
SEC
News |
Chart |
Request a new note
C
A
S
I |
HQY
-
NASDAQ
Healthequity Inc
COMPUTER SOFTWARE and SERVICES - Healthcare Information Service
|
$77.12
|
+1.62
2.15% |
$77.89
|
268,416
51.72% of 50 DAV
50 DAV is 519,000
|
$83.34
-7.46%
|
5/2/2018
|
$66.31
|
PP = $68.85
|
|
MB = $72.29
|
Most Recent Note - 7/27/2018 11:46:26 AM
G - Retesting near its 50 DMA line ($78.61) with today's big loss. More damaging losses may raise concerns and trigger a technical sell signal. Prior low ($70.16 on 6/28/18) defines the next important support level.
>>> FEATURED STOCK ARTICLE : Perched Near All-Time High After Testing Support at 50-Day Average - 7/25/2018 |
View all notes |
Set NEW NOTE alert |
Company Profile |
SEC
News |
Chart |
Request a new note
C
A
S
I |
LOB
-
NASDAQ
"Live Oak Bancshares, Inc."
Banks-Southeast
|
$29.10
|
+0.65
2.28% |
$29.15
|
133,805
80.36% of 50 DAV
50 DAV is 166,500
|
$32.95
-11.68%
|
5/21/2018
|
$29.35
|
PP = $30.15
|
|
MB = $31.66
|
Most Recent Note - 7/27/2018 12:44:43 PM
G - Violated its 50 DMA line ($30.64) and also the prior low ($29.05 on 6/15/18) with damaging volume-driven losses triggering technical sell signals. The 200 DMA line ($27.20) defines the next important chart support. A rebound above the 50 DMA line is needed for its outlook to improve.
>>> FEATURED STOCK ARTICLE : Bank Making Gradual Progress After Support Found at 50-Day Average - 7/11/2018 |
View all notes |
Set NEW NOTE alert |
Company Profile |
SEC
News |
Chart |
Request a new note
C
A
S
I |
PYPL
-
NASDAQ
Paypal Holdings Inc
Finance-CrdtCard/PmtPr
|
$83.46
|
+1.32
1.61% |
$83.98
|
11,079,453
143.11% of 50 DAV
50 DAV is 7,742,000
|
$92.35
-9.63%
|
7/23/2018
|
$89.24
|
PP = $87.55
|
|
MB = $91.93
|
Most Recent Note - 7/26/2018 1:23:49 PM
Y - Perched near its all-time high after today's early weakness. Gains backed by above average volume while hitting new all-time highs were noted indications of recent institutional buying demand. Reported earnings +26% on +23% sales revenues for the Jun '18 quarter. A valid secondary buy point exists up to 5% above the prior high ($87.55 on 6/21/18) since finding support at the 10 WMA line following a prior breakout. The 50 DMA line ($84.64) defines near-term support above the prior low ($80.16 on 6/28/18).
>>> FEATURED STOCK ARTICLE : Paypal Pulling Back From Record High - 7/26/2018 |
View all notes |
Set NEW NOTE alert |
Company Profile |
SEC
News |
Chart |
Request a new note
C
A
S
I |
OLLI
-
NASDAQ
Ollie's Bargain Outlet
Retail-DiscountandVariety
|
$67.55
|
-1.95
-2.81% |
$69.50
|
1,258,229
143.14% of 50 DAV
50 DAV is 879,000
|
$77.50
-12.84%
|
7/12/2018
|
$74.43
|
PP = $77.60
|
|
MB = $81.48
|
Most Recent Note - 7/27/2018 11:40:45 AM
G - Color code is changed to green while quietly slumping below its 50 DMA line ($73.18). The prior low ($69.65 on 7/02/18) defines the next important chart support level. A rebound and subsequent volume driven gains for new highs may trigger a new (or add-on) technical buy signal.
>>> FEATURED STOCK ARTICLE : Found Recent Support at 50-Day Moving Average Line - 7/5/2018 |
View all notes |
Set NEW NOTE alert |
Company Profile |
SEC
News |
Chart |
Request a new note
C
A
S
I |
Symbol/Exchange
Company Name
Industry Group |
PRICE |
CHANGE
(%Change) |
Day High |
Volume
(% DAV)
(% 50 day avg vol) |
52 Wk Hi
% From Hi |
Featured
Date |
Price
Featured |
Pivot Featured |
|
Max Buy |
NOVT
-
NASDAQ
Novanta Inc
Elec-Scientific/Msrng
|
$63.35
|
+1.00
1.60% |
$64.25
|
175,182
88.48% of 50 DAV
50 DAV is 198,000
|
$69.90
-9.37%
|
7/12/2018
|
$65.90
|
PP = $68.10
|
|
MB = $71.51
|
Most Recent Note - 7/31/2018 2:21:06 PM
G - Color code is changed to green after violating its 50 DMA line ($64.93) with a big volume-driven loss today triggering a technical sell signal. Recent low ($59.25) defines the next important support level. A rebound above the 50 DMA line is needed for its outlook to improve.
>>> FEATURED STOCK ARTICLE : Gain Challenged 52-Week High and New Pivot Point - 7/12/2018 |
View all notes |
Set NEW NOTE alert |
Company Profile |
SEC
News |
Chart |
Request a new note
C
A
S
I |
BZUN
-
NASDAQ
Baozun Inc Cl A Ads
Computer Sftwr-Enterprse
|
$57.73
|
-0.12
-0.21% |
$60.17
|
1,450,956
71.34% of 50 DAV
50 DAV is 2,034,000
|
$67.41
-14.36%
|
5/15/2018
|
$45.38
|
PP = $52.43
|
|
MB = $55.05
|
Most Recent Note - 7/30/2018 6:38:20 PM
G - Violated its 50 DMA line ($59.85) with today's loss on higher (near average) volume. The recent low ($51.50 on 6/27/18) defines the next important chart support.
>>> FEATURED STOCK ARTICLE : Found Support Near Prior Highs and 50 Day Moving Average - 7/6/2018 |
View all notes |
Set NEW NOTE alert |
Company Profile |
SEC
News |
Chart |
Request a new note
C
A
S
I |
TEAM
-
NASDAQ
Atlassian Corp Plc Cl A
Comp Sftwr-Spec Enterprs
|
$73.29
|
+0.88
1.22% |
$74.56
|
1,364,618
107.28% of 50 DAV
50 DAV is 1,272,000
|
$79.82
-8.18%
|
7/27/2018
|
$73.73
|
PP = $68.85
|
|
MB = $72.29
|
Most Recent Note - 7/30/2018 6:16:25 PM
Y - Retreated from its all-time high hit on the prior session. It was highlighted in yellow with pivot point cited based on its 6/06/18 high plus 10 cents. This Australia - based software developer reported earnings +44% on +40% sales revenues for the Jun '18 quarter helping it better match with the fact-based investment system's guidelines. Annual earnings (A criteria) history has been strong since its $21 IPO on 12/10/15. See the latest FSU analysis for more details and a new annotated graph.
>>> FEATURED STOCK ARTICLE : Pullback Following Recent technical Breakout - 7/30/2018 |
View all notes |
Set NEW NOTE alert |
Company Profile |
SEC
News |
Chart |
Request a new note
C
A
S
I |