***Last / Change / Volume data in this table is the closing quote data***
Symbol/Exchange
Company Name
Industry Group |
PRICE |
CHANGE
(%Change) |
Day High |
Volume
(% DAV)
(% 50 day avg vol) |
52 Wk Hi
% From Hi |
Featured
Date |
Price
Featured |
Pivot Featured |
|
Max Buy |
OSBC
-
NASDAQ
Old Second Bancorp Inc
BANKING - Regional - Midwest Banks
|
$15.40
|
-0.15
-0.96% |
$15.60
|
75,286
89.63% of 50 DAV
50 DAV is 84,000
|
$16.30
-5.52%
|
5/21/2018
|
$15.50
|
PP = $15.10
|
|
MB = $15.86
|
Most Recent Note - 9/4/2018 5:46:01 PM
G - Consolidating above its 50 DMA line ($15.12). The prior low ($14) and 200 DMA line define additional near-term support. Its Relative Strength Rating is 79, still just below the 80+ minimum guideline for buy candidates. Met stubborn resistance after hitting a new high on 7/26/18 with a big volume-driven gain. Fundamentals remain strong.
>>> FEATURED STOCK ARTICLE : Bank Perched Less Than -5% Off Record High - 8/23/2018 |
View all notes |
Set NEW NOTE alert |
Company Profile |
SEC
News |
Chart |
Request a new note
C
A
S
I |
SIVB
-
NASDAQ
S V B Financial Group
BANKING - Regional - Pacific Banks
|
$325.38
|
+1.25
0.39% |
$326.95
|
219,674
53.58% of 50 DAV
50 DAV is 410,000
|
$333.74
-2.50%
|
8/6/2018
|
$314.77
|
PP = $329.75
|
|
MB = $346.24
|
Most Recent Note - 9/4/2018 4:01:56 PM
Y - Met resistance in recent weeks near prior highs. Subsequent gains above the pivot point backed by at least +40% above average volume may trigger a convincing new technical buy signal. The 50 DMA line ($311) defines near-term support to watch on pullbacks.
>>> FEATURED STOCK ARTICLE : Bank Posted Quiet Gain for a Best-Ever Close - 8/27/2018 |
View all notes |
Set NEW NOTE alert |
Company Profile |
SEC
News |
Chart |
Request a new note
C
A
S
I |
ZBRA
-
NASDAQ
Zebra Tech Corp Cl A
COMPUTER HARDWARE - Computer Peripherals
|
$171.48
|
+1.43
0.84% |
$172.89
|
221,794
59.46% of 50 DAV
50 DAV is 373,000
|
$172.73
-0.72%
|
8/7/2018
|
$164.26
|
PP = $161.82
|
|
MB = $169.91
|
Most Recent Note - 9/4/2018 4:03:29 PM
G - Volume totals have been cooling while stubbornly holding its ground near its "max buy" level. Prior high in the $161 area defines initial support above its 50 DMA line ($153) Fundamentals remain strong.
>>> FEATURED STOCK ARTICLE : Big Gain for New High Backed by Heavy Volume - 8/7/2018 |
View all notes |
Set NEW NOTE alert |
Company Profile |
SEC
News |
Chart |
Request a new note
C
A
S
I |
EPAM
-
NYSE
Epam Systems Inc
COMPUTER SOFTWARE and SERVICES - Information Technology Service
|
$137.98
|
+0.66
0.48% |
$138.89
|
357,132
72.59% of 50 DAV
50 DAV is 492,000
|
$144.19
-4.31%
|
7/5/2018
|
$123.70
|
PP = $131.85
|
|
MB = $138.44
|
Most Recent Note - 9/6/2018 12:32:13 PM
Y - Color code is changed to yellow while pulling back below its "max buy" level. Prior highs in the $137 area define near term support along with its 50 DMA line ($132.75). Fundamentals remain strong.
>>> FEATURED STOCK ARTICLE : Tech Services Firm Remains Fundamentally and Technically Strong - 8/20/2018 |
View all notes |
Set NEW NOTE alert |
Company Profile |
SEC
News |
Chart |
Request a new note
C
A
S
I |
IRBT
-
NASDAQ
Irobot Corp
CONSUMER DURABLES - Electronic Equipment
|
$107.98
|
+2.85
2.71% |
$108.53
|
783,705
80.46% of 50 DAV
50 DAV is 974,000
|
$118.75
-9.07%
|
8/29/2018
|
$112.07
|
PP = $109.88
|
|
MB = $115.37
|
Most Recent Note - 9/6/2018 6:05:39 PM
Y - Slumped back below its pivot point with today's big loss on higher volume raising concerns while negating the recent breakout. Disciplined investors always limit losses by selling any stock that falls more than -7% from their purchase price.
>>> FEATURED STOCK ARTICLE : Household Appliance Maker Rallied From Choppy Base - 8/29/2018 |
View all notes |
Set NEW NOTE alert |
Company Profile |
SEC
News |
Chart |
Request a new note
C
A
S
I |
Symbol/Exchange
Company Name
Industry Group |
PRICE |
CHANGE
(%Change) |
Day High |
Volume
(% DAV)
(% 50 day avg vol) |
52 Wk Hi
% From Hi |
Featured
Date |
Price
Featured |
Pivot Featured |
|
Max Buy |
TSC
-
NASDAQ
TriState Capital Hld Inc
CONSUMER NON-DURABLES - Personal Products
|
$29.70
|
-0.10
-0.34% |
$29.85
|
281,263
191.34% of 50 DAV
50 DAV is 147,000
|
$30.10
-1.33%
|
9/11/2018
|
$29.75
|
PP = $30.20
|
|
MB = $31.71
|
 Most Recent Note - 9/11/2018 5:10:57 PM
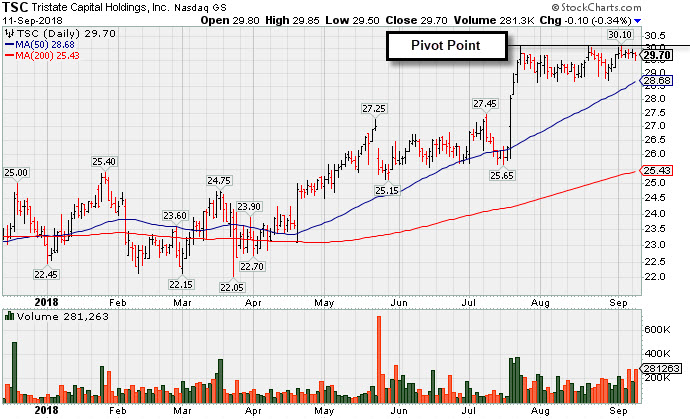
Y - Sputtered today after highlighted in yellow with pivot point cited based on its 7/24/18 high plus 10 cents. Churning above average volume while holding its ground in a tight range near its all-time high. Subsequent volume-driven gains above its pivot point may trigger a technical buy signal. The 4 latest quarterly earnings reports through Jun '18 have been above the +25% minimum guideline (C criteria). and sales revenues growth has been strong. Annual earnings (A criteria) history has been good. See the latest FSU analysis for more details and a new annotated graph.
>>> FEATURED STOCK ARTICLE : TriState Bank Perched Near All-Time High - 9/11/2018 |
View all notes |
Set NEW NOTE alert |
Company Profile |
SEC
News |
Chart |
Request a new note
C
A
S
I |
FLT
-
NYSE
Fleetcor Technologies
DIVERSIFIED SERVICES - Business/Management Services
|
$217.21
|
-0.40
-0.18% |
$218.21
|
402,175
67.48% of 50 DAV
50 DAV is 596,000
|
$225.92
-3.86%
|
6/18/2018
|
$219.31
|
PP = $213.84
|
|
MB = $224.53
|
Most Recent Note - 9/4/2018 3:58:31 PM
G - Color code is changed to green while sputtering below its 50 DMA line ($216). The prior low ($210.64 on 8/03/18) defines important near-term support above its 200 DMA line($202). Fundamentals remain strong.
>>> FEATURED STOCK ARTICLE : Testing 50-Day Average With Loss on Higher Volume - 8/3/2018 |
View all notes |
Set NEW NOTE alert |
Company Profile |
SEC
News |
Chart |
Request a new note
C
A
S
I |
MA
-
NYSE
Mastercard Inc Cl A
Finance-CrdtCard/PmtPr
|
$213.45
|
+1.78
0.84% |
$213.56
|
2,599,032
84.36% of 50 DAV
50 DAV is 3,081,000
|
$217.35
-1.79%
|
7/11/2018
|
$203.84
|
PP = $204.10
|
|
MB = $214.31
|
Most Recent Note - 9/4/2018 4:00:03 PM
Y - Touched a new high with a gain today with near average volume, poised for its best-ever close. Its 50 DMA line ($204) defines support above the prior lows in the $193-196 area. Fundamentals remain strong.
>>> FEATURED STOCK ARTICLE : Found Support Near 50-Day Moving Average Line - 8/10/2018 |
View all notes |
Set NEW NOTE alert |
Company Profile |
SEC
News |
Chart |
Request a new note
C
A
S
I |
V
-
NYSE
Visa Inc Cl A
Finance-CrdtCard/PmtPr
|
$145.49
|
+1.41
0.98% |
$145.52
|
9,801,770
136.34% of 50 DAV
50 DAV is 7,189,000
|
$147.86
-1.60%
|
4/26/2018
|
$126.68
|
PP = $126.98
|
|
MB = $133.33
|
Most Recent Note - 9/5/2018 5:56:52 PM
G - Suffered a large loss with heavy volume today, action indicative of distributional pressure. It is extended from any sound base. Its 50 DMA line ($139) and recent low ($135.31 on 7/30/18) define important near-term support to watch on pullbacks. Fundamentals remain strong.
>>> FEATURED STOCK ARTICLE : Perched Near All-Time High After Rally From 50-Day Average - 7/27/2018 |
View all notes |
Set NEW NOTE alert |
Company Profile |
SEC
News |
Chart |
Request a new note
C
A
S
I |
NANO
-
NASDAQ
Nanometrics Inc
ELECTRONICS - Scientific and Technical Instrum
|
$38.34
|
-0.53
-1.36% |
$38.81
|
499,602
126.48% of 50 DAV
50 DAV is 395,000
|
$48.26
-20.56%
|
8/13/2018
|
$44.17
|
PP = $44.27
|
|
MB = $46.48
|
Most Recent Note - 9/10/2018 5:27:41 PM
G - Color code is changed to green after slumping below its 50 DMA line ($40) with today's 6th consecutive loss also undercutting the recent low ($39.79 on 8/17/18) and raising concerns. Only a prompt rebound above the 50 DMA line would help its outlook improve. Fundamentals remain strong.
>>> FEATURED STOCK ARTICLE : Five Times Average Volume Behind Breakout Gain - 8/13/2018 |
View all notes |
Set NEW NOTE alert |
Company Profile |
SEC
News |
Chart |
Request a new note
C
A
S
I |
Symbol/Exchange
Company Name
Industry Group |
PRICE |
CHANGE
(%Change) |
Day High |
Volume
(% DAV)
(% 50 day avg vol) |
52 Wk Hi
% From Hi |
Featured
Date |
Price
Featured |
Pivot Featured |
|
Max Buy |
ENV
-
NYSE
Envestnet Inc
FINANCIAL SERVICES - Diversified Investments
|
$63.70
|
+0.75
1.19% |
$63.75
|
174,361
64.34% of 50 DAV
50 DAV is 271,000
|
$64.00
-0.47%
|
6/15/2018
|
$57.85
|
PP = $60.37
|
|
MB = $63.39
|
Most Recent Note - 9/4/2018 3:55:34 PM
Y - Quietly perched near its all-time high after a streak of gains marked by light and average volume. Found prompt support near its 50 DMA line ($59.39) in recent weeks. Fundamentals remain strong.
>>> FEATURED STOCK ARTICLE : Earnings News Due for Financial Firm Perched Near High - 8/6/2018 |
View all notes |
Set NEW NOTE alert |
Company Profile |
SEC
News |
Chart |
Request a new note
C
A
S
I |
TPL
-
NYSE
Texas Pacific Land Trust
Real Estate Dvlpmt/Ops
|
$842.70
|
+18.22
2.21% |
$845.00
|
18,666
143.58% of 50 DAV
50 DAV is 13,000
|
$874.00
-3.58%
|
7/5/2018
|
$714.90
|
PP = $739.99
|
|
MB = $776.99
|
Most Recent Note - 9/11/2018 12:30:40 PM
G - Stubbornly holding its ground perched near its all-time high, extended from any sound base. The 50 DMA line ($789) and recent low ($760 on 8/15/18) define important near-term support to watch on pullbacks.
>>> FEATURED STOCK ARTICLE : Best Ever Close After a Solid Gain on Higher Volume - 9/4/2018 |
View all notes |
Set NEW NOTE alert |
Company Profile |
SEC
News |
Chart |
Request a new note
C
A
S
I |
FIZZ
-
NASDAQ
National Beverage Corp
FOOD and BEVERAGE - Beverages - Soft Drinks
|
$120.00
|
+0.46
0.38% |
$121.40
|
306,379
150.93% of 50 DAV
50 DAV is 203,000
|
$129.82
-7.56%
|
9/6/2018
|
$125.92
|
PP = $129.92
|
|
MB = $136.42
|
Most Recent Note - 9/10/2018 5:24:16 PM
Y - Posted a gain today with above average volume. Highlighted in yellow with new pivot point cited based on its 9/11/17 high plus 10 cents in the 9/06/18 mid-day report, it challenged its high with a big gain backed by +111% above average volume. Subsequent gains above the pivot point for a a new high (N criteria) backed by at least +40% above average volume may trigger a proper technical buy signal. Reported Jun '17 quarterly earnings +32% on +20% sales revenues, continuing its streak of strong quarterly earnings (C criteria) results. Annual earnings (A criteria) growth has been strong after a downturn in FY '14. Small supply of only 11.2 million shares (S criteria) in the public float can contribute to greater volatility.
>>> FEATURED STOCK ARTICLE : Strong Beverage Firm Challenges Prior High - 9/6/2018 |
View all notes |
Set NEW NOTE alert |
Company Profile |
SEC
News |
Chart |
Request a new note
C
A
S
I |
ODFL
-
NASDAQ
Old Dominion Fght Line
TRANSPORTATION - Trucking
|
$168.03
|
+0.45
0.27% |
$170.22
|
771,541
131.44% of 50 DAV
50 DAV is 587,000
|
$170.03
-1.18%
|
9/6/2018
|
$163.11
|
PP = $164.20
|
|
MB = $172.41
|
Most Recent Note - 9/7/2018 6:04:46 PM
Y -Reversed into the red today after early gains into new high territory. Highlighted in yellow with new pivot point cited based on its 6/12/18 high plus 10 cents in the prior mid-day report. Gain above the pivot point backed by +80% above average volume triggered a technical buy signal. Found support near its 200 DMA line during the consolidation since last noted in the 7/26/18 mid-day report - "Reported Jun '18 quarterly earnings +67% on +23% sales revenues, its 3rd consecutive strong quarterly comparison versus the year-ago period." See the latest FSU analysis for more details and a new annotated graph.
>>> FEATURED STOCK ARTICLE : Trucking Firm Perched at All-Time High - 9/7/2018 |
View all notes |
Set NEW NOTE alert |
Company Profile |
SEC
News |
Chart |
Request a new note
C
A
S
I |
DPZ
-
NYSE
Dominos Pizza Inc
Retail-Restaurants
|
$286.62
|
-7.16
-2.44% |
$293.90
|
403,882
70.86% of 50 DAV
50 DAV is 570,000
|
$305.34
-6.13%
|
8/13/2018
|
$288.60
|
PP = $293.91
|
|
MB = $308.61
|
Most Recent Note - 9/11/2018 5:12:23 PM
Y - Still enduring mild distributional pressure after recently wedging to new 52-week highs with gains lacking volume conviction. Subsequent gains above the pivot point backed by at least +40% above average volume are still needed to clinch a proper new (or add-on) technical buy signal.
>>> FEATURED STOCK ARTICLE : Pulling Back After Wedging Gains for Highs Lacked Great Volume - 9/5/2018 |
View all notes |
Set NEW NOTE alert |
Company Profile |
SEC
News |
Chart |
Request a new note
C
A
S
I |
Symbol/Exchange
Company Name
Industry Group |
PRICE |
CHANGE
(%Change) |
Day High |
Volume
(% DAV)
(% 50 day avg vol) |
52 Wk Hi
% From Hi |
Featured
Date |
Price
Featured |
Pivot Featured |
|
Max Buy |
FIVE
-
NASDAQ
Five Below Inc
Retail-DiscountandVariety
|
$133.81
|
+0.65
0.49% |
$135.84
|
1,036,115
114.11% of 50 DAV
50 DAV is 908,000
|
$136.13
-1.71%
|
7/6/2018
|
$98.90
|
PP = $104.09
|
|
MB = $109.29
|
Most Recent Note - 9/7/2018 11:42:12 AM
G - Gapped up today hitting a new all-time high and getting very extended from any sound base. Bullish action came after reporting earnings +40% on +23% sales revenues for the Jul '18 quarter, continuing its strong earnings track record. Prior highs and its 50 DMA line ($105.50) define near-term support to watch on pullbacks.
>>> FEATURED STOCK ARTICLE : Volume Totals Cooling While Perched Near Record High - 8/16/2018 |
View all notes |
Set NEW NOTE alert |
Company Profile |
SEC
News |
Chart |
Request a new note
C
A
S
I |
NOW
-
NYSE
Servicenow Inc
Computer Sftwr-Enterprse
|
$199.50
|
+0.49
0.25% |
$202.72
|
1,705,507
99.85% of 50 DAV
50 DAV is 1,708,000
|
$201.00
-0.75%
|
8/24/2018
|
$193.83
|
PP = $194.91
|
|
MB = $204.66
|
Most Recent Note - 9/5/2018 12:34:01 PM
Y - Retreating from its 52-week high with today's big loss on higher volume. The 8/29/18 gain above the pivot point backed by +77% above average volume clinched a new (or add-on) technical buy signal. The recent low ($174) defines the next important near-term support. Fundamentals remain strong.
>>> FEATURED STOCK ARTICLE : Slump Below 50-Day Average Line Raises Concerns - 8/17/2018 |
View all notes |
Set NEW NOTE alert |
Company Profile |
SEC
News |
Chart |
Request a new note
C
A
S
I |
NVEE
-
NASDAQ
N V 5 Global Inc
Comml Svcs-Consulting
|
$91.00
|
+0.30
0.33% |
$91.70
|
48,296
63.55% of 50 DAV
50 DAV is 76,000
|
$92.75
-1.89%
|
6/15/2018
|
$7,070.00
|
PP = $72.00
|
|
MB = $75.60
|
Most Recent Note - 9/4/2018 5:32:30 PM
G - Gradually rebounding near its all-time high since pricing a new Public Offering and gapping down on 8/09/18. Its 50 DMA line ($78.77) defines near-term support to watch on pullbacks.
>>> FEATURED STOCK ARTICLE : Remains Perched Near All-Time High Following Offering - 8/21/2018 |
View all notes |
Set NEW NOTE alert |
Company Profile |
SEC
News |
Chart |
Request a new note
C
A
S
I |
PANW
-
NYSE
Palo Alto Networks
Computer Sftwr-Security
|
$234.12
|
-2.00
-0.85% |
$238.25
|
1,197,304
97.18% of 50 DAV
50 DAV is 1,232,000
|
$237.82
-1.55%
|
6/12/2018
|
$206.55
|
PP = $214.69
|
|
MB = $225.42
|
Most Recent Note - 9/10/2018 12:29:10 PM
G - Hitting another new all-time high with today's 2nd consecutive volume-driven gain. Its 50 DMA line ($214.64) defines initial support above the prior low ($193 on 7/30/18). Reported +39% earnings on +29% sales revenues for the Jul '18 quarter, continuing its strong earnings track record.
>>> FEATURED STOCK ARTICLE : Violated 50-day Average With Volume-driven Loss - 7/31/2018 |
View all notes |
Set NEW NOTE alert |
Company Profile |
SEC
News |
Chart |
Request a new note
C
A
S
I |
QLYS
-
NASDAQ
Qualys Inc
Computer Sftwr-Security
|
$94.20
|
+1.60
1.73% |
$94.75
|
286,663
87.40% of 50 DAV
50 DAV is 328,000
|
$98.30
-4.17%
|
8/31/2018
|
$91.05
|
PP = $98.40
|
|
MB = $103.32
|
Most Recent Note - 9/5/2018 5:59:04 PM
G- Color code is changed to green after slumping to a close below its 50 DMA line ($89.34). The recent low ($82.91 on 8/15/18) defines the next important near term support to watch. Subsequent volume-driven gains above the pivot point are needed to trigger a technical buy signal, however, it faces some near-term resistance due to overhead supply up to the $98 level.
>>> FEATURED STOCK ARTICLE : Cloud Security Firm Faces Some Near Term Resistance - 9/3/2018 |
View all notes |
Set NEW NOTE alert |
Company Profile |
SEC
News |
Chart |
Request a new note
C
A
S
I |
Symbol/Exchange
Company Name
Industry Group |
PRICE |
CHANGE
(%Change) |
Day High |
Volume
(% DAV)
(% 50 day avg vol) |
52 Wk Hi
% From Hi |
Featured
Date |
Price
Featured |
Pivot Featured |
|
Max Buy |
ANET
-
NYSE
"Arista Networks, Inc"
TELECOMMUNICATIONS - Communication Equipment
|
$267.21
|
-1.80
-0.67% |
$271.25
|
835,335
78.20% of 50 DAV
50 DAV is 1,068,200
|
$313.37
-14.73%
|
8/24/2018
|
$308.26
|
PP = $311.77
|
|
MB = $327.36
|
Most Recent Note - 9/5/2018 5:45:29 PM
Y - Encountered distributional pressure and tested its 50 DMA line ($272) with another loss backed by above average volume. More damaging losses would raise concerns and hurt its outlook.Subsequent volume-driven gains and a strong close above the pivot point would be a reassuring sign of fresh institutional buying demand.
>>> FEATURED STOCK ARTICLE : Considerable Gap Up Gain With Heavy Volume - 8/24/2018 |
View all notes |
Set NEW NOTE alert |
Company Profile |
SEC
News |
Chart |
Request a new note
C
A
S
I |
PAYC
-
NYSE
Paycom Software Inc
COMPUTER SOFTWARE and SERVICES - Application Software
|
$159.00
|
+2.02
1.29% |
$159.85
|
693,454
92.71% of 50 DAV
50 DAV is 748,000
|
$157.47
0.97%
|
8/1/2018
|
$122.87
|
PP = $118.55
|
|
MB = $124.48
|
Most Recent Note - 9/5/2018 5:47:07 PM
G - Retreated from its all-time high with a big loss today on higher volume. Very extended from any sound base after rallying well above prior highs in the $118 area. Fundamentals remain strong.
>>> FEATURED STOCK ARTICLE : Bullish Action Followed Strong Earnings News - 8/1/2018 |
View all notes |
Set NEW NOTE alert |
Company Profile |
SEC
News |
Chart |
Request a new note
C
A
S
I |
GRUB
-
NYSE
Grubhub Inc
INTERNET - Content
|
$146.73
|
+5.72
4.06% |
$147.37
|
1,436,472
100.81% of 50 DAV
50 DAV is 1,425,000
|
$145.37
0.94%
|
8/24/2018
|
$138.44
|
PP = $141.16
|
|
MB = $148.22
|
Most Recent Note - 9/11/2018 5:13:47 PM
Y - Posted a solid gain today with only average volume as it hit a new all-time high. Recent gains lacked great volume conviction. Gains above the pivot point backed by at least +40% above average volume are needed to trigger a proper new (or add-on) technical buy signal.
>>> FEATURED STOCK ARTICLE : Hovering Near Record High Following Considerable Rally - 8/2/2018 |
View all notes |
Set NEW NOTE alert |
Company Profile |
SEC
News |
Chart |
Request a new note
C
A
S
I |
HQY
-
NASDAQ
Healthequity Inc
COMPUTER SOFTWARE and SERVICES - Healthcare Information Service
|
$97.32
|
+0.73
0.76% |
$97.94
|
355,684
90.28% of 50 DAV
50 DAV is 394,000
|
$97.94
-0.63%
|
8/13/2018
|
$82.39
|
PP = $83.44
|
|
MB = $87.61
|
Most Recent Note - 9/10/2018 5:20:51 PM
G - Holding ground at its all-time high after impressive volume-driven gains, very extended from any sound base. Prior highs in the $82-83 area define support along with its 50 DMA line ($83.86). See the latest FSU analysis for more details and a new annotated graph.
>>> FEATURED STOCK ARTICLE : Very Extended From Any Sound Base After Streak of Gains - 9/10/2018 |
View all notes |
Set NEW NOTE alert |
Company Profile |
SEC
News |
Chart |
Request a new note
C
A
S
I |
LOB
-
NASDAQ
"Live Oak Bancshares, Inc."
Banks-Southeast
|
$29.40
|
+0.00
0.00% |
$29.45
|
56,570
40.44% of 50 DAV
50 DAV is 139,900
|
$32.95
-10.77%
|
5/21/2018
|
$29.35
|
PP = $30.15
|
|
MB = $31.66
|
Most Recent Note - 9/4/2018 12:55:04 PM
G - Its Relative Strength Rating is 77, below the 80+ minimum guideline. Meeting resistance today, whereas a convincing rebound above the 50 DMA line ($30.49) would help its outlook improve. The recent low and 200 DMA line ($27.98) define important near-term chart support.
>>> FEATURED STOCK ARTICLE : Recently Met Resistance at 50-Day Moving Average - 8/28/2018 |
View all notes |
Set NEW NOTE alert |
Company Profile |
SEC
News |
Chart |
Request a new note
C
A
S
I |
Symbol/Exchange
Company Name
Industry Group |
PRICE |
CHANGE
(%Change) |
Day High |
Volume
(% DAV)
(% 50 day avg vol) |
52 Wk Hi
% From Hi |
Featured
Date |
Price
Featured |
Pivot Featured |
|
Max Buy |
PYPL
-
NASDAQ
Paypal Holdings Inc
Finance-CrdtCard/PmtPr
|
$91.43
|
+1.63
1.82% |
$91.71
|
7,270,338
104.50% of 50 DAV
50 DAV is 6,957,000
|
$93.44
-2.15%
|
7/23/2018
|
$89.24
|
PP = $87.55
|
|
MB = $91.93
|
Most Recent Note - 9/5/2018 5:48:48 PM
Y - Suffered a big loss on higher volume today, slumping below its "max buy" level, and its color code is changed to yellow. Its 50 DMA line ($86.94) defines support above prior lows in the $80-81 area.
>>> FEATURED STOCK ARTICLE : Paypal Pulling Back From Record High - 7/26/2018 |
View all notes |
Set NEW NOTE alert |
Company Profile |
SEC
News |
Chart |
Request a new note
C
A
S
I |
OLLI
-
NASDAQ
Ollie's Bargain Outlet
Retail-DiscountandVariety
|
$92.45
|
-0.75
-0.80% |
$94.70
|
756,172
121.96% of 50 DAV
50 DAV is 620,000
|
$93.75
-1.39%
|
7/12/2018
|
$74.43
|
PP = $77.60
|
|
MB = $81.48
|
Most Recent Note - 9/6/2018 1:19:28 PM
G - Reported earnings +48% on +13% sales revenues for the Jul '18 quarter, continuing its strong earnings track record. Extended from any sound base and perched at its all-time high after 14 consecutive gains. Prior highs in the $77 area define initial support to watch above its 50 DMA line ($75.24).
>>> FEATURED STOCK ARTICLE : Hitting New Highs With More Volume-Driven Gains - 8/22/2018 |
View all notes |
Set NEW NOTE alert |
Company Profile |
SEC
News |
Chart |
Request a new note
C
A
S
I |
NOVT
-
NASDAQ
Novanta Inc
Elec-Scientific/Msrng
|
$74.80
|
-1.05
-1.38% |
$76.75
|
222,061
121.34% of 50 DAV
50 DAV is 183,000
|
$78.85
-5.14%
|
7/12/2018
|
$65.90
|
PP = $68.10
|
|
MB = $71.51
|
Most Recent Note - 9/4/2018 1:00:47 PM
G - Still perched near its 52-week high, extended from the prior base. Prior highs in the $68-69 area define support along with its 50 DMA line ($68.22).
>>> FEATURED STOCK ARTICLE : Electronic Systems Leader is Extended From Prior Base - 8/30/2018 |
View all notes |
Set NEW NOTE alert |
Company Profile |
SEC
News |
Chart |
Request a new note
C
A
S
I |
TEAM
-
NASDAQ
Atlassian Corp Plc Cl A
Comp Sftwr-Spec Enterprs
|
$90.49
|
+2.53
2.88% |
$90.77
|
876,208
67.45% of 50 DAV
50 DAV is 1,299,000
|
$92.26
-1.92%
|
7/27/2018
|
$73.73
|
PP = $68.85
|
|
MB = $72.29
|
Most Recent Note - 9/11/2018 5:15:57 PM
G - Posted a gain on light volume ending near its all-time high, very extended from any sound base. The 50 DMA line ($75.68) defines near-term support to watch on pullbacks. Fundamentals through Jun '18 have been strong.
>>> FEATURED STOCK ARTICLE : Pullback Following Recent technical Breakout - 7/30/2018 |
View all notes |
Set NEW NOTE alert |
Company Profile |
SEC
News |
Chart |
Request a new note
C
A
S
I |
SEND
-
NYSE
Sendgrid Inc
INTERNET - Content
|
$38.01
|
+0.36
0.96% |
$38.66
|
733,594
81.97% of 50 DAV
50 DAV is 895,000
|
$37.95
0.16%
|
8/13/2018
|
$32.20
|
PP = $32.13
|
|
MB = $33.74
|
Most Recent Note - 9/4/2018 5:41:51 PM
G - Posted a gain today with average volume for another new all-time high, getting more extended from the latest base. Prior highs in the $32 area define initial support to watch above its 50 DMA line.
>>> FEATURED STOCK ARTICLE : Strength Returned After Finding Support Near Prior Lows - 8/14/2018 |
View all notes |
Set NEW NOTE alert |
Company Profile |
SEC
News |
Chart |
Request a new note
C
A
S
I |
Symbol/Exchange
Company Name
Industry Group |
PRICE |
CHANGE
(%Change) |
Day High |
Volume
(% DAV)
(% 50 day avg vol) |
52 Wk Hi
% From Hi |
Featured
Date |
Price
Featured |
Pivot Featured |
|
Max Buy |