***Last / Change / Volume data in this table is the closing quote data***
Symbol/Exchange
Company Name
Industry Group |
PRICE |
CHANGE
(%Change) |
Day High |
Volume
(% DAV)
(% 50 day avg vol) |
52 Wk Hi
% From Hi |
Featured
Date |
Price
Featured |
Pivot Featured |
|
Max Buy |
OSBC
-
NASDAQ
Old Second Bancorp Inc
BANKING - Regional - Midwest Banks
|
$15.25
|
-0.15
-0.97% |
$15.50
|
23,937
24.86% of 50 DAV
50 DAV is 96,300
|
$16.30
-6.44%
|
5/21/2018
|
$15.50
|
PP = $15.10
|
|
MB = $15.86
|
 Most Recent Note - 8/20/2018 12:39:12 PM
G - Consolidating above its 50 DMA line ($15.07) while the prior low ($14) and 200 DMA line define additional near-term support. Met stubborn resistance after hitting a new high on 7/26/18 with a big volume-driven gain. Its Relative Strength Rating has slumped to 79, below the 80+ minimum guideline for buy candidates. Fundamentals remain strong after it reported Jun '18 quarterly earnings +71% on +23% sales revenues.
>>> FEATURED STOCK ARTICLE : Consolidating Above 50-Day Moving Average - 7/9/2018 |
View all notes |
Set NEW NOTE alert |
Company Profile |
SEC
News |
Chart |
Request a new note
C
A
S
I |
SIVB
-
NASDAQ
S V B Financial Group
BANKING - Regional - Pacific Banks
|
$324.31
|
+3.55
1.11% |
$324.91
|
230,499
49.46% of 50 DAV
50 DAV is 466,000
|
$333.74
-2.83%
|
8/6/2018
|
$314.77
|
PP = $329.75
|
|
MB = $346.24
|
Most Recent Note - 8/20/2018 12:44:43 PM
Y - Met resistance in recent weeks near prior highs. Subsequent gains above the pivot point backed by at least +40% above average volume may trigger a convincing new technical buy signal. The 50 DMA line ($310) and recent low ($284.42 on 7/02/18) define near-term support to watch on pullbacks. Fundamentals remain strong.
>>> FEATURED STOCK ARTICLE : Still Sputtering Below 50-Day Moving Average - 7/10/2018 |
View all notes |
Set NEW NOTE alert |
Company Profile |
SEC
News |
Chart |
Request a new note
C
A
S
I |
ZBRA
-
NASDAQ
Zebra Tech Corp Cl A
COMPUTER HARDWARE - Computer Peripherals
|
$165.72
|
+2.15
1.31% |
$166.39
|
299,118
71.90% of 50 DAV
50 DAV is 416,000
|
$167.61
-1.13%
|
8/7/2018
|
$164.26
|
PP = $161.82
|
|
MB = $169.91
|
Most Recent Note - 8/20/2018 5:15:06 PM
Y - Posted a gain today with light volume for its 2nd best ever close. Stubbornly held its ground after the considerable volume-driven gain on 8/07/18 triggered a technical buy signal. Its 50 DMA line ($150) defines near-term support above the prior low ($136.16 on 7/31/18). Fundamentals remain strong.
>>> FEATURED STOCK ARTICLE : Big Gain for New High Backed by Heavy Volume - 8/7/2018 |
View all notes |
Set NEW NOTE alert |
Company Profile |
SEC
News |
Chart |
Request a new note
C
A
S
I |
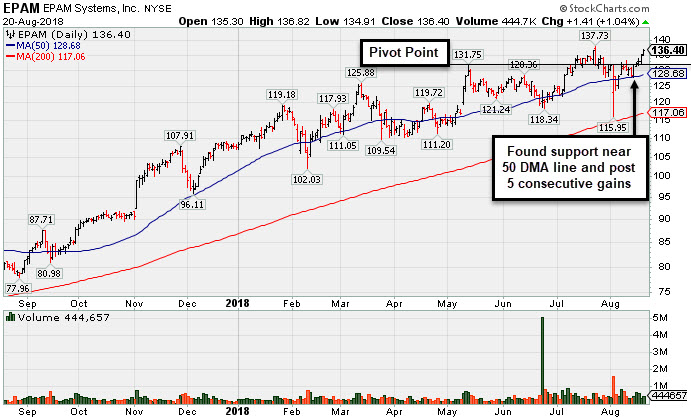
EPAM
-
NYSE
Epam Systems Inc
COMPUTER SOFTWARE and SERVICES - Information Technology Service
|
$136.40
|
+1.41
1.04% |
$136.82
|
444,657
76.93% of 50 DAV
50 DAV is 578,000
|
$137.73
-0.97%
|
7/5/2018
|
$123.70
|
PP = $131.85
|
|
MB = $138.44
|
Most Recent Note - 8/20/2018 5:05:12 PM
Y - Posted a 5th consecutive gain today for its 2nd best close ever. Recently found support above its 50 DMA line ($128.68). Fundamentals remain strong. Recent low ($115) and 200 DMA line define important near term support. See the latest FSU analysis for more details and a new annotated graph.
>>> FEATURED STOCK ARTICLE : Tech Services Firm Remains Fundamentally and Technically Strong - 8/20/2018 |
View all notes |
Set NEW NOTE alert |
Company Profile |
SEC
News |
Chart |
Request a new note
C
A
S
I |
FLT
-
NYSE
Fleetcor Technologies
DIVERSIFIED SERVICES - Business/Management Services
|
$215.15
|
+0.96
0.45% |
$215.91
|
287,745
23.39% of 50 DAV
50 DAV is 1,230,000
|
$225.92
-4.77%
|
6/18/2018
|
$219.31
|
PP = $213.84
|
|
MB = $224.53
|
Most Recent Note - 8/20/2018 12:31:42 PM
Y - Consolidating near its 50 DMA line ($215.84) with volume totals cooling in recent weeks. The prior low ($210.64 on 8/03/18) defines important near-term support above its 200 DMA line($202). Reported earnings +29% on +8% sales revenues for the Jun '18 quarter, its 3rd consecutive quarterly comparison above the +25% minimum guideline (C criteria).
>>> FEATURED STOCK ARTICLE : Testing 50-Day Average With Loss on Higher Volume - 8/3/2018 |
View all notes |
Set NEW NOTE alert |
Company Profile |
SEC
News |
Chart |
Request a new note
C
A
S
I |
Symbol/Exchange
Company Name
Industry Group |
PRICE |
CHANGE
(%Change) |
Day High |
Volume
(% DAV)
(% 50 day avg vol) |
52 Wk Hi
% From Hi |
Featured
Date |
Price
Featured |
Pivot Featured |
|
Max Buy |
MA
-
NYSE
Mastercard Inc Cl A
Finance-CrdtCard/PmtPr
|
$204.75
|
+1.54
0.76% |
$204.98
|
2,391,314
75.67% of 50 DAV
50 DAV is 3,160,000
|
$214.28
-4.45%
|
7/11/2018
|
$203.84
|
PP = $204.10
|
|
MB = $214.31
|
Most Recent Note - 8/20/2018 5:18:05 PM
Y - Consolidating above its 50 DMA line ($202) with volume totals cooling in recent weeks. Prior lows in the $193-196 area help define important near-term support to watch. Reported earnings +51% on +20% sales revenues for the Jun '18 quarter.
>>> FEATURED STOCK ARTICLE : Found Support Near 50-Day Moving Average Line - 8/10/2018 |
View all notes |
Set NEW NOTE alert |
Company Profile |
SEC
News |
Chart |
Request a new note
C
A
S
I |
V
-
NYSE
Visa Inc Cl A
Finance-CrdtCard/PmtPr
|
$140.94
|
-0.39
-0.28% |
$141.60
|
4,641,680
63.67% of 50 DAV
50 DAV is 7,290,000
|
$143.14
-1.54%
|
4/26/2018
|
$126.68
|
PP = $126.98
|
|
MB = $133.33
|
Most Recent Note - 8/17/2018 6:13:00 PM
G - Remains perched near its all-time high, extended from any sound base. Its 50 DMA line ($137.30) and recent low ($135.31 on 7/30/18) define important near-term support to watch on pullbacks. Fundamentals remain strong.
>>> FEATURED STOCK ARTICLE : Perched Near All-Time High After Rally From 50-Day Average - 7/27/2018 |
View all notes |
Set NEW NOTE alert |
Company Profile |
SEC
News |
Chart |
Request a new note
C
A
S
I |
NANO
-
NASDAQ
Nanometrics Inc
ELECTRONICS - Scientific and Technical Instrum
|
$41.29
|
+0.89
2.20% |
$41.62
|
550,781
143.06% of 50 DAV
50 DAV is 385,000
|
$48.26
-14.44%
|
8/13/2018
|
$44.17
|
PP = $44.27
|
|
MB = $46.48
|
Most Recent Note - 8/16/2018 11:59:51 AM
Y - Abruptly retreating with today's 2nd consecutive volume-driven loss, slumping back into the prior base and raising concerns. The 50 DMA line ($38.85) defines important near-term support. Recent quarters through Jun '18 showed much better sales and earnings increases versus the year earlier. Annual earnings (A criteria) have improved greatly since a downturn and losses FY '13 and '14.
>>> FEATURED STOCK ARTICLE : Five Times Average Volume Behind Breakout Gain - 8/13/2018 |
View all notes |
Set NEW NOTE alert |
Company Profile |
SEC
News |
Chart |
Request a new note
C
A
S
I |
ENV
-
NYSE
Envestnet Inc
FINANCIAL SERVICES - Diversified Investments
|
$59.65
|
+0.70
1.19% |
$59.90
|
308,821
95.61% of 50 DAV
50 DAV is 323,000
|
$62.95
-5.24%
|
6/15/2018
|
$57.85
|
PP = $60.37
|
|
MB = $63.39
|
Most Recent Note - 8/20/2018 5:11:12 PM
Y - Found prompt support near its 50 DMA line ($58.62) in recent weeks but its Relative Strength Rating has slumped to 79, below the 80+ minimum guideline for buy candidates. Endured distributional pressure after a volume-driven gain for a new high on 7/23/18 triggered a technical buy signal. The recent low ($53.75 on 6/28/18) and 200 DMA line define important near-term support. Fundamentals remain strong.
>>> FEATURED STOCK ARTICLE : Earnings News Due for Financial Firm Perched Near High - 8/6/2018 |
View all notes |
Set NEW NOTE alert |
Company Profile |
SEC
News |
Chart |
Request a new note
C
A
S
I |
TPL
-
NYSE
Texas Pacific Land Trust
Real Estate Dvlpmt/Ops
|
$805.00
|
+11.34
1.43% |
$805.00
|
10,731
76.65% of 50 DAV
50 DAV is 14,000
|
$825.90
-2.53%
|
7/5/2018
|
$714.90
|
PP = $739.99
|
|
MB = $776.99
|
Most Recent Note - 8/17/2018 6:12:27 PM
G - Perched near its all-time high with volume totals cooling while stubbornly holding its ground. The 50 DMA line ($748) and recent low ($720 on 7/30/18) define important near-term support.
>>> FEATURED STOCK ARTICLE : Volume Totals Cooling While Consolidating Above Prior High - 7/20/2018 |
View all notes |
Set NEW NOTE alert |
Company Profile |
SEC
News |
Chart |
Request a new note
C
A
S
I |
Symbol/Exchange
Company Name
Industry Group |
PRICE |
CHANGE
(%Change) |
Day High |
Volume
(% DAV)
(% 50 day avg vol) |
52 Wk Hi
% From Hi |
Featured
Date |
Price
Featured |
Pivot Featured |
|
Max Buy |
CHDN
-
NASDAQ
Churchill Downs Inc
LEISURE - Gaming Activities
|
$282.25
|
+3.30
1.18% |
$283.30
|
44,487
76.70% of 50 DAV
50 DAV is 58,000
|
$314.60
-10.28%
|
6/20/2018
|
$285.80
|
PP = $314.70
|
|
MB = $330.44
|
Most Recent Note - 8/20/2018 12:27:46 PM
Its Relative Strength Rating has slumped to 76, below the 80+ minimum guideline for buy candidates. A rebound above its downward sloping 50 DMA line ($293) still is needed for its outlook to improve. Its 200 DMA line ($263) defines the next important support level. Fundamentals remain strong. It will be dropped from the Featured Stocks list tonight.
>>> FEATURED STOCK ARTICLE : Consolidating Near 50-Day Moving Average - 6/29/2018 |
View all notes |
Set NEW NOTE alert |
Company Profile |
SEC
News |
Chart |
Request a new note
C
A
S
I |
DPZ
-
NYSE
Dominos Pizza Inc
Retail-Restaurants
|
$284.75
|
-0.29
-0.10% |
$286.57
|
395,727
62.03% of 50 DAV
50 DAV is 638,000
|
$295.24
-3.55%
|
8/13/2018
|
$288.60
|
PP = $293.91
|
|
MB = $308.61
|
Most Recent Note - 8/20/2018 12:29:11 PM
Y - New pivot point was cited based on its 6/22/18 high plus 10 cents. Wedged up to a new 52-week high and has been stubbornly holding its ground. Subsequent gains above the pivot point backed by at least +40% above average volume may trigger a new (or add-on) technical buy signal.
>>> FEATURED STOCK ARTICLE : Consolidating Near 50-Day Moving Average Line - 7/23/2018 |
View all notes |
Set NEW NOTE alert |
Company Profile |
SEC
News |
Chart |
Request a new note
C
A
S
I |
FIVE
-
NASDAQ
Five Below Inc
Retail-DiscountandVariety
|
$111.14
|
+2.50
2.30% |
$112.55
|
985,337
102.21% of 50 DAV
50 DAV is 964,000
|
$109.09
1.88%
|
7/6/2018
|
$98.90
|
PP = $104.09
|
|
MB = $109.29
|
Most Recent Note - 8/16/2018 7:53:01 PM
Y - Quietly perched within close striking distance of its prior high. Its 50 DMA line ($100.81) defines near-term support above prior lows in the $95-96 area. Subsequent gains above the pivot point must have a minimum of +40% above average volume to trigger a proper technical buy signal. See the latest FSU analysis for more details and a new annotated graph.
>>> FEATURED STOCK ARTICLE : Volume Totals Cooling While Perched Near Record High - 8/16/2018 |
View all notes |
Set NEW NOTE alert |
Company Profile |
SEC
News |
Chart |
Request a new note
C
A
S
I |
NOW
-
NYSE
Servicenow Inc
Computer Sftwr-Enterprse
|
$181.36
|
+0.53
0.29% |
$181.92
|
1,661,506
100.76% of 50 DAV
50 DAV is 1,649,000
|
$194.81
-6.90%
|
5/8/2018
|
$174.63
|
PP = $176.66
|
|
MB = $185.49
|
Most Recent Note - 8/17/2018 6:09:10 PM
G - Slumped to a close below its 50 DMA line ($183) raising some concerns and the color code is changed to green. The recent low ($174) defines the next important near-term support. Fundamentals remain strong. See the latest FSU analysis for more details and a new annotated graph.
>>> FEATURED STOCK ARTICLE : Slump Below 50-Day Average Line Raises Concerns - 8/17/2018 |
View all notes |
Set NEW NOTE alert |
Company Profile |
SEC
News |
Chart |
Request a new note
C
A
S
I |
NVEE
-
NASDAQ
N V 5 Global Inc
Comml Svcs-Consulting
|
$86.15
|
+2.40
2.87% |
$86.50
|
59,966
82.15% of 50 DAV
50 DAV is 73,000
|
$91.55
-5.90%
|
6/15/2018
|
$7,070.00
|
PP = $72.00
|
|
MB = $75.60
|
Most Recent Note - 8/20/2018 5:16:27 PM
G - Priced a new Public Offering and gapped down on 8/09/18, yet it still remains perched near its all-time high. Its 50 DMA line ($74.62) and prior highs in the $71 area define near-term support to watch.
>>> FEATURED STOCK ARTICLE : Holding its Ground in Tight Range Near All-Time High - 6/28/2018 |
View all notes |
Set NEW NOTE alert |
Company Profile |
SEC
News |
Chart |
Request a new note
C
A
S
I |
Symbol/Exchange
Company Name
Industry Group |
PRICE |
CHANGE
(%Change) |
Day High |
Volume
(% DAV)
(% 50 day avg vol) |
52 Wk Hi
% From Hi |
Featured
Date |
Price
Featured |
Pivot Featured |
|
Max Buy |
PANW
-
NYSE
Palo Alto Networks
Computer Sftwr-Security
|
$212.62
|
-0.47
-0.22% |
$214.07
|
851,666
68.35% of 50 DAV
50 DAV is 1,246,000
|
$219.38
-3.08%
|
6/12/2018
|
$206.55
|
PP = $214.69
|
|
MB = $225.42
|
Most Recent Note - 8/20/2018 12:41:06 PM
Y - Very little resistance remains up to the $219 level. Consolidating near its 50 DMA line ($210). The prior low ($193 on 7/30/18) defines an important near-term support level.
>>> FEATURED STOCK ARTICLE : Violated 50-day Average With Volume-driven Loss - 7/31/2018 |
View all notes |
Set NEW NOTE alert |
Company Profile |
SEC
News |
Chart |
Request a new note
C
A
S
I |
QLYS
-
NASDAQ
Qualys Inc
Computer Sftwr-Security
|
$85.80
|
+0.05
0.06% |
$86.85
|
276,913
70.28% of 50 DAV
50 DAV is 394,000
|
$98.30
-12.71%
|
7/23/2018
|
$97.05
|
PP = $97.85
|
|
MB = $102.74
|
Most Recent Note - 8/20/2018 12:42:40 PM
G - Failing to rebound after damaging volume-driven losses. A rebound above the 50 DMA line ($89.92) still is needed for its outlook to improve.
>>> FEATURED STOCK ARTICLE : Computer Software-Security Firm Hovering Near All-Time High - 7/16/2018 |
View all notes |
Set NEW NOTE alert |
Company Profile |
SEC
News |
Chart |
Request a new note
C
A
S
I |
PAYC
-
NYSE
Paycom Software Inc
COMPUTER SOFTWARE and SERVICES - Application Software
|
$141.61
|
+1.74
1.24% |
$142.05
|
685,587
76.09% of 50 DAV
50 DAV is 901,000
|
$140.37
0.88%
|
8/1/2018
|
$122.87
|
PP = $118.55
|
|
MB = $124.48
|
Most Recent Note - 8/20/2018 5:20:07 PM
G - Hit another new all-time high with today's 3rd consecutive gain marked by below average volume, getting very extended from prior highs in the $118 area. Fundamentals remain strong.
>>> FEATURED STOCK ARTICLE : Bullish Action Followed Strong Earnings News - 8/1/2018 |
View all notes |
Set NEW NOTE alert |
Company Profile |
SEC
News |
Chart |
Request a new note
C
A
S
I |
GRUB
-
NYSE
Grubhub Inc
INTERNET - Content
|
$132.31
|
+4.91
3.85% |
$132.87
|
1,625,318
85.14% of 50 DAV
50 DAV is 1,909,000
|
$141.06
-6.20%
|
5/30/2018
|
$107.56
|
PP = $105.68
|
|
MB = $110.96
|
Most Recent Note - 8/17/2018 6:07:33 PM
G - Found support above the prior high ($120) and volume totals have been cooling. It has not formed a sound new base. Fundamentals remain strong. Patient investors may watch for a new base or secondary buy point to possibly develop and be noted in the weeks ahead.
>>> FEATURED STOCK ARTICLE : Hovering Near Record High Following Considerable Rally - 8/2/2018 |
View all notes |
Set NEW NOTE alert |
Company Profile |
SEC
News |
Chart |
Request a new note
C
A
S
I |
HQY
-
NASDAQ
Healthequity Inc
COMPUTER SOFTWARE and SERVICES - Healthcare Information Service
|
$86.33
|
-0.72
-0.83% |
$87.85
|
338,938
82.07% of 50 DAV
50 DAV is 413,000
|
$88.30
-2.23%
|
8/13/2018
|
$82.39
|
PP = $83.44
|
|
MB = $87.61
|
Most Recent Note - 8/20/2018 12:34:00 PM
Y - Perched at its all-time high after wedging higher with gains lacking great volume. It rose from an advanced ascending base with new pivot point cited based on its 7/23/18 high plus 10 cents. Prior low ($72.63 on 7/31/18) defines important near-term support to watch.
>>> FEATURED STOCK ARTICLE : Perched Near All-Time High After Testing Support at 50-Day Average - 7/25/2018 |
View all notes |
Set NEW NOTE alert |
Company Profile |
SEC
News |
Chart |
Request a new note
C
A
S
I |
Symbol/Exchange
Company Name
Industry Group |
PRICE |
CHANGE
(%Change) |
Day High |
Volume
(% DAV)
(% 50 day avg vol) |
52 Wk Hi
% From Hi |
Featured
Date |
Price
Featured |
Pivot Featured |
|
Max Buy |
LOB
-
NASDAQ
"Live Oak Bancshares, Inc."
Banks-Southeast
|
$29.75
|
+0.15
0.51% |
$29.85
|
62,087
37.00% of 50 DAV
50 DAV is 167,800
|
$32.95
-9.71%
|
5/21/2018
|
$29.35
|
PP = $30.15
|
|
MB = $31.66
|
Most Recent Note - 8/20/2018 12:35:10 PM
G - Its Relative Strength Rating has slumped to 79, below the 80+ minimum guideline. A rebound above the 50 DMA line ($30.52) still is needed for its outlook to improve. The recent low and 200 DMA line ($27.51) define important near-term chart support.
>>> FEATURED STOCK ARTICLE : Bank Making Gradual Progress After Support Found at 50-Day Average - 7/11/2018 |
View all notes |
Set NEW NOTE alert |
Company Profile |
SEC
News |
Chart |
Request a new note
C
A
S
I |
PYPL
-
NASDAQ
Paypal Holdings Inc
Finance-CrdtCard/PmtPr
|
$85.75
|
+0.30
0.35% |
$86.00
|
3,935,730
52.83% of 50 DAV
50 DAV is 7,450,000
|
$92.35
-7.15%
|
7/23/2018
|
$89.24
|
PP = $87.55
|
|
MB = $91.93
|
Most Recent Note - 8/20/2018 5:23:17 PM
Y - Consolidating near its 50 DMA line ($85.82) with volume totals cooling in recent weeks. Prior low in the $81 area defines important near-term support above its 200 DMA line ($79.75).
>>> FEATURED STOCK ARTICLE : Paypal Pulling Back From Record High - 7/26/2018 |
View all notes |
Set NEW NOTE alert |
Company Profile |
SEC
News |
Chart |
Request a new note
C
A
S
I |
OLLI
-
NASDAQ
Ollie's Bargain Outlet
Retail-DiscountandVariety
|
$77.65
|
+3.20
4.30% |
$77.95
|
1,066,916
133.87% of 50 DAV
50 DAV is 797,000
|
$77.50
0.19%
|
7/12/2018
|
$74.43
|
PP = $77.60
|
|
MB = $81.48
|
Most Recent Note - 8/17/2018 6:11:03 PM
Y - Rebounded above its 50 DMA line ($73.06) helping its outlook improve and its color code is changed to yellow. Volume-driven gains above the pivot point may trigger a new (or add-on) technical; buy signal. Fundamentals remain strong.
>>> FEATURED STOCK ARTICLE : Found Recent Support at 50-Day Moving Average Line - 7/5/2018 |
View all notes |
Set NEW NOTE alert |
Company Profile |
SEC
News |
Chart |
Request a new note
C
A
S
I |
NOVT
-
NASDAQ
Novanta Inc
Elec-Scientific/Msrng
|
$71.90
|
+0.80
1.13% |
$72.00
|
118,021
66.68% of 50 DAV
50 DAV is 177,000
|
$71.75
0.21%
|
7/12/2018
|
$65.90
|
PP = $68.10
|
|
MB = $71.51
|
Most Recent Note - 8/20/2018 12:37:45 PM
G - Color code is changed to green after quietly rising above its "max buy" level and hitting a new 52-week high. The 50 DMA line and prior low ($61.15 on 7/31/18) define important near-term support to watch on pullbacks.
>>> FEATURED STOCK ARTICLE : Gain Challenged 52-Week High and New Pivot Point - 7/12/2018 |
View all notes |
Set NEW NOTE alert |
Company Profile |
SEC
News |
Chart |
Request a new note
C
A
S
I |
TEAM
-
NASDAQ
Atlassian Corp Plc Cl A
Comp Sftwr-Spec Enterprs
|
$78.25
|
+0.23
0.29% |
$78.68
|
1,063,315
95.02% of 50 DAV
50 DAV is 1,119,000
|
$79.82
-1.97%
|
7/27/2018
|
$73.73
|
PP = $68.85
|
|
MB = $72.29
|
Most Recent Note - 8/20/2018 12:45:42 PM
G - Stubbornly holding its ground after recently wedging to new highs with gains lacking great volume conviction, and it is extended from any sound base. Fundamentals through Jun '18 have been strong.
>>> FEATURED STOCK ARTICLE : Pullback Following Recent technical Breakout - 7/30/2018 |
View all notes |
Set NEW NOTE alert |
Company Profile |
SEC
News |
Chart |
Request a new note
C
A
S
I |
Symbol/Exchange
Company Name
Industry Group |
PRICE |
CHANGE
(%Change) |
Day High |
Volume
(% DAV)
(% 50 day avg vol) |
52 Wk Hi
% From Hi |
Featured
Date |
Price
Featured |
Pivot Featured |
|
Max Buy |
SEND
-
NYSE
Sendgrid Inc
INTERNET - Content
|
$31.49
|
+0.24
0.77% |
$31.67
|
453,401
49.82% of 50 DAV
50 DAV is 910,000
|
$33.85
-6.97%
|
8/13/2018
|
$32.20
|
PP = $32.13
|
|
MB = $33.74
|
Most Recent Note - 8/20/2018 5:13:38 PM
Y - Slumped back in the prior base raising concerns soon after its 8/13/18 gain triggered a new technical buy signal. Prior lows in the $24 area define important support. Completed a new Public Offering and Secondary Offering on 4/05/18.
>>> FEATURED STOCK ARTICLE : Strength Returned After Finding Support Near Prior Lows - 8/14/2018 |
View all notes |
Set NEW NOTE alert |
Company Profile |
SEC
News |
Chart |
Request a new note
C
A
S
I |