***Last / Change / Volume data in this table is the closing quote data***
Symbol/Exchange
Company Name
Industry Group |
PRICE |
CHANGE
(%Change) |
Day High |
Volume
(% DAV)
(% 50 day avg vol) |
52 Wk Hi
% From Hi |
Featured
Date |
Price
Featured |
Pivot Featured |
|
Max Buy |
OSBC
-
NASDAQ
Old Second Bancorp Inc
BANKING - Regional - Midwest Banks
|
$15.20
|
-0.05
-0.33% |
$15.45
|
32,250
32.91% of 50 DAV
50 DAV is 98,000
|
$16.30
-6.75%
|
5/21/2018
|
$15.50
|
PP = $15.10
|
|
MB = $15.86
|
Most Recent Note - 8/3/2018 2:40:29 PM
Y - Met stubborn resistance after hitting a new high on 7/26/18 with a big volume-driven gain. Consolidating above its 50 DMA line ($15) while the prior low ($14) and 200 DMA line define additional near-term support. Its Relative Strength Rating improved to 81, above the 80+ minimum guideline for buy candidates. Fundamentals remain strong after it reported Jun '18 quarterly earnings +71% on +23% sales revenues.
>>> FEATURED STOCK ARTICLE : Consolidating Above 50-Day Moving Average - 7/9/2018 |
View all notes |
Set NEW NOTE alert |
Company Profile |
SEC
News |
Chart |
Request a new note
C
A
S
I |
SIVB
-
NASDAQ
S V B Financial Group
BANKING - Regional - Pacific Banks
|
$322.07
|
-2.70
-0.83% |
$328.17
|
331,028
65.94% of 50 DAV
50 DAV is 502,000
|
$333.74
-3.50%
|
8/6/2018
|
$314.77
|
PP = $329.75
|
|
MB = $346.24
|
Most Recent Note - 8/6/2018 6:21:16 PM
Y - Perched near its all-time high after today's 5th consecutive gain with near average volume. Color code is changed to yellow with new pivot point cited based on its 6/11/18 high plus 10 cents. Subsequent gains above the pivot point based by at least +40% above average volume may trigger a new technical buy signal. Reported earnings +91% on +40% sales revenues for the Jun '18 quarter, continuing its strong earnings track record. The 50 DMA line and recent low ($284.42 on 7/02/18) define near-term support to watch on pullbacks.
>>> FEATURED STOCK ARTICLE : Still Sputtering Below 50-Day Moving Average - 7/10/2018 |
View all notes |
Set NEW NOTE alert |
Company Profile |
SEC
News |
Chart |
Request a new note
C
A
S
I |
UCFC
-
NASDAQ
United Community Finl Cp
BANKING - Savings and Loans
|
$10.40
|
+0.00
0.00% |
$10.49
|
78,343
35.95% of 50 DAV
50 DAV is 217,900
|
$11.98
-13.19%
|
5/30/2018
|
$10.50
|
PP = $10.80
|
|
MB = $11.34
|
 Most Recent Note - 8/7/2018 7:52:13 PM
Still sputtering below its 50 DMA line and below the prior high ($10.70 on 4/19/18). Recently reported earnings +19% on +6% sales revenues for the Jun '18 quarter, below the +25% minimum earnings guideline (C criteria). It will be dropped from Featured Stocks list tonight.
>>> FEATURED STOCK ARTICLE : Consolidating Above 50-Day Average and Prior Highs - 7/17/2018 |
View all notes |
Set NEW NOTE alert |
Company Profile |
SEC
News |
Chart |
Request a new note
C
A
S
I |
ZBRA
-
NASDAQ
Zebra Tech Corp Cl A
COMPUTER HARDWARE - Computer Peripherals
|
$166.62
|
+24.47
17.21% |
$167.24
|
1,702,224
439.85% of 50 DAV
50 DAV is 387,000
|
$161.72
3.03%
|
8/7/2018
|
$164.26
|
PP = $161.82
|
|
MB = $169.91
|
Most Recent Note - 8/7/2018 7:47:02 PM
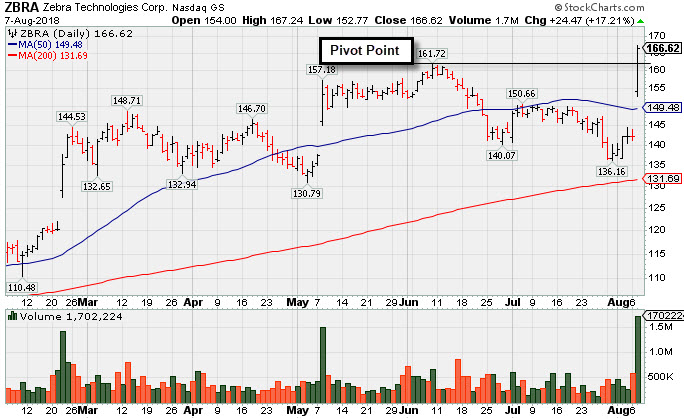
Y - Finished strong after highlighted in yellow with pivot point cited based on its 6/08/18 high plus 10 cents in the earlier mid-day report. Triggered a technical buy signal as it gapped up today hitting a new all-time high with more than 4 times average volume, rebounding from below its 50 DMA line. Reported Jun '18 earnings +64% on +13% sales revenues. Three of the past 4 quarters showed earnings increases above the +25% minimum guideline (C criteria). Recent sequential comparisons show encouraging sales revenues acceleration. Annual earnings (A criteria) history has been strong since a downturn in FY '08 and '09. See the latest FSU analysis for more details and a new annotated graph.
>>> FEATURED STOCK ARTICLE : Big Gain for New High Backed by Heavy Volume - 8/7/2018 |
View all notes |
Set NEW NOTE alert |
Company Profile |
SEC
News |
Chart |
Request a new note
C
A
S
I |
EPAM
-
NYSE
Epam Systems Inc
COMPUTER SOFTWARE and SERVICES - Information Technology Service
|
$131.22
|
+3.25
2.54% |
$132.47
|
810,114
152.56% of 50 DAV
50 DAV is 531,000
|
$137.73
-4.73%
|
7/5/2018
|
$123.70
|
PP = $131.85
|
|
MB = $138.44
|
Most Recent Note - 8/2/2018 1:05:38 PM
Y - Reported earnings +26% on +28% sales revenues for the Jun '18 quarter. Gapped down today violating its 50 DMA line ($127.02) and undercutting prior lows, trading near its 200 DMA line ($114.63) then rebounding near its 50 DMA line.
>>> FEATURED STOCK ARTICLE : Sputtering Below 50-Day Average After Negating Prior Breakout - 6/27/2018 |
View all notes |
Set NEW NOTE alert |
Company Profile |
SEC
News |
Chart |
Request a new note
C
A
S
I |
Symbol/Exchange
Company Name
Industry Group |
PRICE |
CHANGE
(%Change) |
Day High |
Volume
(% DAV)
(% 50 day avg vol) |
52 Wk Hi
% From Hi |
Featured
Date |
Price
Featured |
Pivot Featured |
|
Max Buy |
FLT
-
NYSE
Fleetcor Technologies
DIVERSIFIED SERVICES - Business/Management Services
|
$217.56
|
+0.71
0.33% |
$218.68
|
454,991
34.52% of 50 DAV
50 DAV is 1,318,000
|
$225.92
-3.70%
|
6/18/2018
|
$219.31
|
PP = $213.84
|
|
MB = $224.53
|
Most Recent Note - 8/3/2018 5:45:22 PM
Y - Loss on higher volume today tested its 50 DMA line and prior highs in the $212 area defining important near-term support. Reported earnings +29% on +8% sales revenues for the Jun '18 quarter, its 3rd consecutive quarterly comparison above the +25% minimum guideline (C criteria). See the latest FSU analysis for more details and a new annotated graph.
>>> FEATURED STOCK ARTICLE : Testing 50-Day Average With Loss on Higher Volume - 8/3/2018 |
View all notes |
Set NEW NOTE alert |
Company Profile |
SEC
News |
Chart |
Request a new note
C
A
S
I |
MA
-
NYSE
Mastercard Inc Cl A
Finance-CrdtCard/PmtPr
|
$202.62
|
+1.08
0.54% |
$203.15
|
2,422,229
72.05% of 50 DAV
50 DAV is 3,362,000
|
$214.28
-5.44%
|
7/11/2018
|
$203.84
|
PP = $204.10
|
|
MB = $214.31
|
Most Recent Note - 8/2/2018 6:09:49 PM
Y - Found prompt support near its 50 DMA line ($200) following another strong earnings report. Recent lows in the $193-196 area define important near-term support to watch.
>>> FEATURED STOCK ARTICLE : Extended From Prior Base and Perched at All-Time High - 6/20/2018 |
View all notes |
Set NEW NOTE alert |
Company Profile |
SEC
News |
Chart |
Request a new note
C
A
S
I |
V
-
NYSE
Visa Inc Cl A
Finance-CrdtCard/PmtPr
|
$140.28
|
+0.57
0.41% |
$140.69
|
10,034,495
130.34% of 50 DAV
50 DAV is 7,699,000
|
$143.14
-2.00%
|
4/26/2018
|
$126.68
|
PP = $126.98
|
|
MB = $133.33
|
Most Recent Note - 8/3/2018 2:42:33 PM
G - Remains perched near its all-time high after recent losses tested support near the prior high in the $136 area and its 50 DMA line ($135). Reported earnings +40% on +15% sales revenues for the Jun '18 quarter.
>>> FEATURED STOCK ARTICLE : Perched Near All-Time High After Rally From 50-Day Average - 7/27/2018 |
View all notes |
Set NEW NOTE alert |
Company Profile |
SEC
News |
Chart |
Request a new note
C
A
S
I |
ENV
-
NYSE
Envestnet Inc
FINANCIAL SERVICES - Diversified Investments
|
$61.65
|
+0.75
1.23% |
$61.95
|
308,816
95.31% of 50 DAV
50 DAV is 324,000
|
$62.95
-2.07%
|
6/15/2018
|
$57.85
|
PP = $60.37
|
|
MB = $63.39
|
Most Recent Note - 8/6/2018 6:29:03 PM
Y - Due to report Jun '18 earnings news after the close on Tuesday, August 7th. Volume and volatility often increase near earnings news. Posted 5 consecutive gains with light volume since its "positive reversal" on 7/31/18 tested support near its 50 DMA line ($57.64). Encountered distributional pressure after a volume-driven gain for a new high on 7/23/18 triggered a technical buy signal. The recent low ($53.75 on 6/28/18) and 200 DMA line define important near-term support. See the latest FSU analysis for more details and a new annotated graph.
>>> FEATURED STOCK ARTICLE : Earnings News Due for Financial Firm Perched Near High - 8/6/2018 |
View all notes |
Set NEW NOTE alert |
Company Profile |
SEC
News |
Chart |
Request a new note
C
A
S
I |
TPL
-
NYSE
Texas Pacific Land Trust
Real Estate Dvlpmt/Ops
|
$811.34
|
+7.24
0.90% |
$816.00
|
21,710
144.73% of 50 DAV
50 DAV is 15,000
|
$816.28
-0.61%
|
7/5/2018
|
$714.90
|
PP = $739.99
|
|
MB = $776.99
|
Most Recent Note - 8/2/2018 1:56:32 PM
G - Today's early gain nearly challenged its all-time high while adding to the prior volume-driven gain. Color code was changed to green after rising back above its "max buy" level. The 50 DMA line ($725.57) and recent low ($720 opn 7/30/18) define important near-term support
>>> FEATURED STOCK ARTICLE : Volume Totals Cooling While Consolidating Above Prior High - 7/20/2018 |
View all notes |
Set NEW NOTE alert |
Company Profile |
SEC
News |
Chart |
Request a new note
C
A
S
I |
Symbol/Exchange
Company Name
Industry Group |
PRICE |
CHANGE
(%Change) |
Day High |
Volume
(% DAV)
(% 50 day avg vol) |
52 Wk Hi
% From Hi |
Featured
Date |
Price
Featured |
Pivot Featured |
|
Max Buy |
STMP
-
NASDAQ
Stamps.com Inc
Retail-Internet
|
$263.45
|
-4.00
-1.50% |
$268.80
|
162,356
61.04% of 50 DAV
50 DAV is 266,000
|
$285.75
-7.80%
|
8/2/2018
|
$280.60
|
PP = $285.85
|
|
MB = $300.14
|
Most Recent Note - 8/6/2018 6:22:39 PM
Y - Posted a gain with light volume and closed above its 50 DMA line ($265.70) with today's gain. Recently met resistance near the prior high. Color code was changed to yellow with new pivot point cited based on its 6/18/18 high plus 10 cents. Reported Jun '18 quarterly earnings +32% on +20% sales revenues, continuing its strong earnings history. The prior low ($241.55 on 6/25/18) defines the next near-term support to watch.
>>> FEATURED STOCK ARTICLE : Big Loss on Heavy Volume Tests 50-Day Moving Average - 6/21/2018 |
View all notes |
Set NEW NOTE alert |
Company Profile |
SEC
News |
Chart |
Request a new note
C
A
S
I |
CHDN
-
NASDAQ
Churchill Downs Inc
LEISURE - Gaming Activities
|
$278.45
|
-2.25
-0.80% |
$283.20
|
32,238
48.85% of 50 DAV
50 DAV is 66,000
|
$314.60
-11.49%
|
6/20/2018
|
$285.80
|
PP = $314.70
|
|
MB = $330.44
|
Most Recent Note - 8/6/2018 6:16:28 PM
G - A rebound above the 50 DMA line ($297.59) is still needed for its outlook to improve. Reported +69% earnings on +12% sales revenues for the Jun '18 quarter versus the year ago period, continuing its strong earnings track record.
>>> FEATURED STOCK ARTICLE : Consolidating Near 50-Day Moving Average - 6/29/2018 |
View all notes |
Set NEW NOTE alert |
Company Profile |
SEC
News |
Chart |
Request a new note
C
A
S
I |
DPZ
-
NYSE
Dominos Pizza Inc
Retail-Restaurants
|
$277.45
|
-2.69
-0.96% |
$279.51
|
433,607
66.20% of 50 DAV
50 DAV is 655,000
|
$293.81
-5.57%
|
5/21/2018
|
$248.13
|
PP = $255.10
|
|
MB = $267.86
|
Most Recent Note - 8/7/2018 3:35:11 PM
Y - Color code is changed to yellow as its rebound above its 50 DMA line ($273) with recent gains helped its outlook to improve. Faces some near-term resistance up to the $293 level.
>>> FEATURED STOCK ARTICLE : Consolidating Near 50-Day Moving Average Line - 7/23/2018 |
View all notes |
Set NEW NOTE alert |
Company Profile |
SEC
News |
Chart |
Request a new note
C
A
S
I |
FIVE
-
NASDAQ
Five Below Inc
Retail-DiscountandVariety
|
$103.86
|
+2.98
2.95% |
$104.88
|
865,452
64.35% of 50 DAV
50 DAV is 1,345,000
|
$109.09
-4.79%
|
7/6/2018
|
$98.90
|
PP = $104.09
|
|
MB = $109.29
|
Most Recent Note - 8/7/2018 3:38:31 PM
Y - Rebounding near its prior high with a streak of 4 consecutive gains marked by light volume. Its 50 DMA line ($96.55) and recent lows define important near-term support to watch on pullbacks. Gains above the pivot point must have a minimum of +40% above average volume to trigger a proper technical buy signal.
>>> FEATURED STOCK ARTICLE : Hovering Near Record High After Big Gap Up and Volume-Driven Gain - 6/25/2018 |
View all notes |
Set NEW NOTE alert |
Company Profile |
SEC
News |
Chart |
Request a new note
C
A
S
I |
NOW
-
NYSE
Servicenow Inc
Computer Sftwr-Enterprse
|
$185.74
|
+1.08
0.58% |
$187.03
|
1,048,000
59.34% of 50 DAV
50 DAV is 1,766,000
|
$194.81
-4.66%
|
5/8/2018
|
$174.63
|
PP = $176.66
|
|
MB = $185.49
|
Most Recent Note - 8/2/2018 6:11:58 PM
Y - Color code is changed to yellow after rebounding above its 50 DMA line ($181.95) helping its outlook improve. The recent low ($167) defines the next important near-term support. Reported Jun '18 earnings +123% on +41% sales revenues, continuing its strong earnings history.
>>> FEATURED STOCK ARTICLE : Recent Slump Below 50-Day Average Hurt Outlook - 6/26/2018 |
View all notes |
Set NEW NOTE alert |
Company Profile |
SEC
News |
Chart |
Request a new note
C
A
S
I |
Symbol/Exchange
Company Name
Industry Group |
PRICE |
CHANGE
(%Change) |
Day High |
Volume
(% DAV)
(% 50 day avg vol) |
52 Wk Hi
% From Hi |
Featured
Date |
Price
Featured |
Pivot Featured |
|
Max Buy |
NVEE
-
NASDAQ
N V 5 Global Inc
Comml Svcs-Consulting
|
$90.95
|
+2.00
2.25% |
$91.55
|
76,194
120.94% of 50 DAV
50 DAV is 63,000
|
$90.60
0.39%
|
6/15/2018
|
$7,070.00
|
PP = $72.00
|
|
MB = $75.60
|
Most Recent Note - 8/6/2018 12:00:15 PM
G - Rallying further from the previously noted base with today's 5th consecutive gain on ever-increasing volume. Its 50 DMA line and prior highs in the $71 area define near-term support to watch on pullbacks.
>>> FEATURED STOCK ARTICLE : Holding its Ground in Tight Range Near All-Time High - 6/28/2018 |
View all notes |
Set NEW NOTE alert |
Company Profile |
SEC
News |
Chart |
Request a new note
C
A
S
I |
PANW
-
NYSE
Palo Alto Networks
Computer Sftwr-Security
|
$212.40
|
+0.99
0.47% |
$213.74
|
678,281
48.83% of 50 DAV
50 DAV is 1,389,000
|
$219.38
-3.18%
|
6/12/2018
|
$206.55
|
PP = $214.69
|
|
MB = $225.42
|
Most Recent Note - 8/7/2018 3:40:50 PM
Y - Rebound above the 50 DMA line ($209) helped its outlook to improve and its color code is changed to yellow. Very little resistance remains up to the $219 level.
>>> FEATURED STOCK ARTICLE : Violated 50-day Average With Volume-driven Loss - 7/31/2018 |
View all notes |
Set NEW NOTE alert |
Company Profile |
SEC
News |
Chart |
Request a new note
C
A
S
I |
QLYS
-
NASDAQ
Qualys Inc
Computer Sftwr-Security
|
$88.05
|
+0.55
0.63% |
$89.53
|
346,905
89.64% of 50 DAV
50 DAV is 387,000
|
$98.30
-10.43%
|
7/23/2018
|
$97.05
|
PP = $97.85
|
|
MB = $102.74
|
Most Recent Note - 8/7/2018 7:50:08 PM
G - Still sputtering below its 50 DMA line ($88.61) which may act as resistance after damaging volume-driven losses. A rebound above the 50 DMA line is needed for its outlook to improve.
>>> FEATURED STOCK ARTICLE : Computer Software-Security Firm Hovering Near All-Time High - 7/16/2018 |
View all notes |
Set NEW NOTE alert |
Company Profile |
SEC
News |
Chart |
Request a new note
C
A
S
I |
SUPN
-
NASDAQ
Supernus Pharmaceuticals
Medical-Biomed/Biotech
|
$53.35
|
+0.35
0.66% |
$54.70
|
786,873
110.36% of 50 DAV
50 DAV is 713,000
|
$61.25
-12.90%
|
6/20/2018
|
$58.05
|
PP = $59.15
|
|
MB = $62.11
|
Most Recent Note - 8/7/2018 3:41:38 PM
G - Still meeting resistance at its 50 DMA line ($54.77), and subsequent gains above that short-term average are needed for its outlook to improve. Deterioration below the recent low ($49.75 on 7/09/18) would raise more serious concerns.
>>> FEATURED STOCK ARTICLE : Met Resistance at 50-Day Moving Average - 7/24/2018 |
View all notes |
Set NEW NOTE alert |
Company Profile |
SEC
News |
Chart |
Request a new note
C
A
S
I |
PAYC
-
NYSE
Paycom Software Inc
COMPUTER SOFTWARE and SERVICES - Application Software
|
$134.40
|
-0.08
-0.06% |
$136.80
|
600,609
66.22% of 50 DAV
50 DAV is 907,000
|
$135.85
-1.07%
|
8/1/2018
|
$122.87
|
PP = $118.55
|
|
MB = $124.48
|
Most Recent Note - 8/2/2018 1:39:49 PM
G - Color code is changed to green after quickly getting very extended from prior highs. Finished strong on the prior session after highlighted in yellow with new pivot point cited based on its 4/18/18 high plus 10 cents. Reported earnings +69% on +31% sales revenues for the Jun '18 quarter, continuing its strong earnings track record.
>>> FEATURED STOCK ARTICLE : Bullish Action Followed Strong Earnings News - 8/1/2018 |
View all notes |
Set NEW NOTE alert |
Company Profile |
SEC
News |
Chart |
Request a new note
C
A
S
I |
Symbol/Exchange
Company Name
Industry Group |
PRICE |
CHANGE
(%Change) |
Day High |
Volume
(% DAV)
(% 50 day avg vol) |
52 Wk Hi
% From Hi |
Featured
Date |
Price
Featured |
Pivot Featured |
|
Max Buy |
GRUB
-
NYSE
Grubhub Inc
INTERNET - Content
|
$128.64
|
-0.41
-0.32% |
$130.65
|
1,075,956
53.88% of 50 DAV
50 DAV is 1,997,000
|
$141.06
-8.80%
|
5/30/2018
|
$107.56
|
PP = $105.68
|
|
MB = $110.96
|
Most Recent Note - 8/2/2018 6:06:51 PM
G - Consolidating above the prior high ($120), extended from the previously noted base. Fundamentals remain strong. Patient investors may watch for a new base or secondary buy point to develop and be noted in the weeks ahead. See the latest FSU analysis for more details and a new annotated graph.
>>> FEATURED STOCK ARTICLE : Hovering Near Record High Following Considerable Rally - 8/2/2018 |
View all notes |
Set NEW NOTE alert |
Company Profile |
SEC
News |
Chart |
Request a new note
C
A
S
I |
HQY
-
NASDAQ
Healthequity Inc
COMPUTER SOFTWARE and SERVICES - Healthcare Information Service
|
$80.85
|
+0.94
1.18% |
$81.27
|
192,429
38.18% of 50 DAV
50 DAV is 504,000
|
$83.34
-2.99%
|
5/2/2018
|
$66.31
|
PP = $68.85
|
|
MB = $72.29
|
Most Recent Note - 8/3/2018 2:35:57 PM
G - Meeting resistance and reversing into the red today while trying to rebound above its 50 DMA line ($78.81). Prior lows ($70.16 on 6/28/18) define important near-term support to watch.
>>> FEATURED STOCK ARTICLE : Perched Near All-Time High After Testing Support at 50-Day Average - 7/25/2018 |
View all notes |
Set NEW NOTE alert |
Company Profile |
SEC
News |
Chart |
Request a new note
C
A
S
I |
LOB
-
NASDAQ
"Live Oak Bancshares, Inc."
Banks-Southeast
|
$29.45
|
-0.20
-0.67% |
$29.95
|
160,186
92.54% of 50 DAV
50 DAV is 173,100
|
$32.95
-10.62%
|
5/21/2018
|
$29.35
|
PP = $30.15
|
|
MB = $31.66
|
Most Recent Note - 8/3/2018 2:37:53 PM
G - The recent low and 200 DMA line ($27.33) define important near-term chart support. A rebound above the 50 DMA line ($30.60) still is needed for its outlook to improve.
>>> FEATURED STOCK ARTICLE : Bank Making Gradual Progress After Support Found at 50-Day Average - 7/11/2018 |
View all notes |
Set NEW NOTE alert |
Company Profile |
SEC
News |
Chart |
Request a new note
C
A
S
I |
PYPL
-
NASDAQ
Paypal Holdings Inc
Finance-CrdtCard/PmtPr
|
$86.30
|
+0.53
0.62% |
$86.99
|
4,882,346
62.80% of 50 DAV
50 DAV is 7,774,000
|
$92.35
-6.55%
|
7/23/2018
|
$89.24
|
PP = $87.55
|
|
MB = $91.93
|
Most Recent Note - 8/2/2018 6:04:59 PM
Y - Recently endured distributional pressure, yet rebounded above its 50 DMA line with lighter volume behind today's big gain. Prior low defines important near-term support in the $81 area.
>>> FEATURED STOCK ARTICLE : Paypal Pulling Back From Record High - 7/26/2018 |
View all notes |
Set NEW NOTE alert |
Company Profile |
SEC
News |
Chart |
Request a new note
C
A
S
I |
OLLI
-
NASDAQ
Ollie's Bargain Outlet
Retail-DiscountandVariety
|
$70.45
|
+0.95
1.37% |
$70.95
|
400,885
44.44% of 50 DAV
50 DAV is 902,000
|
$77.50
-9.10%
|
7/12/2018
|
$74.43
|
PP = $77.60
|
|
MB = $81.48
|
Most Recent Note - 8/2/2018 6:17:15 PM
G - Recent action has been distributional, and its outlook get worse the longer it lingers below its 50 DMA line ($73.08).
>>> FEATURED STOCK ARTICLE : Found Recent Support at 50-Day Moving Average Line - 7/5/2018 |
View all notes |
Set NEW NOTE alert |
Company Profile |
SEC
News |
Chart |
Request a new note
C
A
S
I |
Symbol/Exchange
Company Name
Industry Group |
PRICE |
CHANGE
(%Change) |
Day High |
Volume
(% DAV)
(% 50 day avg vol) |
52 Wk Hi
% From Hi |
Featured
Date |
Price
Featured |
Pivot Featured |
|
Max Buy |
NOVT
-
NASDAQ
Novanta Inc
Elec-Scientific/Msrng
|
$66.85
|
-0.20
-0.30% |
$68.00
|
156,573
80.29% of 50 DAV
50 DAV is 195,000
|
$69.90
-4.36%
|
7/12/2018
|
$65.90
|
PP = $68.10
|
|
MB = $71.51
|
Most Recent Note - 8/3/2018 2:48:58 PM
G - Sputtering near its 50 DMA line ($65.06) after finding support above its prior low ($59.25 on 6/25/18). More damaging losses would raise serious concerns
>>> FEATURED STOCK ARTICLE : Gain Challenged 52-Week High and New Pivot Point - 7/12/2018 |
View all notes |
Set NEW NOTE alert |
Company Profile |
SEC
News |
Chart |
Request a new note
C
A
S
I |
BZUN
-
NASDAQ
Baozun Inc Cl A Ads
Computer Sftwr-Enterprse
|
$58.04
|
+1.89
3.37% |
$58.66
|
1,323,380
70.66% of 50 DAV
50 DAV is 1,873,000
|
$67.41
-13.90%
|
5/15/2018
|
$45.38
|
PP = $52.43
|
|
MB = $55.05
|
Most Recent Note - 8/7/2018 3:42:53 PM
G - Still sputtering below its 50 DMA line ($60.01). The recent low ($51.50 on 6/27/18) defines the next important chart support.
>>> FEATURED STOCK ARTICLE : Found Support Near Prior Highs and 50 Day Moving Average - 7/6/2018 |
View all notes |
Set NEW NOTE alert |
Company Profile |
SEC
News |
Chart |
Request a new note
C
A
S
I |
TEAM
-
NASDAQ
Atlassian Corp Plc Cl A
Comp Sftwr-Spec Enterprs
|
$75.98
|
+0.43
0.57% |
$76.61
|
1,086,855
85.31% of 50 DAV
50 DAV is 1,274,000
|
$79.82
-4.81%
|
7/27/2018
|
$73.73
|
PP = $68.85
|
|
MB = $72.29
|
Most Recent Note - 8/6/2018 6:25:14 PM
G - Posted a gain today with +20% above average volume for a best-ever close, rising above its "max buy" level, and its color code is changed to green. It was highlighted in yellow with pivot point cited based on its 6/06/18 high plus 10 cents. This Australia - based software developer reported earnings +44% on +40% sales revenues for the Jun '18 quarter helping it better match with the fact-based investment system's guidelines.
>>> FEATURED STOCK ARTICLE : Pullback Following Recent technical Breakout - 7/30/2018 |
View all notes |
Set NEW NOTE alert |
Company Profile |
SEC
News |
Chart |
Request a new note
C
A
S
I |