***Last / Change / Volume data in this table is the closing quote data***
Symbol/Exchange
Company Name
Industry Group |
PRICE |
CHANGE
(%Change) |
Day High |
Volume
(% DAV)
(% 50 day avg vol) |
52 Wk Hi
% From Hi |
Featured
Date |
Price
Featured |
Pivot Featured |
|
Max Buy |
OSBC
-
NASDAQ
Old Second Bancorp Inc
BANKING - Regional - Midwest Banks
|
$15.40
|
-0.15
-0.96% |
$15.60
|
47,406
49.80% of 50 DAV
50 DAV is 95,200
|
$16.30
-5.52%
|
5/21/2018
|
$15.50
|
PP = $15.10
|
|
MB = $15.86
|
Most Recent Note - 8/23/2018 8:10:20 PM
G - Consolidating above its 50 DMA line ($15.10) while the prior low ($14) and 200 DMA line define additional near-term support. Met stubborn resistance after hitting a new high on 7/26/18 with a big volume-driven gain. Its Relative Strength Rating has slumped to 78, below the 80+ minimum guideline for buy candidates. Fundamentals remain strong after it reported Jun '18 quarterly earnings +71% on +23% sales revenues. See the latest FSU analysis for more details and a new annotated graph.
>>> FEATURED STOCK ARTICLE : Bank Perched Less Than -5% Off Record High - 8/23/2018 |
View all notes |
Set NEW NOTE alert |
Company Profile |
SEC
News |
Chart |
Request a new note
C
A
S
I |
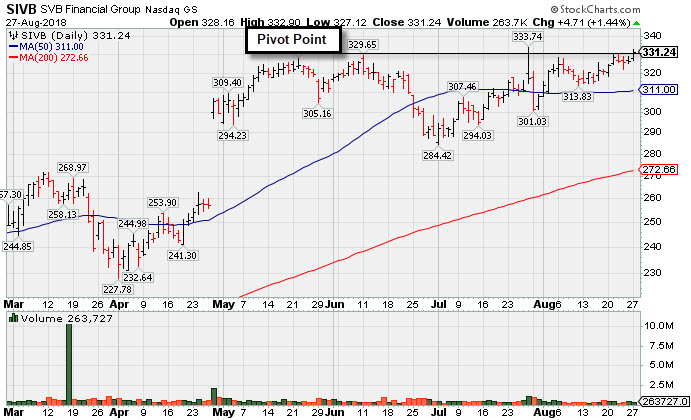
SIVB
-
NASDAQ
S V B Financial Group
BANKING - Regional - Pacific Banks
|
$331.24
|
+4.71
1.44% |
$332.90
|
261,892
56.32% of 50 DAV
50 DAV is 465,000
|
$333.74
-0.75%
|
8/6/2018
|
$314.77
|
PP = $329.75
|
|
MB = $346.24
|
 Most Recent Note - 8/27/2018 6:01:51 PM
Y - Posted a quiet gain today for a best ever close. Met resistance in recent weeks near prior highs. Subsequent gains above the pivot point backed by at least +40% above average volume may trigger a convincing new technical buy signal. The 50 DMA line ($311) defines near-term support to watch on pullbacks. Fundamentals remain strong. see the latest FSU analysis for more details and a new annotated graph.
>>> FEATURED STOCK ARTICLE : Bank Posted Quiet Gain for a Best-Ever Close - 8/27/2018 |
View all notes |
Set NEW NOTE alert |
Company Profile |
SEC
News |
Chart |
Request a new note
C
A
S
I |
ZBRA
-
NASDAQ
Zebra Tech Corp Cl A
COMPUTER HARDWARE - Computer Peripherals
|
$170.07
|
+1.16
0.69% |
$171.26
|
233,027
56.42% of 50 DAV
50 DAV is 413,000
|
$171.23
-0.68%
|
8/7/2018
|
$164.26
|
PP = $161.82
|
|
MB = $169.91
|
Most Recent Note - 8/27/2018 6:04:50 PM
G - Color code is changed to green after a gain above its "max buy" level today with light volume for its best ever close. Prior high in the $161 area defines initial support above its 50 DMA line ($150) Fundamentals remain strong.
>>> FEATURED STOCK ARTICLE : Big Gain for New High Backed by Heavy Volume - 8/7/2018 |
View all notes |
Set NEW NOTE alert |
Company Profile |
SEC
News |
Chart |
Request a new note
C
A
S
I |
EPAM
-
NYSE
Epam Systems Inc
COMPUTER SOFTWARE and SERVICES - Information Technology Service
|
$142.15
|
+1.15
0.82% |
$142.92
|
291,940
50.08% of 50 DAV
50 DAV is 583,000
|
$141.03
0.79%
|
7/5/2018
|
$123.70
|
PP = $131.85
|
|
MB = $138.44
|
Most Recent Note - 8/27/2018 5:40:45 PM
G - Posted a 10th consecutive gain today hitting a new all-time high and its color code is changed to green. Recently found support above its 50 DMA line ($130). Fundamentals remain strong.
>>> FEATURED STOCK ARTICLE : Tech Services Firm Remains Fundamentally and Technically Strong - 8/20/2018 |
View all notes |
Set NEW NOTE alert |
Company Profile |
SEC
News |
Chart |
Request a new note
C
A
S
I |
FLT
-
NYSE
Fleetcor Technologies
DIVERSIFIED SERVICES - Business/Management Services
|
$219.42
|
+1.33
0.61% |
$221.06
|
450,119
37.23% of 50 DAV
50 DAV is 1,209,000
|
$225.92
-2.88%
|
6/18/2018
|
$219.31
|
PP = $213.84
|
|
MB = $224.53
|
Most Recent Note - 8/27/2018 5:42:32 PM
Y - Consolidating above its 50 DMA line ($217) with volume totals cooling in recent weeks. The prior low ($210.64 on 8/03/18) defines important near-term support above its 200 DMA line($202). Fundamentals remain strong.
>>> FEATURED STOCK ARTICLE : Testing 50-Day Average With Loss on Higher Volume - 8/3/2018 |
View all notes |
Set NEW NOTE alert |
Company Profile |
SEC
News |
Chart |
Request a new note
C
A
S
I |
Symbol/Exchange
Company Name
Industry Group |
PRICE |
CHANGE
(%Change) |
Day High |
Volume
(% DAV)
(% 50 day avg vol) |
52 Wk Hi
% From Hi |
Featured
Date |
Price
Featured |
Pivot Featured |
|
Max Buy |
MA
-
NYSE
Mastercard Inc Cl A
Finance-CrdtCard/PmtPr
|
$211.53
|
+2.13
1.02% |
$211.75
|
2,520,167
80.67% of 50 DAV
50 DAV is 3,124,000
|
$214.28
-1.28%
|
7/11/2018
|
$203.84
|
PP = $204.10
|
|
MB = $214.31
|
Most Recent Note - 8/27/2018 5:49:38 PM
Y - Posted a 4th consecutive gain today with light volume for its second best close ever. Its 50 DMA line ($202) defines support above the prior lows in the $193-196 area. Fundamentals remain strong.
>>> FEATURED STOCK ARTICLE : Found Support Near 50-Day Moving Average Line - 8/10/2018 |
View all notes |
Set NEW NOTE alert |
Company Profile |
SEC
News |
Chart |
Request a new note
C
A
S
I |
V
-
NYSE
Visa Inc Cl A
Finance-CrdtCard/PmtPr
|
$145.40
|
+1.20
0.83% |
$145.60
|
7,170,683
99.59% of 50 DAV
50 DAV is 7,200,000
|
$144.38
0.71%
|
4/26/2018
|
$126.68
|
PP = $126.98
|
|
MB = $133.33
|
Most Recent Note - 8/24/2018 4:55:11 PM
G - Hit another new all-time high with today's gain backed by light volume. Its 50 DMA line ($138) and recent low ($135.31 on 7/30/18) define important near-term support to watch on pullbacks. Fundamentals remain strong.
>>> FEATURED STOCK ARTICLE : Perched Near All-Time High After Rally From 50-Day Average - 7/27/2018 |
View all notes |
Set NEW NOTE alert |
Company Profile |
SEC
News |
Chart |
Request a new note
C
A
S
I |
NANO
-
NASDAQ
Nanometrics Inc
ELECTRONICS - Scientific and Technical Instrum
|
$44.53
|
+0.39
0.88% |
$46.42
|
466,620
124.10% of 50 DAV
50 DAV is 376,000
|
$48.26
-7.73%
|
8/13/2018
|
$44.17
|
PP = $44.27
|
|
MB = $46.48
|
Most Recent Note - 8/27/2018 12:43:41 PM
Y - Rallying back above its pivot point with higher volume behind today's 3rd consecutive gain, perched within close striking distance of its 52-week high. The 50 DMA line ($39.18) defines important near-term support. Recent quarters through Jun '18 showed much better sales and earnings increases versus the year earlier. Annual earnings (A criteria) have improved greatly since a downturn and losses FY '13 and '14.
>>> FEATURED STOCK ARTICLE : Five Times Average Volume Behind Breakout Gain - 8/13/2018 |
View all notes |
Set NEW NOTE alert |
Company Profile |
SEC
News |
Chart |
Request a new note
C
A
S
I |
ENV
-
NYSE
Envestnet Inc
FINANCIAL SERVICES - Diversified Investments
|
$62.50
|
+0.55
0.89% |
$62.80
|
269,363
84.18% of 50 DAV
50 DAV is 320,000
|
$62.95
-0.71%
|
6/15/2018
|
$57.85
|
PP = $60.37
|
|
MB = $63.39
|
Most Recent Note - 8/27/2018 5:38:32 PM
Y - Posted a 4th consecutive gain today with below average volume and ended the session at a best-ever close. Found prompt support near its 50 DMA line ($58.95) in recent weeks. Its Relative Strength Rating has improved to 85, above the 80+ minimum guideline for buy candidates. Fundamentals remain strong.
>>> FEATURED STOCK ARTICLE : Earnings News Due for Financial Firm Perched Near High - 8/6/2018 |
View all notes |
Set NEW NOTE alert |
Company Profile |
SEC
News |
Chart |
Request a new note
C
A
S
I |
TPL
-
NYSE
Texas Pacific Land Trust
Real Estate Dvlpmt/Ops
|
$856.58
|
+9.58
1.13% |
$874.00
|
18,674
133.39% of 50 DAV
50 DAV is 14,000
|
$848.44
0.96%
|
7/5/2018
|
$714.90
|
PP = $739.99
|
|
MB = $776.99
|
Most Recent Note - 8/27/2018 12:55:30 PM
G - Hitting yet another new all-time high with today's gain adding to a recent streak, getting more extended from any sound base. The 50 DMA line ($763) and recent low ($720 on 7/30/18) define important near-term support to watch on pullbacks.
>>> FEATURED STOCK ARTICLE : Volume Totals Cooling While Consolidating Above Prior High - 7/20/2018 |
View all notes |
Set NEW NOTE alert |
Company Profile |
SEC
News |
Chart |
Request a new note
C
A
S
I |
Symbol/Exchange
Company Name
Industry Group |
PRICE |
CHANGE
(%Change) |
Day High |
Volume
(% DAV)
(% 50 day avg vol) |
52 Wk Hi
% From Hi |
Featured
Date |
Price
Featured |
Pivot Featured |
|
Max Buy |
DPZ
-
NYSE
Dominos Pizza Inc
Retail-Restaurants
|
$297.89
|
-0.06
-0.02% |
$300.00
|
452,937
72.35% of 50 DAV
50 DAV is 626,000
|
$300.34
-0.82%
|
8/13/2018
|
$288.60
|
PP = $293.91
|
|
MB = $308.61
|
Most Recent Note - 8/27/2018 5:35:38 PM
Y - Wedged up to a new 52-week high and it has been stubbornly holding its ground. Subsequent gains above the pivot point backed by at least +40% above average volume may trigger a new (or add-on) technical buy signal.
>>> FEATURED STOCK ARTICLE : Consolidating Near 50-Day Moving Average Line - 7/23/2018 |
View all notes |
Set NEW NOTE alert |
Company Profile |
SEC
News |
Chart |
Request a new note
C
A
S
I |
FIVE
-
NASDAQ
Five Below Inc
Retail-DiscountandVariety
|
$114.59
|
-0.20
-0.17% |
$115.78
|
561,410
66.05% of 50 DAV
50 DAV is 850,000
|
$115.60
-0.87%
|
7/6/2018
|
$98.90
|
PP = $104.09
|
|
MB = $109.29
|
Most Recent Note - 8/21/2018 5:09:13 PM
G - Color code is changed to green after rising above its "max buy" level with average volume behind today's 4th consecutive gain. Its 50 DMA line ($101.41) defines near-term support above prior lows in the $95-96 area. Recent gains above the pivot point lacked the minimum of +40% above average volume needed to trigger a proper technical buy signal.
>>> FEATURED STOCK ARTICLE : Volume Totals Cooling While Perched Near Record High - 8/16/2018 |
View all notes |
Set NEW NOTE alert |
Company Profile |
SEC
News |
Chart |
Request a new note
C
A
S
I |
NOW
-
NYSE
Servicenow Inc
Computer Sftwr-Enterprse
|
$193.25
|
-0.31
-0.16% |
$196.63
|
1,711,422
102.66% of 50 DAV
50 DAV is 1,667,000
|
$194.81
-0.80%
|
8/24/2018
|
$193.83
|
PP = $194.91
|
|
MB = $204.66
|
Most Recent Note - 8/24/2018 12:58:24 PM
Y - Challenging its 52-week high with today's 5th consecutive gain. Found prompt support near its 50 DMA line again recently. Color code is changed to yellow with new pivot point cited based on its 7/12/18 high plus 10 cents. The recent low ($174) defines the next important near-term support. Fundamentals remain strong. Subsequent gains above the pivot point backed by +40% above average volume may trigger a new (or add-on) technical buy signal.
>>> FEATURED STOCK ARTICLE : Slump Below 50-Day Average Line Raises Concerns - 8/17/2018 |
View all notes |
Set NEW NOTE alert |
Company Profile |
SEC
News |
Chart |
Request a new note
C
A
S
I |
NVEE
-
NASDAQ
N V 5 Global Inc
Comml Svcs-Consulting
|
$89.50
|
+3.00
3.47% |
$90.60
|
91,117
118.33% of 50 DAV
50 DAV is 77,000
|
$91.55
-2.24%
|
6/15/2018
|
$7,070.00
|
PP = $72.00
|
|
MB = $75.60
|
Most Recent Note - 8/21/2018 5:04:20 PM
G - Posted a gain today with above average volume. Priced a new Public Offering and gapped down on 8/09/18. Remains perched near its all-time high. Its 50 DMA line ($75.10) and prior highs in the $71 area define near-term support to watch. See the latest FSU analysis for more details and a new annotated graph.
>>> FEATURED STOCK ARTICLE : Remains Perched Near All-Time High Following Offering - 8/21/2018 |
View all notes |
Set NEW NOTE alert |
Company Profile |
SEC
News |
Chart |
Request a new note
C
A
S
I |
PANW
-
NYSE
Palo Alto Networks
Computer Sftwr-Security
|
$226.75
|
+1.32
0.59% |
$227.49
|
1,235,098
104.85% of 50 DAV
50 DAV is 1,178,000
|
$226.71
0.02%
|
6/12/2018
|
$206.55
|
PP = $214.69
|
|
MB = $225.42
|
Most Recent Note - 8/24/2018 4:58:08 PM
Y - Hit a new all-time high with today's big gain backed by +72% above average volume triggering a new (or add-on) technical buy signal. Its 50 DMA line ($210) defines initial support above the prior low ($193 on 7/30/18).
>>> FEATURED STOCK ARTICLE : Violated 50-day Average With Volume-driven Loss - 7/31/2018 |
View all notes |
Set NEW NOTE alert |
Company Profile |
SEC
News |
Chart |
Request a new note
C
A
S
I |
Symbol/Exchange
Company Name
Industry Group |
PRICE |
CHANGE
(%Change) |
Day High |
Volume
(% DAV)
(% 50 day avg vol) |
52 Wk Hi
% From Hi |
Featured
Date |
Price
Featured |
Pivot Featured |
|
Max Buy |
QLYS
-
NASDAQ
Qualys Inc
Computer Sftwr-Security
|
$91.25
|
+1.20
1.33% |
$91.75
|
389,373
107.27% of 50 DAV
50 DAV is 363,000
|
$98.30
-7.17%
|
7/23/2018
|
$97.05
|
PP = $97.85
|
|
MB = $102.74
|
Most Recent Note - 8/27/2018 5:56:13 PM
Y- Rebounded above the 50 DMA line ($89.67) with today's 4th consecutive gain helping its outlook improve and its color code is changed to yellow. Faces some near-term resistance due to overhead supply up to the $98 level.
>>> FEATURED STOCK ARTICLE : Computer Software-Security Firm Hovering Near All-Time High - 7/16/2018 |
View all notes |
Set NEW NOTE alert |
Company Profile |
SEC
News |
Chart |
Request a new note
C
A
S
I |
ANET
-
NYSE
Arista Networks Inc
TELECOMMUNICATIONS - Communication Equipment
|
$304.79
|
-3.79
-1.23% |
$312.50
|
11,154,944
1,415.60% of 50 DAV
50 DAV is 788,000
|
$313.37
-2.74%
|
8/24/2018
|
$308.26
|
PP = $311.77
|
|
MB = $327.36
|
Most Recent Note - 8/27/2018 12:06:58 PM
Y - Holding its ground today. Subsequent volume-driven gains and a strong close above the pivot point would be reassuring. Color code was changed to yellow with new pivot point cited based on its 2/15/18 high plus 10 cents when it gapped up for a considerable volume-driven gain on 8/24/18, reaching a new all-time high. Found support above its 200 DMA line during the choppy consolidation since dropped from the Featured Stocks list on 2/21/18. Fundamentals remain strong after it reported earnings +44% on +28% sales revenues for the Jun '18 quarter. See the latest FSU analysis for more details and an annotated graph.
>>> FEATURED STOCK ARTICLE : Considerable Gap Up Gain With Heavy Volume - 8/24/2018 |
View all notes |
Set NEW NOTE alert |
Company Profile |
SEC
News |
Chart |
Request a new note
C
A
S
I |
PAYC
-
NYSE
Paycom Software Inc
COMPUTER SOFTWARE and SERVICES - Application Software
|
$151.47
|
+0.53
0.35% |
$153.60
|
650,407
72.83% of 50 DAV
50 DAV is 893,000
|
$150.95
0.34%
|
8/1/2018
|
$122.87
|
PP = $118.55
|
|
MB = $124.48
|
Most Recent Note - 8/27/2018 5:51:08 PM
G - Hit yet another new all-time high with today's 8th consecutive gain marked by below average volume, getting very extended from prior highs in the $118 area. Fundamentals remain strong.
>>> FEATURED STOCK ARTICLE : Bullish Action Followed Strong Earnings News - 8/1/2018 |
View all notes |
Set NEW NOTE alert |
Company Profile |
SEC
News |
Chart |
Request a new note
C
A
S
I |
GRUB
-
NYSE
Grubhub Inc
INTERNET - Content
|
$139.86
|
+1.42
1.03% |
$140.87
|
636,928
34.26% of 50 DAV
50 DAV is 1,859,000
|
$141.06
-0.85%
|
8/24/2018
|
$138.44
|
PP = $141.16
|
|
MB = $148.22
|
Most Recent Note - 8/24/2018 4:50:47 PM
Y - Perched near its all-time high today after 5 consecutive gains with lighter than average volume. Color code is changed to yellow with new pivot point cited based on its 7/26/18 high plus 10 cents. Subsequent gains backed by at least +40% above average volume would trigger a new (or add-on) technical buy signal.
>>> FEATURED STOCK ARTICLE : Hovering Near Record High Following Considerable Rally - 8/2/2018 |
View all notes |
Set NEW NOTE alert |
Company Profile |
SEC
News |
Chart |
Request a new note
C
A
S
I |
HQY
-
NASDAQ
Healthequity Inc
COMPUTER SOFTWARE and SERVICES - Healthcare Information Service
|
$90.99
|
+2.75
3.12% |
$91.66
|
557,104
142.48% of 50 DAV
50 DAV is 391,000
|
$89.09
2.13%
|
8/13/2018
|
$82.39
|
PP = $83.44
|
|
MB = $87.61
|
Most Recent Note - 8/27/2018 5:45:48 PM
G - Hit another new all-time high with today's 2nd consecutive volume-driven gain and its color code is changed to green. Prior highs in the $82-83 area define initial support above its 50 DMA line ($81).
>>> FEATURED STOCK ARTICLE : Perched Near All-Time High After Testing Support at 50-Day Average - 7/25/2018 |
View all notes |
Set NEW NOTE alert |
Company Profile |
SEC
News |
Chart |
Request a new note
C
A
S
I |
Symbol/Exchange
Company Name
Industry Group |
PRICE |
CHANGE
(%Change) |
Day High |
Volume
(% DAV)
(% 50 day avg vol) |
52 Wk Hi
% From Hi |
Featured
Date |
Price
Featured |
Pivot Featured |
|
Max Buy |
LOB
-
NASDAQ
"Live Oak Bancshares, Inc."
Banks-Southeast
|
$30.10
|
-0.05
-0.17% |
$30.60
|
66,884
40.56% of 50 DAV
50 DAV is 164,900
|
$32.95
-8.65%
|
5/21/2018
|
$29.35
|
PP = $30.15
|
|
MB = $31.66
|
Most Recent Note - 8/27/2018 5:47:04 PM
G - Its Relative Strength Rating is still 79, below the 80+ minimum guideline. Volume totals have cooled in recent weeks. A rebound above the 50 DMA line ($30.56) still is needed for its outlook to improve. The recent low and 200 DMA line ($27.51) define important near-term chart support.
>>> FEATURED STOCK ARTICLE : Bank Making Gradual Progress After Support Found at 50-Day Average - 7/11/2018 |
View all notes |
Set NEW NOTE alert |
Company Profile |
SEC
News |
Chart |
Request a new note
C
A
S
I |
PYPL
-
NASDAQ
Paypal Holdings Inc
Finance-CrdtCard/PmtPr
|
$89.97
|
-0.13
-0.14% |
$91.32
|
5,395,067
74.46% of 50 DAV
50 DAV is 7,246,000
|
$92.35
-2.58%
|
7/23/2018
|
$89.24
|
PP = $87.55
|
|
MB = $91.93
|
Most Recent Note - 8/27/2018 5:53:58 PM
Y - Erased a small gain challenging its all-time high today and ended near the session low. Its 50 DMA line ($86.13) defines support above prior lows in the $80-81 area.
>>> FEATURED STOCK ARTICLE : Paypal Pulling Back From Record High - 7/26/2018 |
View all notes |
Set NEW NOTE alert |
Company Profile |
SEC
News |
Chart |
Request a new note
C
A
S
I |
OLLI
-
NASDAQ
Ollie's Bargain Outlet
Retail-DiscountandVariety
|
$81.15
|
+0.60
0.74% |
$82.45
|
728,077
119.16% of 50 DAV
50 DAV is 611,000
|
$80.95
0.25%
|
7/12/2018
|
$74.43
|
PP = $77.60
|
|
MB = $81.48
|
Most Recent Note - 8/22/2018 5:27:21 PM
Y - Recent volume-driven gains above the pivot point triggered a new (or add-on) technical buy signal. Fundamentals remain strong, yet earnings news is due on 8/29/18. Prior highs in the $77 area define initial support to watch above its 50 DMA line ($73.32). See the latest FSU analysis for more details and a new annotated graph.
>>> FEATURED STOCK ARTICLE : Hitting New Highs With More Volume-Driven Gains - 8/22/2018 |
View all notes |
Set NEW NOTE alert |
Company Profile |
SEC
News |
Chart |
Request a new note
C
A
S
I |
NOVT
-
NASDAQ
Novanta Inc
Elec-Scientific/Msrng
|
$78.15
|
+0.95
1.23% |
$78.40
|
238,351
126.78% of 50 DAV
50 DAV is 188,000
|
$77.80
0.45%
|
7/12/2018
|
$65.90
|
PP = $68.10
|
|
MB = $71.51
|
Most Recent Note - 8/23/2018 1:06:57 PM
G - Hit another new 52-week high with a big volume-driven gain on the prior session, getting very extended from prior highs. The 50 DMA line ($66.44) and prior low ($61.15 on 7/31/18) define important near-term support to watch on pullbacks.
>>> FEATURED STOCK ARTICLE : Gain Challenged 52-Week High and New Pivot Point - 7/12/2018 |
View all notes |
Set NEW NOTE alert |
Company Profile |
SEC
News |
Chart |
Request a new note
C
A
S
I |
TEAM
-
NASDAQ
Atlassian Corp Plc Cl A
Comp Sftwr-Spec Enterprs
|
$86.54
|
+0.43
0.50% |
$87.48
|
2,420,695
207.43% of 50 DAV
50 DAV is 1,167,000
|
$86.13
0.48%
|
7/27/2018
|
$73.73
|
PP = $68.85
|
|
MB = $72.29
|
Most Recent Note - 8/27/2018 12:54:07 PM
G - Powering higher with today's 6th consecutive gain backed by greater volume conviction, getting more extended from any sound base. Its 50 DMA line ($70.69) defines near-term support above prior highs in the $68 area. Fundamentals through Jun '18 have been strong.
>>> FEATURED STOCK ARTICLE : Pullback Following Recent technical Breakout - 7/30/2018 |
View all notes |
Set NEW NOTE alert |
Company Profile |
SEC
News |
Chart |
Request a new note
C
A
S
I |
Symbol/Exchange
Company Name
Industry Group |
PRICE |
CHANGE
(%Change) |
Day High |
Volume
(% DAV)
(% 50 day avg vol) |
52 Wk Hi
% From Hi |
Featured
Date |
Price
Featured |
Pivot Featured |
|
Max Buy |
SEND
-
NYSE
Sendgrid Inc
INTERNET - Content
|
$34.57
|
-0.06
-0.17% |
$35.17
|
878,943
98.87% of 50 DAV
50 DAV is 889,000
|
$34.77
-0.58%
|
8/13/2018
|
$32.20
|
PP = $32.13
|
|
MB = $33.74
|
Most Recent Note - 8/27/2018 5:59:48 PM
G - Color code is changed to green. Finished flat today, perched at its all-time high after a streak of 5 consecutive gains marked by only light or average volume. Disciplined investors avoid chasing stocks extended more than +5% above prior highs.
>>> FEATURED STOCK ARTICLE : Strength Returned After Finding Support Near Prior Lows - 8/14/2018 |
View all notes |
Set NEW NOTE alert |
Company Profile |
SEC
News |
Chart |
Request a new note
C
A
S
I |