***Last / Change / Volume data in this table is the closing quote data***
Symbol/Exchange
Company Name
Industry Group |
PRICE |
CHANGE
(%Change) |
Day High |
Volume
(% DAV)
(% 50 day avg vol) |
52 Wk Hi
% From Hi |
Featured
Date |
Price
Featured |
Pivot Featured |
|
Max Buy |
OSBC
-
NASDAQ
Old Second Bancorp Inc
BANKING - Regional - Midwest Banks
|
$15.45
|
+0.10
0.65% |
$15.55
|
108,867
116.06% of 50 DAV
50 DAV is 93,800
|
$16.30
-5.21%
|
5/21/2018
|
$15.50
|
PP = $15.10
|
|
MB = $15.86
|
Most Recent Note - 8/31/2018 12:41:40 PM
G - Consolidating above its 50 DMA line ($15.11) while the prior low ($14) and 200 DMA line define additional near-term support. Its Relative Strength Rating has slumped to 76, below the 80+ minimum guideline for buy candidates. Met stubborn resistance after hitting a new high on 7/26/18 with a big volume-driven gain. Fundamentals remain strong.
>>> FEATURED STOCK ARTICLE : Bank Perched Less Than -5% Off Record High - 8/23/2018 |
View all notes |
Set NEW NOTE alert |
Company Profile |
SEC
News |
Chart |
Request a new note
C
A
S
I |
SIVB
-
NASDAQ
S V B Financial Group
BANKING - Regional - Pacific Banks
|
$322.75
|
+1.87
0.58% |
$323.17
|
279,999
61.81% of 50 DAV
50 DAV is 453,000
|
$333.74
-3.29%
|
8/6/2018
|
$314.77
|
PP = $329.75
|
|
MB = $346.24
|
Most Recent Note - 8/27/2018 6:01:51 PM
Y - Posted a quiet gain today for a best ever close. Met resistance in recent weeks near prior highs. Subsequent gains above the pivot point backed by at least +40% above average volume may trigger a convincing new technical buy signal. The 50 DMA line ($311) defines near-term support to watch on pullbacks. Fundamentals remain strong. see the latest FSU analysis for more details and a new annotated graph.
>>> FEATURED STOCK ARTICLE : Bank Posted Quiet Gain for a Best-Ever Close - 8/27/2018 |
View all notes |
Set NEW NOTE alert |
Company Profile |
SEC
News |
Chart |
Request a new note
C
A
S
I |
ZBRA
-
NASDAQ
Zebra Tech Corp Cl A
COMPUTER HARDWARE - Computer Peripherals
|
$171.74
|
+1.44
0.85% |
$172.04
|
172,747
43.73% of 50 DAV
50 DAV is 395,000
|
$171.68
0.03%
|
8/7/2018
|
$164.26
|
PP = $161.82
|
|
MB = $169.91
|
Most Recent Note - 8/27/2018 6:04:50 PM
G - Color code is changed to green after a gain above its "max buy" level today with light volume for its best ever close. Prior high in the $161 area defines initial support above its 50 DMA line ($150) Fundamentals remain strong.
>>> FEATURED STOCK ARTICLE : Big Gain for New High Backed by Heavy Volume - 8/7/2018 |
View all notes |
Set NEW NOTE alert |
Company Profile |
SEC
News |
Chart |
Request a new note
C
A
S
I |
EPAM
-
NYSE
Epam Systems Inc
COMPUTER SOFTWARE and SERVICES - Information Technology Service
|
$142.93
|
-1.07
-0.74% |
$144.00
|
376,228
63.55% of 50 DAV
50 DAV is 592,000
|
$144.19
-0.87%
|
7/5/2018
|
$123.70
|
PP = $131.85
|
|
MB = $138.44
|
Most Recent Note - 8/27/2018 5:40:45 PM
G - Posted a 10th consecutive gain today hitting a new all-time high and its color code is changed to green. Recently found support above its 50 DMA line ($130). Fundamentals remain strong.
>>> FEATURED STOCK ARTICLE : Tech Services Firm Remains Fundamentally and Technically Strong - 8/20/2018 |
View all notes |
Set NEW NOTE alert |
Company Profile |
SEC
News |
Chart |
Request a new note
C
A
S
I |
IRBT
-
NASDAQ
Irobot Corp
CONSUMER DURABLES - Electronic Equipment
|
$113.50
|
-2.81
-2.42% |
$115.63
|
594,162
64.86% of 50 DAV
50 DAV is 916,000
|
$118.75
-4.42%
|
8/29/2018
|
$112.07
|
PP = $109.88
|
|
MB = $115.37
|
Most Recent Note - 8/29/2018 5:31:47 PM
Y - Finished in the upper third of its intra-day range after highlighted in yellow with pivot point cited based on its 7/31/17 mid-day report plus 10 cents in the earlier mid-day report. Pulled back following a technical breakout from a long choppy base with the 2 prior volume-driven gains clearing the old high. Showed strong sales revenues and earnings increases above the +25% minimum guideline (C criteria) in the Mar and Jun '18 quarterly comparisons. Annual earnings growth (A criteria) has been strong since last noted in the 3/12/14 mid-day report. See the latest FSU analysis for more details and a new annotated graph.
>>> FEATURED STOCK ARTICLE : Household Appliance Maker Rallied From Choppy Base - 8/29/2018 |
View all notes |
Set NEW NOTE alert |
Company Profile |
SEC
News |
Chart |
Request a new note
C
A
S
I |
Symbol/Exchange
Company Name
Industry Group |
PRICE |
CHANGE
(%Change) |
Day High |
Volume
(% DAV)
(% 50 day avg vol) |
52 Wk Hi
% From Hi |
Featured
Date |
Price
Featured |
Pivot Featured |
|
Max Buy |
FLT
-
NYSE
Fleetcor Technologies
DIVERSIFIED SERVICES - Business/Management Services
|
$213.74
|
-0.57
-0.27% |
$214.96
|
852,194
123.69% of 50 DAV
50 DAV is 689,000
|
$225.92
-5.39%
|
6/18/2018
|
$219.31
|
PP = $213.84
|
|
MB = $224.53
|
Most Recent Note - 8/27/2018 5:42:32 PM
Y - Consolidating above its 50 DMA line ($217) with volume totals cooling in recent weeks. The prior low ($210.64 on 8/03/18) defines important near-term support above its 200 DMA line($202). Fundamentals remain strong.
>>> FEATURED STOCK ARTICLE : Testing 50-Day Average With Loss on Higher Volume - 8/3/2018 |
View all notes |
Set NEW NOTE alert |
Company Profile |
SEC
News |
Chart |
Request a new note
C
A
S
I |
MA
-
NYSE
Mastercard Inc Cl A
Finance-CrdtCard/PmtPr
|
$215.56
|
+1.76
0.82% |
$215.80
|
2,995,628
96.98% of 50 DAV
50 DAV is 3,089,000
|
$215.86
-0.14%
|
7/11/2018
|
$203.84
|
PP = $204.10
|
|
MB = $214.31
|
Most Recent Note - 8/27/2018 5:49:38 PM
Y - Posted a 4th consecutive gain today with light volume for its second best close ever. Its 50 DMA line ($202) defines support above the prior lows in the $193-196 area. Fundamentals remain strong.
>>> FEATURED STOCK ARTICLE : Found Support Near 50-Day Moving Average Line - 8/10/2018 |
View all notes |
Set NEW NOTE alert |
Company Profile |
SEC
News |
Chart |
Request a new note
C
A
S
I |
V
-
NYSE
Visa Inc Cl A
Finance-CrdtCard/PmtPr
|
$146.89
|
+0.15
0.10% |
$147.64
|
5,727,939
81.22% of 50 DAV
50 DAV is 7,052,000
|
$147.71
-0.56%
|
4/26/2018
|
$126.68
|
PP = $126.98
|
|
MB = $133.33
|
Most Recent Note - 9/1/2018 10:06:50 AM
G - Holding its ground stubbornly perched at its all-time high, extended from any sound base. Its 50 DMA line ($139) and recent low ($135.31 on 7/30/18) define important near-term support to watch on pullbacks. Fundamentals remain strong.
>>> FEATURED STOCK ARTICLE : Perched Near All-Time High After Rally From 50-Day Average - 7/27/2018 |
View all notes |
Set NEW NOTE alert |
Company Profile |
SEC
News |
Chart |
Request a new note
C
A
S
I |
NANO
-
NASDAQ
Nanometrics Inc
ELECTRONICS - Scientific and Technical Instrum
|
$43.81
|
-0.18
-0.41% |
$44.34
|
226,853
60.66% of 50 DAV
50 DAV is 374,000
|
$48.26
-9.22%
|
8/13/2018
|
$44.17
|
PP = $44.27
|
|
MB = $46.48
|
Most Recent Note - 8/29/2018 5:33:45 PM
Y - Pulled back to yet it remains perched within close striking distance of its 52-week high. The 50 DMA line and recent low define important near-term support in the $39-40 area. Recent quarters through Jun '18 showed much better sales and earnings increases versus the year earlier. Annual earnings (A criteria) have improved greatly since a downturn and losses FY '13 and '14.
>>> FEATURED STOCK ARTICLE : Five Times Average Volume Behind Breakout Gain - 8/13/2018 |
View all notes |
Set NEW NOTE alert |
Company Profile |
SEC
News |
Chart |
Request a new note
C
A
S
I |
ENV
-
NYSE
Envestnet Inc
FINANCIAL SERVICES - Diversified Investments
|
$63.20
|
-0.45
-0.71% |
$63.70
|
205,862
69.08% of 50 DAV
50 DAV is 298,000
|
$64.00
-1.25%
|
6/15/2018
|
$57.85
|
PP = $60.37
|
|
MB = $63.39
|
Most Recent Note - 8/27/2018 5:38:32 PM
Y - Posted a 4th consecutive gain today with below average volume and ended the session at a best-ever close. Found prompt support near its 50 DMA line ($58.95) in recent weeks. Its Relative Strength Rating has improved to 85, above the 80+ minimum guideline for buy candidates. Fundamentals remain strong.
>>> FEATURED STOCK ARTICLE : Earnings News Due for Financial Firm Perched Near High - 8/6/2018 |
View all notes |
Set NEW NOTE alert |
Company Profile |
SEC
News |
Chart |
Request a new note
C
A
S
I |
Symbol/Exchange
Company Name
Industry Group |
PRICE |
CHANGE
(%Change) |
Day High |
Volume
(% DAV)
(% 50 day avg vol) |
52 Wk Hi
% From Hi |
Featured
Date |
Price
Featured |
Pivot Featured |
|
Max Buy |
TPL
-
NYSE
Texas Pacific Land Trust
Real Estate Dvlpmt/Ops
|
$834.61
|
+5.72
0.69% |
$839.12
|
13,257
101.98% of 50 DAV
50 DAV is 13,000
|
$874.00
-4.51%
|
7/5/2018
|
$714.90
|
PP = $739.99
|
|
MB = $776.99
|
Most Recent Note - 8/29/2018 1:00:35 PM
G - Perched near its all-time high, extended from any sound base. The 50 DMA line ($768) and recent low ($760 on 8/15/18) define important near-term support to watch on pullbacks.
>>> FEATURED STOCK ARTICLE : Volume Totals Cooling While Consolidating Above Prior High - 7/20/2018 |
View all notes |
Set NEW NOTE alert |
Company Profile |
SEC
News |
Chart |
Request a new note
C
A
S
I |
DPZ
-
NYSE
Dominos Pizza Inc
Retail-Restaurants
|
$298.56
|
-2.11
-0.70% |
$302.00
|
360,675
59.22% of 50 DAV
50 DAV is 609,000
|
$305.34
-2.22%
|
8/13/2018
|
$288.60
|
PP = $293.91
|
|
MB = $308.61
|
Most Recent Note - 8/27/2018 5:35:38 PM
Y - Wedged up to a new 52-week high and it has been stubbornly holding its ground. Subsequent gains above the pivot point backed by at least +40% above average volume may trigger a new (or add-on) technical buy signal.
>>> FEATURED STOCK ARTICLE : Consolidating Near 50-Day Moving Average Line - 7/23/2018 |
View all notes |
Set NEW NOTE alert |
Company Profile |
SEC
News |
Chart |
Request a new note
C
A
S
I |
FIVE
-
NASDAQ
Five Below Inc
Retail-DiscountandVariety
|
$116.47
|
+2.01
1.76% |
$116.87
|
819,643
103.88% of 50 DAV
50 DAV is 789,000
|
$116.30
0.15%
|
7/6/2018
|
$98.90
|
PP = $104.09
|
|
MB = $109.29
|
Most Recent Note - 8/28/2018 5:50:07 PM
G - Below average volume was behind today's small gain for a best ever close. Its 50 DMA line ($102.76) defines near-term support above prior lows in the $95-96 area. Recent gains above the pivot point lacked the minimum of +40% above average volume needed to trigger a proper technical buy signal.
>>> FEATURED STOCK ARTICLE : Volume Totals Cooling While Perched Near Record High - 8/16/2018 |
View all notes |
Set NEW NOTE alert |
Company Profile |
SEC
News |
Chart |
Request a new note
C
A
S
I |
NOW
-
NYSE
Servicenow Inc
Computer Sftwr-Enterprse
|
$196.36
|
-2.09
-1.05% |
$199.44
|
1,082,696
63.88% of 50 DAV
50 DAV is 1,695,000
|
$201.00
-2.31%
|
8/24/2018
|
$193.83
|
PP = $194.91
|
|
MB = $204.66
|
Most Recent Note - 8/29/2018 12:53:48 PM
Y - Hitting a new 52-week high with today's gain. Found prompt support near its 50 DMA line again recently. Gains above the pivot point backed by at least +40% above average volume may trigger a proper new (or add-on) technical buy signal. The recent low ($174) defines the next important near-term support. Fundamentals remain strong.
>>> FEATURED STOCK ARTICLE : Slump Below 50-Day Average Line Raises Concerns - 8/17/2018 |
View all notes |
Set NEW NOTE alert |
Company Profile |
SEC
News |
Chart |
Request a new note
C
A
S
I |
NVEE
-
NASDAQ
N V 5 Global Inc
Comml Svcs-Consulting
|
$88.45
|
-0.85
-0.95% |
$89.25
|
100,425
133.90% of 50 DAV
50 DAV is 75,000
|
$91.55
-3.39%
|
6/15/2018
|
$7,070.00
|
PP = $72.00
|
|
MB = $75.60
|
Most Recent Note - 8/28/2018 5:52:08 PM
G - Gradually rebounded since pricing a new Public Offering and gapping down on 8/09/18. Remains perched near its all-time high. Its 50 DMA line ($77.16) defines near-term support to watch on pullbacks.
>>> FEATURED STOCK ARTICLE : Remains Perched Near All-Time High Following Offering - 8/21/2018 |
View all notes |
Set NEW NOTE alert |
Company Profile |
SEC
News |
Chart |
Request a new note
C
A
S
I |
Symbol/Exchange
Company Name
Industry Group |
PRICE |
CHANGE
(%Change) |
Day High |
Volume
(% DAV)
(% 50 day avg vol) |
52 Wk Hi
% From Hi |
Featured
Date |
Price
Featured |
Pivot Featured |
|
Max Buy |
PANW
-
NYSE
Palo Alto Networks
Computer Sftwr-Security
|
$231.15
|
+0.91
0.40% |
$232.16
|
803,646
70.37% of 50 DAV
50 DAV is 1,142,000
|
$232.31
-0.50%
|
6/12/2018
|
$206.55
|
PP = $214.69
|
|
MB = $225.42
|
Most Recent Note - 9/1/2018 10:05:21 AM
G - Color code is changed to green after rising above its "max buy" level and holding its ground stubbornly perched at its all-time high. Its 50 DMA line ($212.35) defines initial support above the prior low ($193 on 7/30/18).
>>> FEATURED STOCK ARTICLE : Violated 50-day Average With Volume-driven Loss - 7/31/2018 |
View all notes |
Set NEW NOTE alert |
Company Profile |
SEC
News |
Chart |
Request a new note
C
A
S
I |
QLYS
-
NASDAQ
Qualys Inc
Computer Sftwr-Security
|
$91.05
|
+2.00
2.25% |
$91.11
|
307,002
88.22% of 50 DAV
50 DAV is 348,000
|
$98.30
-7.37%
|
8/31/2018
|
$91.05
|
PP = $98.40
|
|
MB = $103.32
|
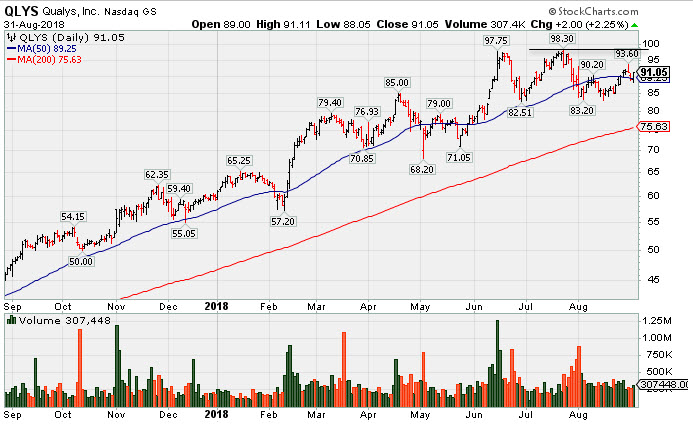
Most Recent Note - 9/1/2018 9:58:46 AM
Y- Consolidating near its 50 DMA line ($89.25). The recent low ($82.91 on 8/15/18) defines the next important near term support to watch. New pivot point is cited based on its 7/24/18 high plus 10 cents. Subsequent volume-driven gains above the pivot point may trigger a technical buy signal, however, it faces some near-term resistance due to overhead supply up to the $98 level. See the latest FSU analysis for more details and a new annotated graph.
>>> FEATURED STOCK ARTICLE : Cloud Security Firm Faces Some Near Term Resistance - 9/3/2018 |
View all notes |
Set NEW NOTE alert |
Company Profile |
SEC
News |
Chart |
Request a new note
C
A
S
I |
ANET
-
NYSE
Arista Networks Inc
TELECOMMUNICATIONS - Communication Equipment
|
$298.98
|
+1.11
0.37% |
$302.33
|
807,061
80.15% of 50 DAV
50 DAV is 1,007,000
|
$313.37
-4.59%
|
8/24/2018
|
$308.26
|
PP = $311.77
|
|
MB = $327.36
|
Most Recent Note - 8/27/2018 12:06:58 PM
Y - Holding its ground today. Subsequent volume-driven gains and a strong close above the pivot point would be reassuring. Color code was changed to yellow with new pivot point cited based on its 2/15/18 high plus 10 cents when it gapped up for a considerable volume-driven gain on 8/24/18, reaching a new all-time high. Found support above its 200 DMA line during the choppy consolidation since dropped from the Featured Stocks list on 2/21/18. Fundamentals remain strong after it reported earnings +44% on +28% sales revenues for the Jun '18 quarter. See the latest FSU analysis for more details and an annotated graph.
>>> FEATURED STOCK ARTICLE : Considerable Gap Up Gain With Heavy Volume - 8/24/2018 |
View all notes |
Set NEW NOTE alert |
Company Profile |
SEC
News |
Chart |
Request a new note
C
A
S
I |
PAYC
-
NYSE
Paycom Software Inc
COMPUTER SOFTWARE and SERVICES - Application Software
|
$155.12
|
+2.33
1.52% |
$155.13
|
460,299
52.49% of 50 DAV
50 DAV is 877,000
|
$154.40
0.47%
|
8/1/2018
|
$122.87
|
PP = $118.55
|
|
MB = $124.48
|
Most Recent Note - 8/27/2018 5:51:08 PM
G - Hit yet another new all-time high with today's 8th consecutive gain marked by below average volume, getting very extended from prior highs in the $118 area. Fundamentals remain strong.
>>> FEATURED STOCK ARTICLE : Bullish Action Followed Strong Earnings News - 8/1/2018 |
View all notes |
Set NEW NOTE alert |
Company Profile |
SEC
News |
Chart |
Request a new note
C
A
S
I |
GRUB
-
NYSE
Grubhub Inc
INTERNET - Content
|
$144.11
|
+1.50
1.05% |
$144.60
|
511,879
29.37% of 50 DAV
50 DAV is 1,743,000
|
$145.09
-0.68%
|
8/24/2018
|
$138.44
|
PP = $141.16
|
|
MB = $148.22
|
Most Recent Note - 9/1/2018 10:02:57 AM
Y - Quietly touched another new all-time high on Friday. Color code was changed to yellow with new pivot point cited based on its 7/26/18 high plus 10 cents, however, recent gains lacked great volume conviction. Gains above the pivot point backed by at least +40% above average volume are needed to trigger a proper new (or add-on) technical buy signal.
>>> FEATURED STOCK ARTICLE : Hovering Near Record High Following Considerable Rally - 8/2/2018 |
View all notes |
Set NEW NOTE alert |
Company Profile |
SEC
News |
Chart |
Request a new note
C
A
S
I |
Symbol/Exchange
Company Name
Industry Group |
PRICE |
CHANGE
(%Change) |
Day High |
Volume
(% DAV)
(% 50 day avg vol) |
52 Wk Hi
% From Hi |
Featured
Date |
Price
Featured |
Pivot Featured |
|
Max Buy |
HQY
-
NASDAQ
Healthequity Inc
COMPUTER SOFTWARE and SERVICES - Healthcare Information Service
|
$94.21
|
+1.66
1.79% |
$94.57
|
445,460
114.81% of 50 DAV
50 DAV is 388,000
|
$93.52
0.74%
|
8/13/2018
|
$82.39
|
PP = $83.44
|
|
MB = $87.61
|
Most Recent Note - 8/27/2018 5:45:48 PM
G - Hit another new all-time high with today's 2nd consecutive volume-driven gain and its color code is changed to green. Prior highs in the $82-83 area define initial support above its 50 DMA line ($81).
>>> FEATURED STOCK ARTICLE : Perched Near All-Time High After Testing Support at 50-Day Average - 7/25/2018 |
View all notes |
Set NEW NOTE alert |
Company Profile |
SEC
News |
Chart |
Request a new note
C
A
S
I |
LOB
-
NASDAQ
"Live Oak Bancshares, Inc."
Banks-Southeast
|
$30.25
|
+0.15
0.50% |
$30.40
|
70,117
45.03% of 50 DAV
50 DAV is 155,700
|
$32.95
-8.19%
|
5/21/2018
|
$29.35
|
PP = $30.15
|
|
MB = $31.66
|
Most Recent Note - 8/28/2018 5:56:51 PM
G - Its Relative Strength Rating is still 79, below the 80+ minimum guideline. Volume totals have cooled in recent weeks. A rebound above the 50 DMA line ($30.56) still is needed for its outlook to improve. The recent low and 200 DMA line ($27.51) define important near-term chart support. See the latest FSU analysis for more details and a new annotated graph.
>>> FEATURED STOCK ARTICLE : Recently Met Resistance at 50-Day Moving Average - 8/28/2018 |
View all notes |
Set NEW NOTE alert |
Company Profile |
SEC
News |
Chart |
Request a new note
C
A
S
I |
PYPL
-
NASDAQ
Paypal Holdings Inc
Finance-CrdtCard/PmtPr
|
$92.33
|
+0.24
0.26% |
$92.74
|
4,842,230
67.67% of 50 DAV
50 DAV is 7,156,000
|
$93.01
-0.73%
|
7/23/2018
|
$89.24
|
PP = $87.55
|
|
MB = $91.93
|
Most Recent Note - 8/29/2018 5:38:14 PM
G - Posted a gain today with near average volume for a new all-time high above its "max buy" level and its color code is changed to green. Its 50 DMA line ($86.39) defines support above prior lows in the $80-81 area.
>>> FEATURED STOCK ARTICLE : Paypal Pulling Back From Record High - 7/26/2018 |
View all notes |
Set NEW NOTE alert |
Company Profile |
SEC
News |
Chart |
Request a new note
C
A
S
I |
OLLI
-
NASDAQ
Ollie's Bargain Outlet
Retail-DiscountandVariety
|
$87.10
|
+1.65
1.93% |
$87.75
|
572,523
96.71% of 50 DAV
50 DAV is 592,000
|
$86.15
1.10%
|
7/12/2018
|
$74.43
|
PP = $77.60
|
|
MB = $81.48
|
Most Recent Note - 8/28/2018 5:55:34 PM
G - Color code is changed to green after rallying above its "max buy" level with a streak of 9 consecutive gains. Reports financial results for the second quarter of fiscal 2018 on Wednesday, September 5, 2018 after the market closes. Prior highs in the $77 area define initial support to watch above its 50 DMA line ($73.78).
>>> FEATURED STOCK ARTICLE : Hitting New Highs With More Volume-Driven Gains - 8/22/2018 |
View all notes |
Set NEW NOTE alert |
Company Profile |
SEC
News |
Chart |
Request a new note
C
A
S
I |
NOVT
-
NASDAQ
Novanta Inc
Elec-Scientific/Msrng
|
$76.60
|
-1.20
-1.54% |
$78.60
|
230,079
128.54% of 50 DAV
50 DAV is 179,000
|
$78.85
-2.85%
|
7/12/2018
|
$65.90
|
PP = $68.10
|
|
MB = $71.51
|
Most Recent Note - 8/30/2018 8:06:07 PM
G - Perched near its 52-week high, very extended from the prior base. Prior highs in the $68-69 area define initial support above the 50 DMA line ($67.67). See the latest FSU analysis for more details and a new annotated graph.
>>> FEATURED STOCK ARTICLE : Electronic Systems Leader is Extended From Prior Base - 8/30/2018 |
View all notes |
Set NEW NOTE alert |
Company Profile |
SEC
News |
Chart |
Request a new note
C
A
S
I |
Symbol/Exchange
Company Name
Industry Group |
PRICE |
CHANGE
(%Change) |
Day High |
Volume
(% DAV)
(% 50 day avg vol) |
52 Wk Hi
% From Hi |
Featured
Date |
Price
Featured |
Pivot Featured |
|
Max Buy |
TEAM
-
NASDAQ
Atlassian Corp Plc Cl A
Comp Sftwr-Spec Enterprs
|
$90.01
|
+0.72
0.81% |
$91.42
|
1,333,772
108.35% of 50 DAV
50 DAV is 1,231,000
|
$90.31
-0.33%
|
7/27/2018
|
$73.73
|
PP = $68.85
|
|
MB = $72.29
|
Most Recent Note - 8/28/2018 12:13:44 PM
G - Powering higher with today's 7th consecutive gain backed by greater volume conviction, getting more extended from any sound base. Its 50 DMA line ($71.09) defines near-term support above prior highs in the $68 area. Fundamentals through Jun '18 have been strong.
>>> FEATURED STOCK ARTICLE : Pullback Following Recent technical Breakout - 7/30/2018 |
View all notes |
Set NEW NOTE alert |
Company Profile |
SEC
News |
Chart |
Request a new note
C
A
S
I |
SEND
-
NYSE
Sendgrid Inc
INTERNET - Content
|
$36.27
|
+1.56
4.49% |
$36.27
|
869,672
99.73% of 50 DAV
50 DAV is 872,000
|
$36.77
-1.36%
|
8/13/2018
|
$32.20
|
PP = $32.13
|
|
MB = $33.74
|
Most Recent Note - 8/30/2018 1:11:08 PM
G - Pulling back from its all-time high with a big loss today with above average volume. Prior highs in the $32 area define initial support to watch above its 50 DMA line.
>>> FEATURED STOCK ARTICLE : Strength Returned After Finding Support Near Prior Lows - 8/14/2018 |
View all notes |
Set NEW NOTE alert |
Company Profile |
SEC
News |
Chart |
Request a new note
C
A
S
I |