***Last / Change / Volume data in this table is the closing quote data***
Symbol/Exchange
Company Name
Industry Group |
PRICE |
CHANGE
(%Change) |
Day High |
Volume
(% DAV)
(% 50 day avg vol) |
52 Wk Hi
% From Hi |
Featured
Date |
Price
Featured |
Pivot Featured |
|
Max Buy |
OSBC
-
NASDAQ
Old Second Bancorp Inc
BANKING - Regional - Midwest Banks
|
$15.40
|
-0.05
-0.32% |
$15.50
|
93,381
99.55% of 50 DAV
50 DAV is 93,800
|
$16.30
-5.52%
|
5/21/2018
|
$15.50
|
PP = $15.10
|
|
MB = $15.86
|
 Most Recent Note - 9/4/2018 5:46:01 PM
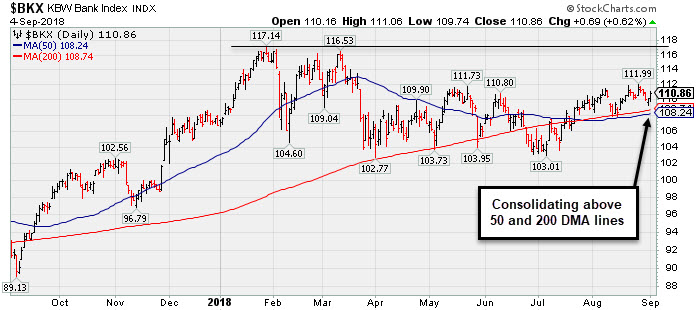
G - Consolidating above its 50 DMA line ($15.12). The prior low ($14) and 200 DMA line define additional near-term support. Its Relative Strength Rating is 79, still just below the 80+ minimum guideline for buy candidates. Met stubborn resistance after hitting a new high on 7/26/18 with a big volume-driven gain. Fundamentals remain strong.
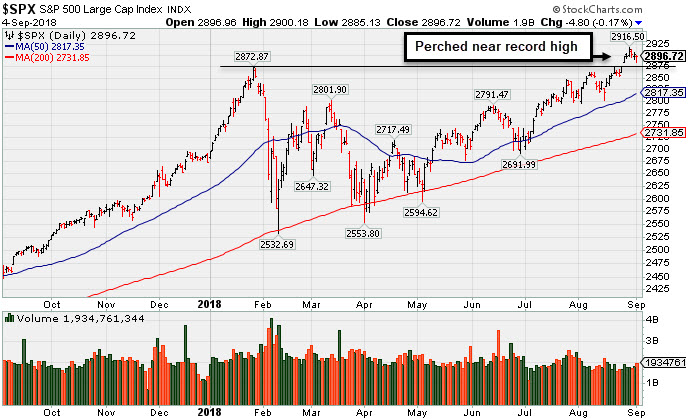
>>> FEATURED STOCK ARTICLE : Bank Perched Less Than -5% Off Record High - 8/23/2018 |
View all notes |
Set NEW NOTE alert |
Company Profile |
SEC
News |
Chart |
Request a new note
C
A
S
I |
SIVB
-
NASDAQ
S V B Financial Group
BANKING - Regional - Pacific Banks
|
$326.21
|
+3.46
1.07% |
$327.80
|
361,600
79.82% of 50 DAV
50 DAV is 453,000
|
$333.74
-2.26%
|
8/6/2018
|
$314.77
|
PP = $329.75
|
|
MB = $346.24
|
Most Recent Note - 9/4/2018 4:01:56 PM
Y - Met resistance in recent weeks near prior highs. Subsequent gains above the pivot point backed by at least +40% above average volume may trigger a convincing new technical buy signal. The 50 DMA line ($311) defines near-term support to watch on pullbacks.
>>> FEATURED STOCK ARTICLE : Bank Posted Quiet Gain for a Best-Ever Close - 8/27/2018 |
View all notes |
Set NEW NOTE alert |
Company Profile |
SEC
News |
Chart |
Request a new note
C
A
S
I |
ZBRA
-
NASDAQ
Zebra Tech Corp Cl A
COMPUTER HARDWARE - Computer Peripherals
|
$169.96
|
-1.78
-1.04% |
$172.73
|
245,955
62.74% of 50 DAV
50 DAV is 392,000
|
$172.04
-1.21%
|
8/7/2018
|
$164.26
|
PP = $161.82
|
|
MB = $169.91
|
Most Recent Note - 9/4/2018 4:03:29 PM
G - Volume totals have been cooling while stubbornly holding its ground near its "max buy" level. Prior high in the $161 area defines initial support above its 50 DMA line ($153) Fundamentals remain strong.
>>> FEATURED STOCK ARTICLE : Big Gain for New High Backed by Heavy Volume - 8/7/2018 |
View all notes |
Set NEW NOTE alert |
Company Profile |
SEC
News |
Chart |
Request a new note
C
A
S
I |
EPAM
-
NYSE
Epam Systems Inc
COMPUTER SOFTWARE and SERVICES - Information Technology Service
|
$142.80
|
-0.13
-0.09% |
$143.38
|
536,138
90.87% of 50 DAV
50 DAV is 590,000
|
$144.19
-0.96%
|
7/5/2018
|
$123.70
|
PP = $131.85
|
|
MB = $138.44
|
Most Recent Note - 9/4/2018 3:56:53 PM
G - Holding its ground near its all-time high after an impressive streak of gains, extended from any sound base. Recently found support above its 50 DMA line ($132). Fundamentals remain strong.
>>> FEATURED STOCK ARTICLE : Tech Services Firm Remains Fundamentally and Technically Strong - 8/20/2018 |
View all notes |
Set NEW NOTE alert |
Company Profile |
SEC
News |
Chart |
Request a new note
C
A
S
I |
IRBT
-
NASDAQ
Irobot Corp
CONSUMER DURABLES - Electronic Equipment
|
$114.16
|
+0.66
0.58% |
$114.62
|
947,440
103.32% of 50 DAV
50 DAV is 917,000
|
$118.75
-3.87%
|
8/29/2018
|
$112.07
|
PP = $109.88
|
|
MB = $115.37
|
Most Recent Note - 9/4/2018 5:44:44 PM
Y - Managed a "positive reversal" after early weakness today, and it finished near the session high. Prior highs in the $109 area define initial support to watch on pullbacks. Highlighted in yellow with pivot point cited based on its 7/31/17 mid-day report plus 10 cents in the 8/29/18 mid-day report.
>>> FEATURED STOCK ARTICLE : Household Appliance Maker Rallied From Choppy Base - 8/29/2018 |
View all notes |
Set NEW NOTE alert |
Company Profile |
SEC
News |
Chart |
Request a new note
C
A
S
I |
Symbol/Exchange
Company Name
Industry Group |
PRICE |
CHANGE
(%Change) |
Day High |
Volume
(% DAV)
(% 50 day avg vol) |
52 Wk Hi
% From Hi |
Featured
Date |
Price
Featured |
Pivot Featured |
|
Max Buy |
FLT
-
NYSE
Fleetcor Technologies
DIVERSIFIED SERVICES - Business/Management Services
|
$215.31
|
+1.57
0.73% |
$215.53
|
593,928
87.60% of 50 DAV
50 DAV is 678,000
|
$225.92
-4.70%
|
6/18/2018
|
$219.31
|
PP = $213.84
|
|
MB = $224.53
|
Most Recent Note - 9/4/2018 3:58:31 PM
G - Color code is changed to green while sputtering below its 50 DMA line ($216). The prior low ($210.64 on 8/03/18) defines important near-term support above its 200 DMA line($202). Fundamentals remain strong.
>>> FEATURED STOCK ARTICLE : Testing 50-Day Average With Loss on Higher Volume - 8/3/2018 |
View all notes |
Set NEW NOTE alert |
Company Profile |
SEC
News |
Chart |
Request a new note
C
A
S
I |
MA
-
NYSE
Mastercard Inc Cl A
Finance-CrdtCard/PmtPr
|
$216.82
|
+1.26
0.58% |
$217.35
|
3,698,338
119.46% of 50 DAV
50 DAV is 3,096,000
|
$215.86
0.44%
|
7/11/2018
|
$203.84
|
PP = $204.10
|
|
MB = $214.31
|
Most Recent Note - 9/4/2018 4:00:03 PM
Y - Touched a new high with a gain today with near average volume, poised for its best-ever close. Its 50 DMA line ($204) defines support above the prior lows in the $193-196 area. Fundamentals remain strong.
>>> FEATURED STOCK ARTICLE : Found Support Near 50-Day Moving Average Line - 8/10/2018 |
View all notes |
Set NEW NOTE alert |
Company Profile |
SEC
News |
Chart |
Request a new note
C
A
S
I |
V
-
NYSE
Visa Inc Cl A
Finance-CrdtCard/PmtPr
|
$147.80
|
+0.91
0.62% |
$147.86
|
7,568,539
108.21% of 50 DAV
50 DAV is 6,994,000
|
$147.71
0.06%
|
4/26/2018
|
$126.68
|
PP = $126.98
|
|
MB = $133.33
|
Most Recent Note - 9/1/2018 10:06:50 AM
G - Holding its ground stubbornly perched at its all-time high, extended from any sound base. Its 50 DMA line ($139) and recent low ($135.31 on 7/30/18) define important near-term support to watch on pullbacks. Fundamentals remain strong.
>>> FEATURED STOCK ARTICLE : Perched Near All-Time High After Rally From 50-Day Average - 7/27/2018 |
View all notes |
Set NEW NOTE alert |
Company Profile |
SEC
News |
Chart |
Request a new note
C
A
S
I |
NANO
-
NASDAQ
Nanometrics Inc
ELECTRONICS - Scientific and Technical Instrum
|
$42.83
|
-0.98
-2.24% |
$44.00
|
487,557
130.02% of 50 DAV
50 DAV is 375,000
|
$48.26
-11.25%
|
8/13/2018
|
$44.17
|
PP = $44.27
|
|
MB = $46.48
|
Most Recent Note - 9/4/2018 5:35:46 PM
Y - Pulled back today with higher volume indicative of distributional pressure. Remains perched within striking distance of its 52-week high. The 50 DMA line and recent low define important near-term support in the $39-40 area. Fundamentals remain strong.
>>> FEATURED STOCK ARTICLE : Five Times Average Volume Behind Breakout Gain - 8/13/2018 |
View all notes |
Set NEW NOTE alert |
Company Profile |
SEC
News |
Chart |
Request a new note
C
A
S
I |
ENV
-
NYSE
Envestnet Inc
FINANCIAL SERVICES - Diversified Investments
|
$62.95
|
-0.25
-0.40% |
$63.35
|
227,673
77.97% of 50 DAV
50 DAV is 292,000
|
$64.00
-1.64%
|
6/15/2018
|
$57.85
|
PP = $60.37
|
|
MB = $63.39
|
Most Recent Note - 9/4/2018 3:55:34 PM
Y - Quietly perched near its all-time high after a streak of gains marked by light and average volume. Found prompt support near its 50 DMA line ($59.39) in recent weeks. Fundamentals remain strong.
>>> FEATURED STOCK ARTICLE : Earnings News Due for Financial Firm Perched Near High - 8/6/2018 |
View all notes |
Set NEW NOTE alert |
Company Profile |
SEC
News |
Chart |
Request a new note
C
A
S
I |
Symbol/Exchange
Company Name
Industry Group |
PRICE |
CHANGE
(%Change) |
Day High |
Volume
(% DAV)
(% 50 day avg vol) |
52 Wk Hi
% From Hi |
Featured
Date |
Price
Featured |
Pivot Featured |
|
Max Buy |
TPL
-
NYSE
Texas Pacific Land Trust
Real Estate Dvlpmt/Ops
|
$856.90
|
+22.29
2.67% |
$857.93
|
17,772
136.71% of 50 DAV
50 DAV is 13,000
|
$874.00
-1.96%
|
7/5/2018
|
$714.90
|
PP = $739.99
|
|
MB = $776.99
|
Most Recent Note - 9/4/2018 5:31:11 PM
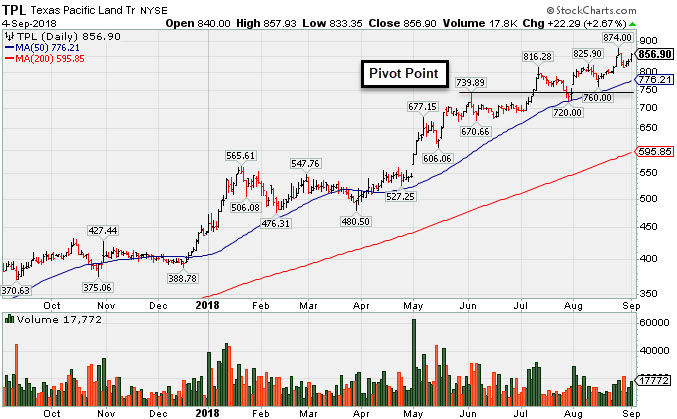
G - Managed a best-ever close with today's gain on higher volume nearly challenging its all-time high. Very extended from any sound base. The 50 DMA line ($776) and recent low ($760 on 8/15/18) define important near-term support to watch on pullbacks. See the latest FSU analysis for more details and a new annotated graph.
>>> FEATURED STOCK ARTICLE : Best Ever Close After a Solid Gain on Higher Volume - 9/4/2018 |
View all notes |
Set NEW NOTE alert |
Company Profile |
SEC
News |
Chart |
Request a new note
C
A
S
I |
DPZ
-
NYSE
Dominos Pizza Inc
Retail-Restaurants
|
$296.60
|
-1.96
-0.66% |
$299.66
|
384,152
64.03% of 50 DAV
50 DAV is 600,000
|
$305.34
-2.86%
|
8/13/2018
|
$288.60
|
PP = $293.91
|
|
MB = $308.61
|
Most Recent Note - 9/4/2018 3:53:46 PM
Y - Stubbornly holding its ground after recently wedging to a new 52-week high with gains lacking volume conviction. Subsequent gains above the pivot point backed by at least +40% above average volume are still needed to clinch a proper new (or add-on) technical buy signal.
>>> FEATURED STOCK ARTICLE : Consolidating Near 50-Day Moving Average Line - 7/23/2018 |
View all notes |
Set NEW NOTE alert |
Company Profile |
SEC
News |
Chart |
Request a new note
C
A
S
I |
FIVE
-
NASDAQ
Five Below Inc
Retail-DiscountandVariety
|
$119.63
|
+3.16
2.71% |
$119.70
|
1,050,714
133.51% of 50 DAV
50 DAV is 787,000
|
$116.87
2.37%
|
7/6/2018
|
$98.90
|
PP = $104.09
|
|
MB = $109.29
|
Most Recent Note - 9/4/2018 5:07:29 PM
G - Hit another new all-time high with today's volume-driven gain. Prior highs and its 50 DMA line ($104.25) define near-term support to watch on pullbacks. Due to report Jul '18 quarterly results after the close on Thursday, September 6th. Volume and volatility often increase near earnings news.
>>> FEATURED STOCK ARTICLE : Volume Totals Cooling While Perched Near Record High - 8/16/2018 |
View all notes |
Set NEW NOTE alert |
Company Profile |
SEC
News |
Chart |
Request a new note
C
A
S
I |
NOW
-
NYSE
Servicenow Inc
Computer Sftwr-Enterprse
|
$200.26
|
+3.90
1.99% |
$200.66
|
1,679,098
99.18% of 50 DAV
50 DAV is 1,693,000
|
$201.00
-0.37%
|
8/24/2018
|
$193.83
|
PP = $194.91
|
|
MB = $204.66
|
Most Recent Note - 9/4/2018 5:38:33 PM
Y - Hovering near its 52-week high since the 8/29/18 gain above the pivot point backed by +77% above average volume clinched a new (or add-on) technical buy signal. The recent low ($174) defines the next important near-term support. Fundamentals remain strong.
>>> FEATURED STOCK ARTICLE : Slump Below 50-Day Average Line Raises Concerns - 8/17/2018 |
View all notes |
Set NEW NOTE alert |
Company Profile |
SEC
News |
Chart |
Request a new note
C
A
S
I |
NVEE
-
NASDAQ
N V 5 Global Inc
Comml Svcs-Consulting
|
$89.80
|
+1.35
1.53% |
$90.15
|
100,986
132.88% of 50 DAV
50 DAV is 76,000
|
$91.55
-1.91%
|
6/15/2018
|
$7,070.00
|
PP = $72.00
|
|
MB = $75.60
|
Most Recent Note - 9/4/2018 5:32:30 PM
G - Gradually rebounding near its all-time high since pricing a new Public Offering and gapping down on 8/09/18. Its 50 DMA line ($78.77) defines near-term support to watch on pullbacks.
>>> FEATURED STOCK ARTICLE : Remains Perched Near All-Time High Following Offering - 8/21/2018 |
View all notes |
Set NEW NOTE alert |
Company Profile |
SEC
News |
Chart |
Request a new note
C
A
S
I |
Symbol/Exchange
Company Name
Industry Group |
PRICE |
CHANGE
(%Change) |
Day High |
Volume
(% DAV)
(% 50 day avg vol) |
52 Wk Hi
% From Hi |
Featured
Date |
Price
Featured |
Pivot Featured |
|
Max Buy |
PANW
-
NYSE
Palo Alto Networks
Computer Sftwr-Security
|
$229.03
|
-2.12
-0.92% |
$232.88
|
1,323,126
115.96% of 50 DAV
50 DAV is 1,141,000
|
$232.31
-1.41%
|
6/12/2018
|
$206.55
|
PP = $214.69
|
|
MB = $225.42
|
Most Recent Note - 9/1/2018 10:05:21 AM
G - Color code is changed to green after rising above its "max buy" level and holding its ground stubbornly perched at its all-time high. Its 50 DMA line ($212.35) defines initial support above the prior low ($193 on 7/30/18).
>>> FEATURED STOCK ARTICLE : Violated 50-day Average With Volume-driven Loss - 7/31/2018 |
View all notes |
Set NEW NOTE alert |
Company Profile |
SEC
News |
Chart |
Request a new note
C
A
S
I |
QLYS
-
NASDAQ
Qualys Inc
Computer Sftwr-Security
|
$92.15
|
+1.10
1.21% |
$92.35
|
179,445
51.71% of 50 DAV
50 DAV is 347,000
|
$98.30
-6.25%
|
8/31/2018
|
$91.05
|
PP = $98.40
|
|
MB = $103.32
|
Most Recent Note - 9/1/2018 9:58:46 AM
Y- Consolidating near its 50 DMA line ($89.25). The recent low ($82.91 on 8/15/18) defines the next important near term support to watch. New pivot point is cited based on its 7/24/18 high plus 10 cents. Subsequent volume-driven gains above the pivot point may trigger a technical buy signal, however, it faces some near-term resistance due to overhead supply up to the $98 level. See the latest FSU analysis for more details and a new annotated graph.
>>> FEATURED STOCK ARTICLE : Cloud Security Firm Faces Some Near Term Resistance - 9/3/2018 |
View all notes |
Set NEW NOTE alert |
Company Profile |
SEC
News |
Chart |
Request a new note
C
A
S
I |
ANET
-
NYSE
Arista Networks Inc
TELECOMMUNICATIONS - Communication Equipment
|
$289.82
|
-9.16
-3.06% |
$294.00
|
2,015,824
198.80% of 50 DAV
50 DAV is 1,014,000
|
$313.37
-7.51%
|
8/24/2018
|
$308.26
|
PP = $311.77
|
|
MB = $327.36
|
Most Recent Note - 9/4/2018 12:29:08 PM
Y - Encountering distributional pressure with a loss today backed by higher volume. Subsequent volume-driven gains and a strong close above the pivot point would be a reassuring sign of fresh institutional buying demand. Color code was changed to yellow with new pivot point cited based on its 2/15/18 high plus 10 cents when it gapped up for a considerable volume-driven gain on 8/24/18, reaching a new all-time high.
>>> FEATURED STOCK ARTICLE : Considerable Gap Up Gain With Heavy Volume - 8/24/2018 |
View all notes |
Set NEW NOTE alert |
Company Profile |
SEC
News |
Chart |
Request a new note
C
A
S
I |
PAYC
-
NYSE
Paycom Software Inc
COMPUTER SOFTWARE and SERVICES - Application Software
|
$156.22
|
+1.10
0.71% |
$156.99
|
548,419
63.11% of 50 DAV
50 DAV is 869,000
|
$155.13
0.70%
|
8/1/2018
|
$122.87
|
PP = $118.55
|
|
MB = $124.48
|
Most Recent Note - 9/4/2018 4:00:45 PM
G - Hit yet another new all-time high today, getting very extended from prior highs in the $118 area. Fundamentals remain strong.
>>> FEATURED STOCK ARTICLE : Bullish Action Followed Strong Earnings News - 8/1/2018 |
View all notes |
Set NEW NOTE alert |
Company Profile |
SEC
News |
Chart |
Request a new note
C
A
S
I |
GRUB
-
NYSE
Grubhub Inc
INTERNET - Content
|
$144.00
|
-0.11
-0.08% |
$145.37
|
1,021,445
59.70% of 50 DAV
50 DAV is 1,711,000
|
$145.09
-0.75%
|
8/24/2018
|
$138.44
|
PP = $141.16
|
|
MB = $148.22
|
Most Recent Note - 9/1/2018 10:02:57 AM
Y - Quietly touched another new all-time high on Friday. Color code was changed to yellow with new pivot point cited based on its 7/26/18 high plus 10 cents, however, recent gains lacked great volume conviction. Gains above the pivot point backed by at least +40% above average volume are needed to trigger a proper new (or add-on) technical buy signal.
>>> FEATURED STOCK ARTICLE : Hovering Near Record High Following Considerable Rally - 8/2/2018 |
View all notes |
Set NEW NOTE alert |
Company Profile |
SEC
News |
Chart |
Request a new note
C
A
S
I |
Symbol/Exchange
Company Name
Industry Group |
PRICE |
CHANGE
(%Change) |
Day High |
Volume
(% DAV)
(% 50 day avg vol) |
52 Wk Hi
% From Hi |
Featured
Date |
Price
Featured |
Pivot Featured |
|
Max Buy |
HQY
-
NASDAQ
Healthequity Inc
COMPUTER SOFTWARE and SERVICES - Healthcare Information Service
|
$94.47
|
+0.26
0.28% |
$96.29
|
932,555
238.51% of 50 DAV
50 DAV is 391,000
|
$94.57
-0.11%
|
8/13/2018
|
$82.39
|
PP = $83.44
|
|
MB = $87.61
|
Most Recent Note - 9/4/2018 12:43:53 PM
G - Hit yet another new all-time high today. Getting more extended from prior highs in the $82-83 area defining support along with its 50 DMA line ($82.26).
>>> FEATURED STOCK ARTICLE : Perched Near All-Time High After Testing Support at 50-Day Average - 7/25/2018 |
View all notes |
Set NEW NOTE alert |
Company Profile |
SEC
News |
Chart |
Request a new note
C
A
S
I |
LOB
-
NASDAQ
"Live Oak Bancshares, Inc."
Banks-Southeast
|
$30.30
|
+0.05
0.17% |
$30.85
|
233,721
150.11% of 50 DAV
50 DAV is 155,700
|
$32.95
-8.04%
|
5/21/2018
|
$29.35
|
PP = $30.15
|
|
MB = $31.66
|
Most Recent Note - 9/4/2018 12:55:04 PM
G - Its Relative Strength Rating is 77, below the 80+ minimum guideline. Meeting resistance today, whereas a convincing rebound above the 50 DMA line ($30.49) would help its outlook improve. The recent low and 200 DMA line ($27.98) define important near-term chart support.
>>> FEATURED STOCK ARTICLE : Recently Met Resistance at 50-Day Moving Average - 8/28/2018 |
View all notes |
Set NEW NOTE alert |
Company Profile |
SEC
News |
Chart |
Request a new note
C
A
S
I |
PYPL
-
NASDAQ
Paypal Holdings Inc
Finance-CrdtCard/PmtPr
|
$93.07
|
+0.74
0.80% |
$93.44
|
6,433,163
90.72% of 50 DAV
50 DAV is 7,091,000
|
$93.01
0.06%
|
7/23/2018
|
$89.24
|
PP = $87.55
|
|
MB = $91.93
|
Most Recent Note - 9/4/2018 5:40:08 PM
G - Posted another gain today with below average volume for a new all-time high. Wedged above its "max buy" level and its color code was changed to green. Its 50 DMA line ($86.80) defines support above prior lows in the $80-81 area.
>>> FEATURED STOCK ARTICLE : Paypal Pulling Back From Record High - 7/26/2018 |
View all notes |
Set NEW NOTE alert |
Company Profile |
SEC
News |
Chart |
Request a new note
C
A
S
I |
OLLI
-
NASDAQ
Ollie's Bargain Outlet
Retail-DiscountandVariety
|
$87.95
|
+0.85
0.98% |
$88.00
|
874,108
148.66% of 50 DAV
50 DAV is 588,000
|
$87.75
0.23%
|
7/12/2018
|
$74.43
|
PP = $77.60
|
|
MB = $81.48
|
Most Recent Note - 9/4/2018 5:33:45 PM
G - Extended its winning streak to 13 consecutive gains. Reports financial results for the second quarter of fiscal 2018 on Wednesday, September 5, 2018 after the market closes. Prior highs in the $77 area define initial support to watch above its 50 DMA line ($74.65).
>>> FEATURED STOCK ARTICLE : Hitting New Highs With More Volume-Driven Gains - 8/22/2018 |
View all notes |
Set NEW NOTE alert |
Company Profile |
SEC
News |
Chart |
Request a new note
C
A
S
I |
NOVT
-
NASDAQ
Novanta Inc
Elec-Scientific/Msrng
|
$77.75
|
+1.15
1.50% |
$77.90
|
398,902
221.61% of 50 DAV
50 DAV is 180,000
|
$78.85
-1.40%
|
7/12/2018
|
$65.90
|
PP = $68.10
|
|
MB = $71.51
|
Most Recent Note - 9/4/2018 1:00:47 PM
G - Still perched near its 52-week high, extended from the prior base. Prior highs in the $68-69 area define support along with its 50 DMA line ($68.22).
>>> FEATURED STOCK ARTICLE : Electronic Systems Leader is Extended From Prior Base - 8/30/2018 |
View all notes |
Set NEW NOTE alert |
Company Profile |
SEC
News |
Chart |
Request a new note
C
A
S
I |
Symbol/Exchange
Company Name
Industry Group |
PRICE |
CHANGE
(%Change) |
Day High |
Volume
(% DAV)
(% 50 day avg vol) |
52 Wk Hi
% From Hi |
Featured
Date |
Price
Featured |
Pivot Featured |
|
Max Buy |
TEAM
-
NASDAQ
Atlassian Corp Plc Cl A
Comp Sftwr-Spec Enterprs
|
$91.90
|
+1.89
2.10% |
$92.24
|
1,560,322
125.93% of 50 DAV
50 DAV is 1,239,000
|
$91.42
0.53%
|
7/27/2018
|
$73.73
|
PP = $68.85
|
|
MB = $72.29
|
Most Recent Note - 9/4/2018 5:29:08 PM
G - Hit another new high with today's gain backed by greater volume conviction, getting more extended from any sound base. Its 50 DMA line ($73) defines near-term support above prior highs in the $68 area. Fundamentals through Jun '18 have been strong.
>>> FEATURED STOCK ARTICLE : Pullback Following Recent technical Breakout - 7/30/2018 |
View all notes |
Set NEW NOTE alert |
Company Profile |
SEC
News |
Chart |
Request a new note
C
A
S
I |
SEND
-
NYSE
Sendgrid Inc
INTERNET - Content
|
$36.84
|
+0.57
1.57% |
$37.16
|
877,928
101.61% of 50 DAV
50 DAV is 864,000
|
$36.77
0.19%
|
8/13/2018
|
$32.20
|
PP = $32.13
|
|
MB = $33.74
|
Most Recent Note - 9/4/2018 5:41:51 PM
G - Posted a gain today with average volume for another new all-time high, getting more extended from the latest base. Prior highs in the $32 area define initial support to watch above its 50 DMA line.
>>> FEATURED STOCK ARTICLE : Strength Returned After Finding Support Near Prior Lows - 8/14/2018 |
View all notes |
Set NEW NOTE alert |
Company Profile |
SEC
News |
Chart |
Request a new note
C
A
S
I |