***Last / Change / Volume data in this table is the closing quote data***
Symbol/Exchange
Company Name
Industry Group |
PRICE |
CHANGE
(%Change) |
Day High |
Volume
(% DAV)
(% 50 day avg vol) |
52 Wk Hi
% From Hi |
Featured
Date |
Price
Featured |
Pivot Featured |
|
Max Buy |
OSBC
-
NASDAQ
Old Second Bancorp Inc
BANKING - Regional - Midwest Banks
|
$15.40
|
+0.10
0.65% |
$15.55
|
52,059
67.79% of 50 DAV
50 DAV is 76,800
|
$16.30
-5.52%
|
5/21/2018
|
$15.50
|
PP = $15.10
|
|
MB = $15.86
|
Most Recent Note - 9/12/2018 7:27:27 PM
G - Consolidating above its 50 DMA line ($15.21). The prior low ($14) and 200 DMA line define additional near-term support. Its Relative Strength Rating is 80, at the minimum guideline for buy candidates. Met stubborn resistance after hitting a new high on 7/26/18 with a big volume-driven gain. Fundamentals remain strong.
>>> FEATURED STOCK ARTICLE : Bank Perched Less Than -5% Off Record High - 8/23/2018 |
View all notes |
Set NEW NOTE alert |
Company Profile |
SEC
News |
Chart |
Request a new note
C
A
S
I |
SIVB
-
NASDAQ
S V B Financial Group
BANKING - Regional - Pacific Banks
|
$319.29
|
+4.48
1.42% |
$321.32
|
325,440
80.16% of 50 DAV
50 DAV is 406,000
|
$333.74
-4.33%
|
8/6/2018
|
$314.77
|
PP = $329.75
|
|
MB = $346.24
|
Most Recent Note - 9/12/2018 7:26:11 PM
Y - Slumped near its 50 DMA line ($315.25) today, and further deterioration would raise concerns. Met resistance in recent weeks near prior highs. Subsequent gains above the pivot point backed by at least +40% above average volume may trigger a convincing new technical buy signal.
>>> FEATURED STOCK ARTICLE : Bank Posted Quiet Gain for a Best-Ever Close - 8/27/2018 |
View all notes |
Set NEW NOTE alert |
Company Profile |
SEC
News |
Chart |
Request a new note
C
A
S
I |
ZBRA
-
NASDAQ
Zebra Tech Corp Cl A
COMPUTER HARDWARE - Computer Peripherals
|
$178.70
|
+2.39
1.36% |
$179.47
|
509,801
140.06% of 50 DAV
50 DAV is 364,000
|
$177.56
0.64%
|
8/7/2018
|
$164.26
|
PP = $161.82
|
|
MB = $169.91
|
Most Recent Note - 9/12/2018 7:33:00 PM
G - Extended from any sound base after today's 4th consecutive gain with light volume for a new all-time high. Prior high in the $161 area defines initial support above its 50 DMA line ($156) Fundamentals remain strong.
>>> FEATURED STOCK ARTICLE : Big Gain for New High Backed by Heavy Volume - 8/7/2018 |
View all notes |
Set NEW NOTE alert |
Company Profile |
SEC
News |
Chart |
Request a new note
C
A
S
I |
EPAM
-
NYSE
Epam Systems Inc
COMPUTER SOFTWARE and SERVICES - Information Technology Service
|
$140.33
|
+0.39
0.28% |
$142.45
|
242,341
49.97% of 50 DAV
50 DAV is 485,000
|
$144.19
-2.68%
|
7/5/2018
|
$123.70
|
PP = $131.85
|
|
MB = $138.44
|
 Most Recent Note - 9/14/2018 3:34:24 PM
G - Color code is changed to green while wedging above its "max buy" level with a streak of small gains backed by light volume. Prior highs in the $137 area define near term support along with its 50 DMA line ($134.63). Fundamentals remain strong.
>>> FEATURED STOCK ARTICLE : Tech Services Firm Remains Fundamentally and Technically Strong - 8/20/2018 |
View all notes |
Set NEW NOTE alert |
Company Profile |
SEC
News |
Chart |
Request a new note
C
A
S
I |
IRBT
-
NASDAQ
Irobot Corp
CONSUMER DURABLES - Electronic Equipment
|
$108.72
|
+1.97
1.85% |
$109.40
|
419,246
42.65% of 50 DAV
50 DAV is 983,000
|
$118.75
-8.45%
|
8/29/2018
|
$112.07
|
PP = $109.88
|
|
MB = $115.37
|
Most Recent Note - 9/13/2018 5:47:42 PM
Y - Still sputtering below its pivot point. A big loss 9/06/18 on higher volume raised concerns while negating the recent breakout. Disciplined investors always limit losses by selling any stock that falls more than -7% from their purchase price.
>>> FEATURED STOCK ARTICLE : Household Appliance Maker Rallied From Choppy Base - 8/29/2018 |
View all notes |
Set NEW NOTE alert |
Company Profile |
SEC
News |
Chart |
Request a new note
C
A
S
I |
Symbol/Exchange
Company Name
Industry Group |
PRICE |
CHANGE
(%Change) |
Day High |
Volume
(% DAV)
(% 50 day avg vol) |
52 Wk Hi
% From Hi |
Featured
Date |
Price
Featured |
Pivot Featured |
|
Max Buy |
TSC
-
NASDAQ
TriState Capital Hld Inc
CONSUMER NON-DURABLES - Personal Products
|
$28.75
|
+0.25
0.88% |
$29.00
|
215,024
137.84% of 50 DAV
50 DAV is 156,000
|
$30.10
-4.49%
|
9/11/2018
|
$29.75
|
PP = $30.20
|
|
MB = $31.71
|
Most Recent Note - 9/13/2018 1:22:18 PM
G - Slumping today, raising concerns while violating its 50 DMA line ($28.77), and its color code is changed to green. Only a prompt rebound above the 50 DMA line would help its outlook improve. See the latest FSU analysis for more details and an annotated graph.
>>> FEATURED STOCK ARTICLE : TriState Bank Perched Near All-Time High - 9/11/2018 |
View all notes |
Set NEW NOTE alert |
Company Profile |
SEC
News |
Chart |
Request a new note
C
A
S
I |
FLT
-
NYSE
Fleetcor Technologies
DIVERSIFIED SERVICES - Business/Management Services
|
$221.08
|
-0.56
-0.25% |
$222.79
|
319,012
53.89% of 50 DAV
50 DAV is 592,000
|
$225.92
-2.14%
|
9/12/2018
|
$221.01
|
PP = $226.02
|
|
MB = $237.32
|
Most Recent Note - 9/12/2018 7:22:46 PM
Y - Color code is changed to yellow after rallying above its 50 DMA line ($217). New pivot point cited is based on its 7/25/18 high plus 10 cents. Subsequent volume-driven gains above the pivot point may trigger a new (or add-on) technical buy signal. The prior low ($210.64 on 8/03/18) defines important near-term support above its 200 DMA line($202). Fundamentals remain strong.
>>> FEATURED STOCK ARTICLE : Testing 50-Day Average With Loss on Higher Volume - 8/3/2018 |
View all notes |
Set NEW NOTE alert |
Company Profile |
SEC
News |
Chart |
Request a new note
C
A
S
I |
MA
-
NYSE
Mastercard Inc Cl A
Finance-CrdtCard/PmtPr
|
$217.96
|
+0.74
0.34% |
$218.82
|
2,600,980
83.69% of 50 DAV
50 DAV is 3,108,000
|
$218.69
-0.33%
|
7/11/2018
|
$203.84
|
PP = $204.10
|
|
MB = $214.31
|
Most Recent Note - 9/12/2018 7:29:34 PM
Y - Quietly perched near its all-time high. Its 50 DMA line ($206) defines support above the prior lows in the $193-196 area. Fundamentals remain strong.
>>> FEATURED STOCK ARTICLE : Found Support Near 50-Day Moving Average Line - 8/10/2018 |
View all notes |
Set NEW NOTE alert |
Company Profile |
SEC
News |
Chart |
Request a new note
C
A
S
I |
V
-
NYSE
Visa Inc Cl A
Finance-CrdtCard/PmtPr
|
$147.84
|
+0.21
0.14% |
$148.37
|
4,846,715
66.63% of 50 DAV
50 DAV is 7,274,000
|
$148.07
-0.15%
|
4/26/2018
|
$126.68
|
PP = $126.98
|
|
MB = $133.33
|
Most Recent Note - 9/13/2018 5:40:45 PM
G - Endured distributional pressure and it is extended from any sound base. Its 50 DMA line ($141) and recent low ($135.31 on 7/30/18) define important near-term support to watch on pullbacks. Fundamentals remain strong. See the latest FSU analysis for more details and an annotated graph.
>>> FEATURED STOCK ARTICLE : Visa Near Record but Endured Distributional Pressure - 9/13/2018 |
View all notes |
Set NEW NOTE alert |
Company Profile |
SEC
News |
Chart |
Request a new note
C
A
S
I |
NANO
-
NASDAQ
Nanometrics Inc
ELECTRONICS - Scientific and Technical Instrum
|
$36.80
|
-0.23
-0.62% |
$37.59
|
671,739
163.84% of 50 DAV
50 DAV is 410,000
|
$48.26
-23.75%
|
8/13/2018
|
$44.17
|
PP = $44.27
|
|
MB = $46.48
|
Most Recent Note - 9/12/2018 7:12:34 PM
G - Slumped further below its 50 DMA line ($40.05) with today's 8th consecutive volume-driven loss raising concerns. A rebound above the 50 DMA line is needed for its outlook to improve. Fundamentals remain strong.
>>> FEATURED STOCK ARTICLE : Five Times Average Volume Behind Breakout Gain - 8/13/2018 |
View all notes |
Set NEW NOTE alert |
Company Profile |
SEC
News |
Chart |
Request a new note
C
A
S
I |
Symbol/Exchange
Company Name
Industry Group |
PRICE |
CHANGE
(%Change) |
Day High |
Volume
(% DAV)
(% 50 day avg vol) |
52 Wk Hi
% From Hi |
Featured
Date |
Price
Featured |
Pivot Featured |
|
Max Buy |
ENV
-
NYSE
Envestnet Inc
FINANCIAL SERVICES - Diversified Investments
|
$63.10
|
-0.70
-1.10% |
$64.80
|
146,869
54.00% of 50 DAV
50 DAV is 272,000
|
$64.00
-1.41%
|
6/15/2018
|
$57.85
|
PP = $60.37
|
|
MB = $63.39
|
Most Recent Note - 9/12/2018 7:19:17 PM
Y - Perched near its all-time high, stubbornly holding its ground. Found prompt support near its 50 DMA line ($60.23) in recent weeks. Fundamentals remain strong.
>>> FEATURED STOCK ARTICLE : Earnings News Due for Financial Firm Perched Near High - 8/6/2018 |
View all notes |
Set NEW NOTE alert |
Company Profile |
SEC
News |
Chart |
Request a new note
C
A
S
I |
TPL
-
NYSE
Texas Pacific Land Trust
Real Estate Dvlpmt/Ops
|
$824.25
|
-16.91
-2.01% |
$835.11
|
18,863
145.10% of 50 DAV
50 DAV is 13,000
|
$874.00
-5.69%
|
9/14/2018
|
$820.45
|
PP = $874.10
|
|
MB = $917.81
|
Most Recent Note - 9/14/2018 12:56:15 PM
Y - Color code is changed to yellow after forming an advanced "3-weeks tight" base. New pivot point cited is based on its 8/27/18 high plus 10 cents. Subsequent volume-driven gains above the pivot point may trigger a new (or add-on) technical buy signal. The 50 DMA line ($797) and recent low ($760 on 8/15/18) define important near-term support to watch on pullbacks.
>>> FEATURED STOCK ARTICLE : Best Ever Close After a Solid Gain on Higher Volume - 9/4/2018 |
View all notes |
Set NEW NOTE alert |
Company Profile |
SEC
News |
Chart |
Request a new note
C
A
S
I |
FIZZ
-
NASDAQ
National Beverage Corp
FOOD and BEVERAGE - Beverages - Soft Drinks
|
$116.92
|
-6.58
-5.33% |
$123.40
|
291,067
144.81% of 50 DAV
50 DAV is 201,000
|
$127.32
-8.17%
|
9/6/2018
|
$125.92
|
PP = $129.92
|
|
MB = $136.42
|
Most Recent Note - 9/14/2018 4:56:54 PM
Y - Retreated from its high and ended near the session low with today's loss backed by above average volume. Highlighted in yellow with new pivot point cited based on its 9/11/17 high plus 10 cents in the 9/06/18 mid-day report, it challenged its high with a big gain backed by +111% above average volume, but met resistance. Subsequent gains above the pivot point for a a new high (N criteria) backed by at least +40% above average volume may trigger a proper technical buy signal. Reported Jun '17 quarterly earnings +32% on +20% sales revenues, continuing its streak of strong quarterly earnings (C criteria) results. Annual earnings (A criteria) growth has been strong after a downturn in FY '14. Small supply of only 11.2 million shares (S criteria) in the public float can contribute to greater volatility.
>>> FEATURED STOCK ARTICLE : Strong Beverage Firm Challenges Prior High - 9/6/2018 |
View all notes |
Set NEW NOTE alert |
Company Profile |
SEC
News |
Chart |
Request a new note
C
A
S
I |
ODFL
-
NASDAQ
Old Dominion Fght Line
TRANSPORTATION - Trucking
|
$165.89
|
-0.49
-0.29% |
$168.70
|
561,169
95.76% of 50 DAV
50 DAV is 586,000
|
$170.22
-2.54%
|
9/6/2018
|
$163.11
|
PP = $164.20
|
|
MB = $172.41
|
Most Recent Note - 9/14/2018 3:40:25 PM
Y - Volume totals have been cooling while stubbornly holding its ground. Prior highs in the $164 area define initial support to watch after aain above the pivot point on 9/06/18 backed by +80% above average volume triggered a technical buy signal.
>>> FEATURED STOCK ARTICLE : Trucking Firm Perched at All-Time High - 9/7/2018 |
View all notes |
Set NEW NOTE alert |
Company Profile |
SEC
News |
Chart |
Request a new note
C
A
S
I |
DPZ
-
NYSE
Dominos Pizza Inc
Retail-Restaurants
|
$280.05
|
-4.79
-1.68% |
$285.95
|
734,710
128.00% of 50 DAV
50 DAV is 574,000
|
$305.34
-8.28%
|
8/13/2018
|
$288.60
|
PP = $293.91
|
|
MB = $308.61
|
Most Recent Note - 9/11/2018 5:12:23 PM
Y - Still enduring mild distributional pressure after recently wedging to new 52-week highs with gains lacking volume conviction. Subsequent gains above the pivot point backed by at least +40% above average volume are still needed to clinch a proper new (or add-on) technical buy signal.
>>> FEATURED STOCK ARTICLE : Pulling Back After Wedging Gains for Highs Lacked Great Volume - 9/5/2018 |
View all notes |
Set NEW NOTE alert |
Company Profile |
SEC
News |
Chart |
Request a new note
C
A
S
I |
Symbol/Exchange
Company Name
Industry Group |
PRICE |
CHANGE
(%Change) |
Day High |
Volume
(% DAV)
(% 50 day avg vol) |
52 Wk Hi
% From Hi |
Featured
Date |
Price
Featured |
Pivot Featured |
|
Max Buy |
FIVE
-
NASDAQ
Five Below Inc
Retail-DiscountandVariety
|
$130.27
|
-0.58
-0.44% |
$131.85
|
1,039,811
111.93% of 50 DAV
50 DAV is 929,000
|
$136.13
-4.31%
|
7/6/2018
|
$98.90
|
PP = $104.09
|
|
MB = $109.29
|
Most Recent Note - 9/14/2018 3:36:23 PM
G - Stubbornly holding its ground near its all-time high following a consider gap up and volume-driven gain on 9/07/18. Bullish action came after reporting earnings +40% on +23% sales revenues for the Jul '18 quarter, continuing its strong earnings track record. Prior highs and its 50 DMA line ($108.82) define near-term support to watch on pullbacks.
>>> FEATURED STOCK ARTICLE : Volume Totals Cooling While Perched Near Record High - 8/16/2018 |
View all notes |
Set NEW NOTE alert |
Company Profile |
SEC
News |
Chart |
Request a new note
C
A
S
I |
NOW
-
NYSE
Servicenow Inc
Computer Sftwr-Enterprse
|
$202.97
|
-1.61
-0.79% |
$205.34
|
1,218,679
70.24% of 50 DAV
50 DAV is 1,735,000
|
$206.30
-1.61%
|
8/24/2018
|
$193.83
|
PP = $194.91
|
|
MB = $204.66
|
Most Recent Note - 9/12/2018 7:35:15 PM
Y - Finished strong today as it posted a 5th consecutive gain with near average volume and hit a new 52-week high. The 8/29/18 gain above the pivot point backed by +77% above average volume clinched a new (or add-on) technical buy signal. The recent low ($174) defines the next important near-term support. Fundamentals remain strong.
>>> FEATURED STOCK ARTICLE : Slump Below 50-Day Average Line Raises Concerns - 8/17/2018 |
View all notes |
Set NEW NOTE alert |
Company Profile |
SEC
News |
Chart |
Request a new note
C
A
S
I |
NVEE
-
NASDAQ
N V 5 Global Inc
Comml Svcs-Consulting
|
$89.20
|
+0.00
0.00% |
$89.85
|
45,511
59.88% of 50 DAV
50 DAV is 76,000
|
$92.75
-3.83%
|
6/15/2018
|
$7,070.00
|
PP = $72.00
|
|
MB = $75.60
|
Most Recent Note - 9/12/2018 7:31:07 PM
G - Perched near its all-time high, extended from any sound base. Completed a new Public Offering on 8/09/18. Its 50 DMA line ($81.32) defines near-term support to watch on pullbacks.
>>> FEATURED STOCK ARTICLE : Remains Perched Near All-Time High Following Offering - 8/21/2018 |
View all notes |
Set NEW NOTE alert |
Company Profile |
SEC
News |
Chart |
Request a new note
C
A
S
I |
PANW
-
NYSE
Palo Alto Networks
Computer Sftwr-Security
|
$234.62
|
-1.48
-0.63% |
$237.47
|
985,873
79.06% of 50 DAV
50 DAV is 1,247,000
|
$239.50
-2.04%
|
6/12/2018
|
$206.55
|
PP = $214.69
|
|
MB = $225.42
|
Most Recent Note - 9/14/2018 3:43:56 PM
G - Volume totals have cooled while stubbornly holding its ground near its all-time high following volume-driven gains. Its 50 DMA line ($216.82) defines initial support above the prior low ($193 on 7/30/18). Reported +39% earnings on +29% sales revenues for the Jul '18 quarter, continuing its strong earnings track record.
>>> FEATURED STOCK ARTICLE : Violated 50-day Average With Volume-driven Loss - 7/31/2018 |
View all notes |
Set NEW NOTE alert |
Company Profile |
SEC
News |
Chart |
Request a new note
C
A
S
I |
QLYS
-
NASDAQ
Qualys Inc
Computer Sftwr-Security
|
$94.60
|
-0.25
-0.26% |
$95.85
|
148,357
44.69% of 50 DAV
50 DAV is 332,000
|
$98.30
-3.76%
|
8/31/2018
|
$91.05
|
PP = $98.40
|
|
MB = $103.32
|
Most Recent Note - 9/12/2018 7:37:18 PM
Y - Color code is changed to yellow while consolidating above its 50 DMA line ($90.04). Subsequent volume-driven gains above the pivot point may trigger a technical buy signal. The recent low ($82.91 on 8/15/18) defines the next important near term support to watch.
>>> FEATURED STOCK ARTICLE : Cloud Security Firm Faces Some Near Term Resistance - 9/3/2018 |
View all notes |
Set NEW NOTE alert |
Company Profile |
SEC
News |
Chart |
Request a new note
C
A
S
I |
Symbol/Exchange
Company Name
Industry Group |
PRICE |
CHANGE
(%Change) |
Day High |
Volume
(% DAV)
(% 50 day avg vol) |
52 Wk Hi
% From Hi |
Featured
Date |
Price
Featured |
Pivot Featured |
|
Max Buy |
ANET
-
NYSE
"Arista Networks, Inc"
TELECOMMUNICATIONS - Communication Equipment
|
$271.25
|
+1.19
0.44% |
$273.69
|
1,003,804
91.76% of 50 DAV
50 DAV is 1,093,900
|
$313.37
-13.44%
|
8/24/2018
|
$308.26
|
PP = $311.77
|
|
MB = $327.36
|
Most Recent Note - 9/13/2018 5:44:23 PM
G - Color code is changed to green while sputtering below its 50 DMA line ($273.59). Found support at its 200 DMA line ($263), but more damaging losses would raise serious concerns. Subsequent gains above its 50 DMA line are needed for its outlook to improve.
>>> FEATURED STOCK ARTICLE : Considerable Gap Up Gain With Heavy Volume - 8/24/2018 |
View all notes |
Set NEW NOTE alert |
Company Profile |
SEC
News |
Chart |
Request a new note
C
A
S
I |
PAYC
-
NYSE
Paycom Software Inc
COMPUTER SOFTWARE and SERVICES - Application Software
|
$163.32
|
+1.23
0.76% |
$164.08
|
514,262
68.30% of 50 DAV
50 DAV is 753,000
|
$162.72
0.37%
|
8/1/2018
|
$122.87
|
PP = $118.55
|
|
MB = $124.48
|
Most Recent Note - 9/13/2018 5:45:46 PM
G - Hit yet another new all-time high today, getting very extended from any sound base. Fundamentals remain strong.
>>> FEATURED STOCK ARTICLE : Bullish Action Followed Strong Earnings News - 8/1/2018 |
View all notes |
Set NEW NOTE alert |
Company Profile |
SEC
News |
Chart |
Request a new note
C
A
S
I |
GRUB
-
NYSE
Grubhub Inc
INTERNET - Content
|
$146.11
|
+1.14
0.79% |
$149.35
|
927,648
65.33% of 50 DAV
50 DAV is 1,420,000
|
$147.72
-1.09%
|
8/24/2018
|
$138.44
|
PP = $141.16
|
|
MB = $148.22
|
Most Recent Note - 9/11/2018 5:13:47 PM
Y - Posted a solid gain today with only average volume as it hit a new all-time high. Recent gains lacked great volume conviction. Gains above the pivot point backed by at least +40% above average volume are needed to trigger a proper new (or add-on) technical buy signal.
>>> FEATURED STOCK ARTICLE : Hovering Near Record High Following Considerable Rally - 8/2/2018 |
View all notes |
Set NEW NOTE alert |
Company Profile |
SEC
News |
Chart |
Request a new note
C
A
S
I |
HQY
-
NASDAQ
Healthequity Inc
COMPUTER SOFTWARE and SERVICES - Healthcare Information Service
|
$94.70
|
+0.39
0.41% |
$99.99
|
12,299,984
3,022.11% of 50 DAV
50 DAV is 407,000
|
$97.94
-3.31%
|
8/13/2018
|
$82.39
|
PP = $83.44
|
|
MB = $87.61
|
Most Recent Note - 9/14/2018 4:55:02 PM
G - Churned very heavy volume in the final minutes of the session and hit a new all-time high but ended near the session low. Very extended from any sound base. Its 50 DMA line ($85.34) and prior highs in the $82-83 area define support to watch on pullbacks.
>>> FEATURED STOCK ARTICLE : Very Extended From Any Sound Base After Streak of Gains - 9/10/2018 |
View all notes |
Set NEW NOTE alert |
Company Profile |
SEC
News |
Chart |
Request a new note
C
A
S
I |
PYPL
-
NASDAQ
Paypal Holdings Inc
Finance-CrdtCard/PmtPr
|
$90.78
|
-1.41
-1.53% |
$92.68
|
9,137,062
128.58% of 50 DAV
50 DAV is 7,106,000
|
$93.70
-3.12%
|
7/23/2018
|
$89.24
|
PP = $87.55
|
|
MB = $91.93
|
Most Recent Note - 9/12/2018 7:17:06 PM
G - Posted a 3rd consecutive gain and its color code is changed to green after rising back above its "max buy" level. Its 50 DMA line ($87.71) defines support above prior lows in the $80-81 area. See the latest FSU analysis for more details and a new annotated graph.
>>> FEATURED STOCK ARTICLE : Consolidating Above 50-Day Moving Average Near High - 9/12/2018 |
View all notes |
Set NEW NOTE alert |
Company Profile |
SEC
News |
Chart |
Request a new note
C
A
S
I |
Symbol/Exchange
Company Name
Industry Group |
PRICE |
CHANGE
(%Change) |
Day High |
Volume
(% DAV)
(% 50 day avg vol) |
52 Wk Hi
% From Hi |
Featured
Date |
Price
Featured |
Pivot Featured |
|
Max Buy |
OLLI
-
NASDAQ
Ollie's Bargain Outlet
Retail-DiscountandVariety
|
$90.85
|
+0.30
0.33% |
$91.30
|
378,085
61.18% of 50 DAV
50 DAV is 618,000
|
$94.70
-4.07%
|
7/12/2018
|
$74.43
|
PP = $77.60
|
|
MB = $81.48
|
Most Recent Note - 9/14/2018 3:42:06 PM
G - Perched at its all-time high, extended from any sound base. Prior highs in the $77 area define support along with its 50 DMA line ($77.57). Reported earnings +48% on +13% sales revenues for the Jul '18 quarter, continuing its strong earnings track record.
>>> FEATURED STOCK ARTICLE : Hitting New Highs With More Volume-Driven Gains - 8/22/2018 |
View all notes |
Set NEW NOTE alert |
Company Profile |
SEC
News |
Chart |
Request a new note
C
A
S
I |
NOVT
-
NASDAQ
Novanta Inc
Elec-Scientific/Msrng
|
$74.15
|
-0.05
-0.07% |
$75.55
|
241,473
127.76% of 50 DAV
50 DAV is 189,000
|
$78.85
-5.96%
|
7/12/2018
|
$65.90
|
PP = $68.10
|
|
MB = $71.51
|
Most Recent Note - 9/14/2018 12:46:46 PM
G - Extended from the prior base, consolidating above its 50 DMA line ($70.37) and prior highs in the $68-69 area defining important near-term support to watch.
>>> FEATURED STOCK ARTICLE : Electronic Systems Leader is Extended From Prior Base - 8/30/2018 |
View all notes |
Set NEW NOTE alert |
Company Profile |
SEC
News |
Chart |
Request a new note
C
A
S
I |
TEAM
-
NASDAQ
Atlassian Corp Plc Cl A
Comp Sftwr-Spec Enterprs
|
$94.18
|
+0.76
0.81% |
$95.00
|
1,169,349
87.01% of 50 DAV
50 DAV is 1,344,000
|
$94.72
-0.57%
|
7/27/2018
|
$73.73
|
PP = $68.85
|
|
MB = $72.29
|
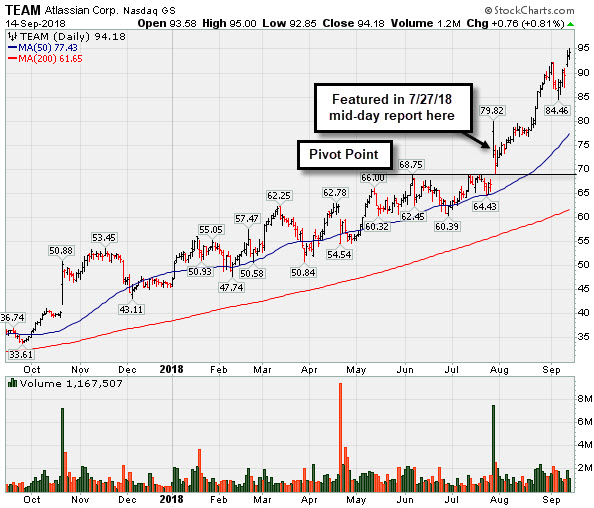
Most Recent Note - 9/14/2018 4:52:04 PM
G - Posted a gain on light volume for another new all-time high, getting more extended from any sound base. The 50 DMA line ($77.43) defines near-term support to watch on pullbacks. Fundamentals through Jun '18 have been strong. See the latest FSU analysis for more details and a new annotated graph.
>>> FEATURED STOCK ARTICLE : Extended From Base and Hitting Another New High - 9/14/2018 |
View all notes |
Set NEW NOTE alert |
Company Profile |
SEC
News |
Chart |
Request a new note
C
A
S
I |
SEND
-
NYSE
Sendgrid Inc
INTERNET - Content
|
$36.21
|
-1.05
-2.82% |
$37.08
|
958,996
104.58% of 50 DAV
50 DAV is 917,000
|
$38.66
-6.34%
|
8/13/2018
|
$32.20
|
PP = $32.13
|
|
MB = $33.74
|
Most Recent Note - 9/12/2018 7:24:38 PM
G - Very extended from the latest base, it pulled back from its all-time high with a loss today on light volume. Prior highs in the $32 area define initial support to watch above its 50 DMA line.
>>> FEATURED STOCK ARTICLE : Strength Returned After Finding Support Near Prior Lows - 8/14/2018 |
View all notes |
Set NEW NOTE alert |
Company Profile |
SEC
News |
Chart |
Request a new note
C
A
S
I |