You are not logged in.
This means you
CAN ONLY VIEW reports that were published prior to Sunday, April 20, 2025.
You
MUST UPGRADE YOUR MEMBERSHIP if you want to see any current reports.
AFTER MARKET UPDATE - TUESDAY, AUGUST 22ND, 2017
Previous After Market Report Next After Market Report >>>
|
|
|
|
DOW |
+196.14 |
21,899.89 |
+0.90% |
|
Volume |
688,206,690 |
-4% |
|
Volume |
1,594,984,370 |
+2% |
|
NASDAQ |
+84.35 |
6,297.48 |
+1.36% |
|
Advancers |
2,092 |
72% |
|
Advancers |
2,024 |
70% |
|
S&P 500 |
+24.14 |
2,452.51 |
+0.99% |
|
Decliners |
818 |
28% |
|
Decliners |
849 |
30% |
|
Russell 2000 |
+14.63 |
1,371.54 |
+1.08% |
|
52 Wk Highs |
82 |
|
|
52 Wk Highs |
52 |
|
|
S&P 600 |
+8.12 |
825.37 |
+0.99% |
|
52 Wk Lows |
46 |
|
|
52 Wk Lows |
64 |
|
|
 |
Major Indices Rebounded With Improved Leadership
Kenneth J. Gruneisen - Passed the CAN SLIM® Master's Exam
Stocks climbed higher on Tuesday. The Dow added 196 points to 21899. The S&P 500 gained 24 points to 2452 and the Nasdaq Composite advanced 84 points to 6297, both rebounding above their 50-day moving average (DMA) lines. Volume totals reported were mixed, lighter than the prior session total on the NYSE and higher on the Nasdaq exchange. Breadth was positive by more than a 2-1 margin on the NYSE and on the Nasdaq exchange. There were 45 high-ranked companies from the Leaders List that made new 52-week highs and were listed on the BreakOuts Page, versus the total of 19 on the prior session. New 52-week highs outnumbered new 52-week lows on the NYSE but new again outnumbered new highs on the Nasdaq exchange. The Featured Stocks Page provides the latest analysis on noteworthy high-ranked leaders. Charts used courtesy of www.stockcharts.com
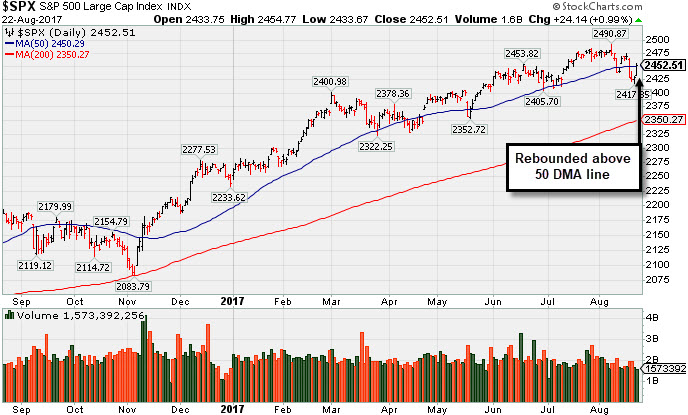 PICTURED: The S&P 500 Index rebounded above its 50-day moving average (DMA) line. The major averages' (M criteria) prior uptrend has been under pressure while leadership has been thinning. Investors should be ready to raise cash and reduce exposure to stocks by selling individual issues on a case-by-case basis as they trigger technical sell signals.
The Dow experienced its best session since April as optimism concerning tax reforms buoyed equities and sent government bonds and gold prices lower. According to a report from Politico, the Trump administration and key lawmakers have reportedly found common ground on how to approach tax reform. On the data front, June’s FHFA House Price Index marked an increase of 0.1%, missing analyst estimates for a rise of 0.5%.
Ten of 11 sectors in the S&P 500 finished in positive territory. Financials and Technology stocks paced the gains while Real Estate shares lagged after the FHFA release. Boeing (BA +1.73%) led gainers on the Dow, rising 1.7% $239.75 after the company received a government missile contract. Shoe retailer DSW (DSW +17.46%) rose after it posted same-store sales growth for the first time in six quarters. Coty (COTY -9.41%) fell while Medtronic (MDT -2.11%) after each company missed Wall Street revenue expectations.
Treasuries slid with the benchmark 10-year note losing 9/32 to yield 2.21%. In commodities, NYMEX WTI crude rebounded 0.6% at $47.64/barrel. COMEX gold slid 0.4% to $1285.10/ounce while the U.S. Dollar Index advanced 0.4% against its peers. |
 Kenneth J. Gruneisen started out as a licensed stockbroker in August 1987, a couple of months prior to the historic stock market crash that took the Dow Jones Industrial Average down -22.6% in a single day. He has published daily fact-based fundamental and technical analysis on high-ranked stocks online for two decades. Through FACTBASEDINVESTING.COM, Kenneth provides educational articles, news, market commentary, and other information regarding proven investment systems that work in good times and bad.
Comments contained in the body of this report are technical opinions only and are not necessarily those of Gruneisen Growth Corp. The material herein has been obtained from sources believed to be reliable and accurate, however, its accuracy and completeness cannot be guaranteed. Our firm, employees, and customers may effect transactions, including transactions contrary to any recommendation herein, or have positions in the securities mentioned herein or options with respect thereto. Any recommendation contained in this report may not be suitable for all investors and it is not to be deemed an offer or solicitation on our part with respect to the purchase or sale of any securities. |
|
 |
Financial, Retail, Tech and Energy Groups Rose
Kenneth J. Gruneisen - Passed the CAN SLIM® Master's Exam
On Tuesday the Bank Index ($BKX +1.11%) and the Broker/Dealer Index ($XBD +1.30%) helped give a boost to the major indices while the Retail Index ($RLX +1.14%) also rose. The tech sector had a positivbe bias as the Semiconductor Index ($SOX +1.61%), Networking Index ($NWX +1.25%), and the Biotechnology Index ($BTK +2.10%) posted solid gains. The Oil Services Index ($OSX +0.90%) and the Integrated Oil Index ($XOI +0.76%) both posted gains. The Gold & Silver Index ($XAU -0.62%) was a standout decliner. Charts courtesy www.stockcharts.com
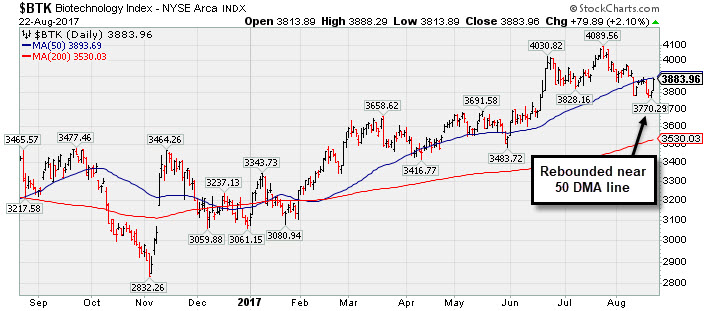 PICTURED: The Biotechnology Index ($BTK +0.45%) rebounded near its 50-day moving average (DMA) line.
| Oil Services |
$OSX |
119.17 |
+1.06 |
+0.90% |
-35.16% |
| Integrated Oil |
$XOI |
1,088.79 |
+8.18 |
+0.76% |
-14.13% |
| Semiconductor |
$SOX |
1,081.64 |
+17.12 |
+1.61% |
+19.32% |
| Networking |
$NWX |
454.84 |
+5.63 |
+1.25% |
+1.96% |
| Broker/Dealer |
$XBD |
226.60 |
+2.91 |
+1.30% |
+10.39% |
| Retail |
$RLX |
1,463.18 |
+16.49 |
+1.14% |
+8.95% |
| Gold & Silver |
$XAU |
84.88 |
-0.53 |
-0.62% |
+7.63% |
| Bank |
$BKX |
93.88 |
+1.03 |
+1.11% |
+2.28% |
| Biotech |
$BTK |
3,883.96 |
+79.89 |
+2.10% |
+26.31% |
|
|
|
 |
Seriously Applying the Fact-Based System Now
Kenneth J. Gruneisen - Passed the CAN SLIM® Master's Exam
Edwards Lifesciences Cp (EW +$0.36 or +0.32% to $112.23) managed a "positive reversal" after slumping to new 16-week lows today, closing with a gain backed by above average volume. It is only -7.8% off its all-time high, but its Relative Strength Rating has slumped to 70, below the 80+ minimum guideline for buy candidates. A rebound above its downward sloping 50 DMA line ($115.64) is needed for its outlook to improve. Fundamentals remain strong. More damaging losses would raise greater concerns. Subsequent volume-driven gains for new highs may trigger a new (or add-on) technical buy signal which could mark the beginning of a new leg up. Recently it reported Jun '17 quarterly earnings +42% on +11% sales revenues, continuing its strong earnings track record. Three of the past 4 quarterly comparisons had earnings above the +25% minimum guideline (C criteria) and its annual earnings growth (A criteria) is a good match with the fact-based investment system's fundamental guidelines. It was last shown in this FSU section on 8/07/17 with an annotated graph under the headline, " Near 50-Day Moving Average Line, Yet Not Far Off High". It was highlighted in yellow in the 5/16/17 mid-day report with pivot point cited based on its high after a cup-with-handle base (read here).
The Medical - Products firm has seen the number of top-rated funds owning its shares rise from 1489 in Jun '16 to 1,514 in Jun '17, a slightly reassuring sign of institutional demand (I criteria). Its current Up/Down Volume Ratio of 0.9 is an unbiased indication its shares have been under slight distributional pressure over the past 50 days. It has a B Timeliness Rating and a B Sponsorship rating. |
|
|
Color Codes Explained :
Y - Better candidates highlighted by our
staff of experts.
G - Previously featured
in past reports as yellow but may no longer be buyable under the
guidelines.
***Last / Change / Volume data in this table is the closing quote data***
Symbol/Exchange
Company Name
Industry Group |
PRICE |
CHANGE
(%Change) |
Day High |
Volume
(% DAV)
(% 50 day avg vol) |
52 Wk Hi
% From Hi |
Featured
Date |
Price
Featured |
Pivot Featured |
|
Max Buy |
THO
-
NYSE
Thor Industries Inc
AUTOMOTIVE - Recreational Vehicles
|
$103.90
|
+0.45
0.43% |
$104.45
|
274,487
52.18% of 50 DAV
50 DAV is 526,000
|
$115.74
-10.23%
|
8/14/2017
|
$106.67
|
PP = $110.01
|
|
MB = $115.51
|
Most Recent Note - 8/21/2017 5:55:27 PM
G - Still sputtering below its 50 DMA line ($105). A rebound above the 50 DMA line is needed for its outlook improve. Subsequent volume-driven gains above the pivot point may trigger a new (or add-on) technical buy signal. See the latest FSU analysis for more details and a new annotated graph.
>>> FEATURED STOCK ARTICLE : Slump Below 50-Day Average Hurt Technical Stance - 8/21/2017 |
View all notes |
Set NEW NOTE alert |
Company Profile |
SEC
News |
Chart |
Request a new note
C
A
S
I |
BERY
-
NYSE
Berry Global Group Inc
CONSUMER NON-DURABLES - Packaging and Containers
|
$57.64
|
+0.78
1.37% |
$57.68
|
549,309
62.56% of 50 DAV
50 DAV is 878,000
|
$58.95
-2.22%
|
7/14/2017
|
$57.67
|
PP = $59.05
|
|
MB = $62.00
|
Most Recent Note - 8/21/2017 6:02:19 PM
G - Slumped below its 50 DMA line ($57.45) with today's loss on lighter volume. The recent low defines important near-term support ($55.60 on 8/03/17). Reported Jun '17 quarterly earnings +13% on +16% sales revenues, below the +25% minimum earnings guideline (C criteria), raising fundamental concerns.
>>> FEATURED STOCK ARTICLE : Fundamental Concerns Yet Rebound Helped Technical Stance - 8/14/2017 |
View all notes |
Set NEW NOTE alert |
Company Profile |
SEC
News |
Chart |
Request a new note
C
A
S
I |
HSKA
-
NASDAQ
Heska Corporation
DRUGS - Biotechnology
|
$99.59
|
+0.20
0.20% |
$100.37
|
60,399
91.51% of 50 DAV
50 DAV is 66,000
|
$115.00
-13.40%
|
7/31/2017
|
$114.27
|
PP = $110.35
|
|
MB = $115.87
|
Most Recent Note - 8/21/2017 6:07:50 PM
G - Rebounded near its 50 DMA line ($99.91) with today's gain on higher (near average) volume. Encountered distributional pressure since highlighted in yellow in the 7/31/17 mid-day report with pivot point cited based on its high hit on 5/01/17 plus 10 cents. Failed to produce confirming gains since repeatedly noted - "Subsequent gains and a strong finish above its pivot point may clinch a convincing technical buy signal. Small supply of only 6 million shares in the public float (S criteria) can contribute to greater price volatility in the event of institutional buying or selling."
>>> FEATURED STOCK ARTICLE : Small Supply of Shares and Closed In Lower Half of Intra-day Range - 7/31/2017 |
View all notes |
Set NEW NOTE alert |
Company Profile |
SEC
News |
Chart |
Request a new note
C
A
S
I |
EW
-
NYSE
Edwards Lifesciences Cp
HEALTH SERVICES - Medical Appliances and Equipment
|
$114.22
|
+0.00
0.00% |
$115.09
|
1,432,887
119.66% of 50 DAV
50 DAV is 1,197,500
|
$121.75
-6.18%
|
7/11/2017
|
$117.23
|
PP = $121.85
|
|
MB = $127.94
|
Most Recent Note - 8/17/2017 11:17:34 AM
G - Perched only -5.6% off its 52-week and all-time high. Relative Strength Rating has slumped to 77, below the 80+ minimum guideline for buy candidates. A rebound above its 50 DMA line ($116.74) is needed for its outlook to improve. Fundamentals remain strong.
>>> FEATURED STOCK ARTICLE : Near 50-Day Moving Average Line, Yet Not Far Off High - 8/7/2017 |
View all notes |
Set NEW NOTE alert |
Company Profile |
SEC
News |
Chart |
Request a new note
C
A
S
I |
STMP
-
NASDAQ
Stamps.com Inc
INTERNET - Internet Software and Services
|
$209.55
|
+1.75
0.84% |
$210.30
|
167,886
34.69% of 50 DAV
50 DAV is 484,000
|
$220.25
-4.86%
|
5/24/2017
|
$133.10
|
PP = $136.10
|
|
MB = $142.91
|
Most Recent Note - 8/17/2017 11:21:15 AM
G - Still stubbornly holding ground near its all-time high, extended from any sound base. Its 50 DMA line ($161) and prior highs define important near-term support in the $156 area. Fundamentals remain strong.
>>> FEATURED STOCK ARTICLE : Blasted Higher After Latest Strong Earnings Report - 8/11/2017 |
View all notes |
Set NEW NOTE alert |
Company Profile |
SEC
News |
Chart |
Request a new note
C
A
S
I |
Symbol/Exchange
Company Name
Industry Group |
PRICE |
CHANGE
(%Change) |
Day High |
Volume
(% DAV)
(% 50 day avg vol) |
52 Wk Hi
% From Hi |
Featured
Date |
Price
Featured |
Pivot Featured |
|
Max Buy |
HTHT
-
NASDAQ
China Lodging Group Ads
LEISURE - Lodging
|
$114.95
|
+2.01
1.78% |
$118.00
|
584,545
202.26% of 50 DAV
50 DAV is 289,000
|
$113.04
1.69%
|
9/29/2016
|
$46.12
|
PP = $47.82
|
|
MB = $50.21
|
 Most Recent Note - 8/22/2017 12:17:10 PM
G - Hit yet another new all-time high with today's gain, getting very extended from any sound base. Last week it reported earnings +19% on +18% sales revenues for the Jun '17 quarter, below the +25% minimum earnings guideline (C criteria). Its 50 DMA line coincides with prior highs in the $88 area defining very important near-term support.
>>> FEATURED STOCK ARTICLE : Extended From Sound Base With Earnings News Due Next Week - 8/9/2017 |
View all notes |
Set NEW NOTE alert |
Company Profile |
SEC
News |
Chart |
Request a new note
C
A
S
I |
LMAT
-
NASDAQ
Lemaitre Vascular Inc
Medical-Products
|
$34.06
|
+0.23
0.68% |
$34.10
|
68,874
33.11% of 50 DAV
50 DAV is 208,000
|
$36.09
-5.62%
|
7/28/2017
|
$33.50
|
PP = $33.32
|
|
MB = $34.99
|
Most Recent Note - 8/21/2017 6:10:25 PM
Y - Volume totals have been cooling since its breakout while stubbornly holding its ground above prior highs in the $32-33 area previously noted as initial support to watch. Disciplined investors avoid chasing extended stocks more than +5% above prior highs, and they always limit losses by selling any stock that falls more than -7% from their purchase price.
>>> FEATURED STOCK ARTICLE : Big Volume-Driven Gain Following Strong Earnings News - 7/28/2017 |
View all notes |
Set NEW NOTE alert |
Company Profile |
SEC
News |
Chart |
Request a new note
C
A
S
I |
BEAT
-
NASDAQ
BioTelemetry Inc
Medical-Services
|
$36.35
|
+0.50
1.39% |
$36.55
|
219,273
49.47% of 50 DAV
50 DAV is 443,200
|
$37.50
-3.07%
|
2/14/2017
|
$25.10
|
PP = $24.55
|
|
MB = $25.78
|
Most Recent Note - 8/17/2017 5:53:05 PM
G - Retreating from its all-time high. Fundamental concerns remain. Jun '17 quarterly earnings rose +10% on +10% sales revenues, its 2nd consecutive quarterly comparison below the +25% minimum earnings guideline (C criteria). Its 50 DMA line ($32.88) defines near-term support along with prior lows. See the latest FSU analysis for more details and a new annotated graph.
>>> FEATURED STOCK ARTICLE : Technically Strong Despite Recent Fundamental Concerns - 8/17/2017 |
View all notes |
Set NEW NOTE alert |
Company Profile |
SEC
News |
Chart |
Request a new note
C
A
S
I |
ESNT
-
NYSE
Essent Group Ltd
Finance-MrtgandRel Svc
|
$38.37
|
+0.46
1.21% |
$38.76
|
430,164
75.20% of 50 DAV
50 DAV is 572,000
|
$41.44
-7.41%
|
7/3/2017
|
$38.05
|
PP = $39.60
|
|
MB = $41.58
|
Most Recent Note - 8/21/2017 6:04:00 PM
Y - Completed a new Public Offering on 8/08/17, pulling back after spiking to a new all-time high. Recently finding support near its 50 DMA line ($38). Its 200 DMA line and prior lows define near-term support in the $34-35 area.
>>> FEATURED STOCK ARTICLE : Perched Within Close Striking Distance of a New High - 8/1/2017 |
View all notes |
Set NEW NOTE alert |
Company Profile |
SEC
News |
Chart |
Request a new note
C
A
S
I |
VEEV
-
NYSE
Veeva Systems Inc Cl A
Computer Sftwr-Medical
|
$65.57
|
+2.39
3.78% |
$65.93
|
1,351,476
108.38% of 50 DAV
50 DAV is 1,247,000
|
$68.07
-3.67%
|
7/24/2017
|
$65.91
|
PP = $68.17
|
|
MB = $71.58
|
Most Recent Note - 8/22/2017 6:16:57 PM
Y - Rose from near its 50 DMA line ($62.59) with higher volume behind today's gain challenging its prior highs. Very little resistance remains due to overhead supply up through the $68 level. Volume-driven gains above prior highs are still needed to trigger a new (or add-on) technical buy signal. Due to report Jul '17 earnings after market close on Thursday, August 24, 2017. Volume and volatility often increase near earnings news.
>>> FEATURED STOCK ARTICLE : Slump Below 50-Day Moving Average Line Raises Concerns - 8/2/2017 |
View all notes |
Set NEW NOTE alert |
Company Profile |
SEC
News |
Chart |
Request a new note
C
A
S
I |
Symbol/Exchange
Company Name
Industry Group |
PRICE |
CHANGE
(%Change) |
Day High |
Volume
(% DAV)
(% 50 day avg vol) |
52 Wk Hi
% From Hi |
Featured
Date |
Price
Featured |
Pivot Featured |
|
Max Buy |
ANET
-
NYSE
Arista Networks Inc
TELECOMMUNICATIONS - Communication Equipment
|
$175.25
|
+3.24
1.88% |
$175.99
|
840,375
97.38% of 50 DAV
50 DAV is 863,000
|
$176.50
-0.71%
|
8/4/2017
|
$173.31
|
PP = $163.07
|
|
MB = $171.22
|
Most Recent Note - 8/21/2017 6:00:12 PM
G - Recently wedged above its "max buy" level with small gains lacking great volume conviction and its color code is changed to green. Prior highs in the $162 area define initial support to watch above its 50 DMA line ($157). Fundamentals remain strong.
>>> FEATURED STOCK ARTICLE : Networking Firm Consolidating Above 50-Day Moving Average Line - 7/18/2017 |
View all notes |
Set NEW NOTE alert |
Company Profile |
SEC
News |
Chart |
Request a new note
C
A
S
I |
GRUB
-
NYSE
Grubhub Inc
COMPUTER SOFTWARE and SERVICES - Technical and System Software
|
$54.93
|
+0.57
1.05% |
$54.97
|
1,257,672
61.86% of 50 DAV
50 DAV is 2,033,000
|
$57.26
-4.07%
|
6/21/2017
|
$47.33
|
PP = $46.94
|
|
MB = $49.29
|
Most Recent Note - 8/17/2017 5:57:22 PM
G - Pulling back from its all-time high after getting very extended from any sound base. Prior highs and its 50 DMA line define near-term support in the $47-48 area. Recently reported earnings +13% on +32% sales revenues for the Jun '17 quarter, below the +25% minimum earnings guideline (C criteria) raising fundamental concerns.
>>> FEATURED STOCK ARTICLE : Spiked Into New High Territory Despite Sub Par Earnings News - 8/8/2017 |
View all notes |
Set NEW NOTE alert |
Company Profile |
SEC
News |
Chart |
Request a new note
C
A
S
I |
IBP
-
NYSE
Installed Building Prod
DIVERSIFIED SERVICES - Business/Management Services
|
$56.65
|
-0.15
-0.26% |
$56.90
|
127,752
100.59% of 50 DAV
50 DAV is 127,000
|
$60.00
-5.58%
|
6/13/2017
|
$54.25
|
PP = $55.55
|
|
MB = $58.33
|
Most Recent Note - 8/18/2017 5:36:01 PM
Y - Pulled back below its "max buy" level and its color code is changed to yellow. Prior highs in the $55 area define initial support after a big volume-driven gain on 8/04/17 triggered a technical buy signal. See the latest FSU analysis for more details and a new annotated graph.
>>> FEATURED STOCK ARTICLE : Consolidating Near Prior High Following Breakout - 8/18/2017 |
View all notes |
Set NEW NOTE alert |
Company Profile |
SEC
News |
Chart |
Request a new note
C
A
S
I |
NCOM
-
NASDAQ
National Commerce Corp
BANKING - Regional - Southeast Banks
|
$39.85
|
+0.55
1.40% |
$39.90
|
13,443
44.81% of 50 DAV
50 DAV is 30,000
|
$41.25
-3.39%
|
4/25/2017
|
$38.95
|
PP = $40.09
|
|
MB = $42.09
|
Most Recent Note - 8/17/2017 12:11:58 PM
G - Slumped further below its 50 DMA line ($39.60) and its color code was changed to green. Early weakness undercut the recent low ($38.75 on 7/20/17) raising concerns and triggering a more worrisome technical sell signal. Reported Jun '17 earnings +23% on +45% sales revenues, below the +25% minimum earnings guideline (C criteria), raising fundamental concerns. See the latest FSU analysis for more details and an annotated graph.
>>> FEATURED STOCK ARTICLE : Consolidating Near 50-day Moving Average Line - 8/16/2017 |
View all notes |
Set NEW NOTE alert |
Company Profile |
SEC
News |
Chart |
Request a new note
C
A
S
I |
OLLI
-
NASDAQ
Ollie's Bargain Outlet
Retail-DiscountandVariety
|
$43.50
|
+0.00
0.00% |
$43.85
|
872,882
129.51% of 50 DAV
50 DAV is 674,000
|
$46.08
-5.59%
|
7/17/2017
|
$43.96
|
PP = $44.18
|
|
MB = $46.39
|
Most Recent Note - 8/18/2017 5:37:21 PM
Y - Consolidating above support at its 50 DMA line ($42.91). Confirming gains and a strong close above the pivot point backed by at least +40% above average volume may trigger a new (or add-on) technical buy signal.
>>> FEATURED STOCK ARTICLE : Quietly Consolidating Above 50 Day Moving Average Near High - 8/10/2017 |
View all notes |
Set NEW NOTE alert |
Company Profile |
SEC
News |
Chart |
Request a new note
C
A
S
I |
Symbol/Exchange
Company Name
Industry Group |
PRICE |
CHANGE
(%Change) |
Day High |
Volume
(% DAV)
(% 50 day avg vol) |
52 Wk Hi
% From Hi |
Featured
Date |
Price
Featured |
Pivot Featured |
|
Max Buy |
MOMO
-
NASDAQ
Momo Inc.
INTERNET - Content
|
$36.02
|
-9.06
-20.10% |
$40.46
|
44,501,063
1,020.46% of 50 DAV
50 DAV is 4,360,900
|
$46.69
-22.85%
|
7/25/2017
|
$44.05
|
PP = $46.05
|
|
MB = $48.35
|
Most Recent Note - 8/22/2017 6:13:38 PM
G - Reported earnings +192% on +215% sales revenues for the Jun '17 quarter versus the year ago period. Volume and volatility often increase near earnings news. Violated its 50 DMA line triggering a technical sell signal with a damaging volume-driven loss and its color code is changed to green. Only a prompt rebound above the 50 DMA line woulds help its outlook improve
>>> FEATURED STOCK ARTICLE : Perched Within Striking Distance of Prior High - 7/25/2017 |
View all notes |
Set NEW NOTE alert |
Company Profile |
SEC
News |
Chart |
Request a new note
C
A
S
I |
HLI
-
NYSE
Houlihan Lokey Inc Cl A
Finance-Invest Bnk/Bkrs
|
$35.54
|
-0.17
-0.48% |
$35.89
|
136,960
76.09% of 50 DAV
50 DAV is 180,000
|
$39.68
-10.43%
|
5/10/2017
|
$35.85
|
PP = $35.05
|
|
MB = $36.80
|
Most Recent Note - 8/21/2017 6:06:27 PM
Y - Managed a positive reversal on the prior session, finding support while consolidating near its 50 DMA line ($35.84). Damaging losses below the recent low ($34.41 on 8/18/17) would raise serious concerns and trigger a technical sell signal.
>>> FEATURED STOCK ARTICLE : Extended Leader Encounters Distributional Pressure - 7/27/2017 |
View all notes |
Set NEW NOTE alert |
Company Profile |
SEC
News |
Chart |
Request a new note
C
A
S
I |
|
|
|
THESE ARE NOT BUY RECOMMENDATIONS!
Comments contained in the body of this report are technical
opinions only. The material herein has been obtained
from sources believed to be reliable and accurate, however,
its accuracy and completeness cannot be guaranteed.
This site is not an investment advisor, hence it does
not endorse or recommend any securities or other investments.
Any recommendation contained in this report may not
be suitable for all investors and it is not to be deemed
an offer or solicitation on our part with respect to
the purchase or sale of any securities. All trademarks,
service marks and trade names appearing in this report
are the property of their respective owners, and are
likewise used for identification purposes only.
This report is a service available
only to active Paid Premium Members.
You may opt-out of receiving report notifications
at any time. Questions or comments may be submitted
by writing to Premium Membership Services 665 S.E. 10 Street, Suite 201 Deerfield Beach, FL 33441-5634 or by calling 1-800-965-8307
or 954-785-1121.
|
|
|

