***Last / Change / Volume data in this table is the closing quote data***
Symbol/Exchange
Company Name
Industry Group |
PRICE |
CHANGE
(%Change) |
Day High |
Volume
(% DAV)
(% 50 day avg vol) |
52 Wk Hi
% From Hi |
Featured
Date |
Price
Featured |
Pivot Featured |
|
Max Buy |
OSBC
-
NASDAQ
Old Second Bancorp Inc
BANKING - Regional - Midwest Banks
|
$14.70
|
-0.30
-2.00% |
$15.10
|
71,862
88.07% of 50 DAV
50 DAV is 81,600
|
$15.60
-5.77%
|
5/21/2018
|
$15.50
|
PP = $15.10
|
|
MB = $15.86
|
Most Recent Note - 7/9/2018 5:07:17 PM
Y - Consolidating above its 50 DMA line ($14.87). Its prior low ($14) and 200 DMA line define the next important support level. Stalled after highlighted in yellow on 5/21/18 with pivot point cited based on prior highs plus 10 cents. Fundamentals remain strong. See the latest FSU analysis for more details and a new annotated graph.
>>> FEATURED STOCK ARTICLE : Consolidating Above 50-Day Moving Average - 7/9/2018 |
View all notes |
Set NEW NOTE alert |
Company Profile |
SEC
News |
Chart |
Request a new note
C
A
S
I |
PFBC
-
NASDAQ
Preferred Bank Los Angls
BANKING - Regional - Pacific Banks
|
$66.99
|
-0.65
-0.96% |
$67.87
|
242,461
143.89% of 50 DAV
50 DAV is 168,500
|
$69.48
-3.58%
|
5/18/2018
|
$62.91
|
PP = $67.75
|
|
MB = $71.14
|
Most Recent Note - 7/10/2018 12:53:34 PM
Y - Pulling back after hitting new all-time highs with a spurt of 3 consecutive volume-driven gains. Recent low ($61.14) defines near-term support where more damaging losses would raise serious concerns. Relative Strength Rating is now 76, remaining below the 80+ minimum guideline for buy candidates, however it is only -3.1% off its all-time high.
>>> FEATURED STOCK ARTICLE : Volume-Driven Gains Hit New All-Time High - 7/3/2018 |
View all notes |
Set NEW NOTE alert |
Company Profile |
SEC
News |
Chart |
Request a new note
C
A
S
I |
SIVB
-
NASDAQ
S V B Financial Group
BANKING - Regional - Pacific Banks
|
$300.92
|
-1.00
-0.33% |
$305.45
|
307,979
60.87% of 50 DAV
50 DAV is 506,000
|
$329.65
-8.72%
|
3/12/2018
|
$267.79
|
PP = $263.19
|
|
MB = $276.35
|
Most Recent Note - 7/10/2018 5:25:37 PM
G - Still sputtering and a rebound above the 50 DMA line ($312) is needed for its outlook to improve. Fundamentals are strong. See the latest FSU analysis for more details and a new annotated graph.
>>> FEATURED STOCK ARTICLE : Still Sputtering Below 50-Day Moving Average - 7/10/2018 |
View all notes |
Set NEW NOTE alert |
Company Profile |
SEC
News |
Chart |
Request a new note
C
A
S
I |
UCFC
-
NASDAQ
United Community Finl Cp
BANKING - Savings and Loans
|
$11.19
|
+0.00
0.00% |
$11.29
|
149,758
80.52% of 50 DAV
50 DAV is 186,000
|
$11.59
-3.45%
|
5/30/2018
|
$10.50
|
PP = $10.80
|
|
MB = $11.34
|
Most Recent Note - 7/9/2018 5:08:44 PM
Y - Consolidating above the prior high ($10.70 on 4/19/18) and staying well above its 50 DMA line ($10.72) defining near-term support to watch.
>>> FEATURED STOCK ARTICLE : Small Savings & Loan Perched Near High - 5/30/2018 |
View all notes |
Set NEW NOTE alert |
Company Profile |
SEC
News |
Chart |
Request a new note
C
A
S
I |
EPAM
-
NYSE
Epam Systems Inc
COMPUTER SOFTWARE and SERVICES - Information Technology Service
|
$129.75
|
+0.40
0.31% |
$130.93
|
496,778
106.60% of 50 DAV
50 DAV is 466,000
|
$131.95
-1.67%
|
7/5/2018
|
$123.70
|
PP = $131.85
|
|
MB = $138.44
|
Most Recent Note - 7/5/2018 1:05:28 PM
Y - Color code is changed to yellow with new pivot point cited based on its 5/11/18 high plus 10 cents. Consolidating near its 50 DMA line ($122.55). Subsequent volume-driven gains above the pivot point may trigger a new (or add-on) technical buy signal. Damaging losses below the recent low ($118.34 on 6/25/18) would raise serious concerns.
>>> FEATURED STOCK ARTICLE : Sputtering Below 50-Day Average After Negating Prior Breakout - 6/27/2018 |
View all notes |
Set NEW NOTE alert |
Company Profile |
SEC
News |
Chart |
Request a new note
C
A
S
I |
Symbol/Exchange
Company Name
Industry Group |
PRICE |
CHANGE
(%Change) |
Day High |
Volume
(% DAV)
(% 50 day avg vol) |
52 Wk Hi
% From Hi |
Featured
Date |
Price
Featured |
Pivot Featured |
|
Max Buy |
FLT
-
NYSE
Fleetcor Technologies
DIVERSIFIED SERVICES - Business/Management Services
|
$219.23
|
-0.20
-0.09% |
$219.69
|
473,444
37.28% of 50 DAV
50 DAV is 1,270,000
|
$222.92
-1.66%
|
6/18/2018
|
$219.31
|
PP = $213.84
|
|
MB = $224.53
|
Most Recent Note - 7/5/2018 1:12:19 PM
Y - Volume totals have been cooling while consolidating in a tight range above its 50 DMA line ($206.63). Perched within striking distance of its 52-week high.
>>> FEATURED STOCK ARTICLE : Breakaway Gap With Heavy Volume - 6/18/2018 |
View all notes |
Set NEW NOTE alert |
Company Profile |
SEC
News |
Chart |
Request a new note
C
A
S
I |
MA
-
NYSE
Mastercard Inc Cl A
Finance-CrdtCard/PmtPr
|
$203.84
|
+2.32
1.15% |
$204.15
|
2,715,278
81.52% of 50 DAV
50 DAV is 3,331,000
|
$204.00
-0.08%
|
7/11/2018
|
$203.84
|
PP = $204.10
|
|
MB = $214.31
|
 Most Recent Note - 7/11/2018 6:55:54 PM
Y - Color code is changed to yellow with new pivot point cited based on the 6/07/18 high plus 10 cents. Subsequent gains above the pivot point backed by at least +40% above average volume may trigger a new (or add-on) technical buy signal. Finished at a new all-time high close with today's 5th consecutive gain backed by below average volume. Its 50 DMA line ($195) and recent low ($193.16 on 6/27/18) define important near-term support to watch on pullbacks.
>>> FEATURED STOCK ARTICLE : Extended From Prior Base and Perched at All-Time High - 6/20/2018 |
View all notes |
Set NEW NOTE alert |
Company Profile |
SEC
News |
Chart |
Request a new note
C
A
S
I |
V
-
NYSE
Visa Inc Cl A
Finance-CrdtCard/PmtPr
|
$138.15
|
+1.46
1.07% |
$138.81
|
10,640,169
153.34% of 50 DAV
50 DAV is 6,939,000
|
$137.33
0.60%
|
4/26/2018
|
$126.68
|
PP = $126.98
|
|
MB = $133.33
|
Most Recent Note - 7/9/2018 5:29:11 PM
G - Color code is changed to green after rising back above its "max buy" level. Found support above its 50 DMA line ($131.89) and above prior highs in the $126 area.
>>> FEATURED STOCK ARTICLE : Encountered Distributional Pressure at All-Time High - 6/11/2018 |
View all notes |
Set NEW NOTE alert |
Company Profile |
SEC
News |
Chart |
Request a new note
C
A
S
I |
BRKS
-
NASDAQ
Brooks Automation
ELECTRONICS - Semiconductor Equipment and Mate
|
$32.08
|
-3.28
-9.28% |
$35.07
|
2,106,755
300.54% of 50 DAV
50 DAV is 701,000
|
$36.45
-11.99%
|
6/15/2018
|
$35.44
|
PP = $34.87
|
|
MB = $36.61
|
Most Recent Note - 7/11/2018 12:36:54 PM
Y - Pulling back on higher volume today after wedging toward the prior high with gains backed by light volume. Stalled after featured in the 6/15/18 mid-day report, yet found support well above its 50 DMA line ($31.82) during the recent consolidation.
>>> FEATURED STOCK ARTICLE : Volume Was Heavy Behind Big Breakout Gain - 6/15/2018 |
View all notes |
Set NEW NOTE alert |
Company Profile |
SEC
News |
Chart |
Request a new note
C
A
S
I |
ENV
-
NYSE
Envestnet Inc
FINANCIAL SERVICES - Diversified Investments
|
$57.20
|
-0.75
-1.29% |
$58.75
|
343,805
92.42% of 50 DAV
50 DAV is 372,000
|
$60.28
-5.10%
|
6/15/2018
|
$57.85
|
PP = $60.37
|
|
MB = $63.39
|
Most Recent Note - 7/6/2018 6:05:54 PM
Y - Color code is changed to yellow while consolidating above its 50 DMA line ($56.08) and perched within close striking distance of its pivot point. Subsequent volume-driven gains for new highs may trigger a technical buy signal. The recent low ($53.75 on 6/28/18) and 200 DMA line define important near-term support.
>>> FEATURED STOCK ARTICLE : Gain With Above Average Volume Challenged Prior High - 6/19/2018 |
View all notes |
Set NEW NOTE alert |
Company Profile |
SEC
News |
Chart |
Request a new note
C
A
S
I |
Symbol/Exchange
Company Name
Industry Group |
PRICE |
CHANGE
(%Change) |
Day High |
Volume
(% DAV)
(% 50 day avg vol) |
52 Wk Hi
% From Hi |
Featured
Date |
Price
Featured |
Pivot Featured |
|
Max Buy |
TPL
-
NYSE
Texas Pacific Land Trust
Real Estate Dvlpmt/Ops
|
$784.00
|
+32.50
4.32% |
$784.77
|
32,088
160.44% of 50 DAV
50 DAV is 20,000
|
$752.49
4.19%
|
7/5/2018
|
$714.90
|
PP = $739.99
|
|
MB = $776.99
|
Most Recent Note - 7/11/2018 1:05:46 PM
Y - Hitting yet another new all-time high with today's 5th consecutive gain. Gain on the prior session was backed by +39% above average volume as it closed above the new pivot point based on its 6/04/18 high plus 10 cents. Its 50 DMA line ($685) and prior lows define important near-term support to watch on pullbacks.
>>> FEATURED STOCK ARTICLE : Negative Reversal on Higher Volume After Hitting New All-Time High - 6/4/2018 |
View all notes |
Set NEW NOTE alert |
Company Profile |
SEC
News |
Chart |
Request a new note
C
A
S
I |
STMP
-
NASDAQ
Stamps.com Inc
Retail-Internet
|
$269.90
|
-0.45
-0.17% |
$273.55
|
168,499
55.25% of 50 DAV
50 DAV is 305,000
|
$285.75
-5.55%
|
5/4/2018
|
$234.15
|
PP = $233.23
|
|
MB = $244.89
|
Most Recent Note - 7/5/2018 1:59:01 PM
G - Has not formed a sound base, yet it found support at its 50 DMA line ($251). Below that important short-term average prior highs in the $233 area define support to watch on pullbacks.
>>> FEATURED STOCK ARTICLE : Big Loss on Heavy Volume Tests 50-Day Moving Average - 6/21/2018 |
View all notes |
Set NEW NOTE alert |
Company Profile |
SEC
News |
Chart |
Request a new note
C
A
S
I |
CHDN
-
NASDAQ
Churchill Downs Inc
LEISURE - Gaming Activities
|
$299.65
|
+0.80
0.27% |
$301.70
|
54,352
56.03% of 50 DAV
50 DAV is 97,000
|
$314.60
-4.75%
|
6/20/2018
|
$285.80
|
PP = $314.70
|
|
MB = $330.44
|
Most Recent Note - 7/9/2018 5:15:52 PM
Y - Still quietly consolidating above its 50 DMA line ($295.85). The prior high ($285.70 on 4/26/18) defines the next important support. A new pivot point was cited based on its 5/16/18 high plus 10 cents. Subsequent volume-driven gains for a new high are needed to trigger a new (or add-on) technical buy signal.
>>> FEATURED STOCK ARTICLE : Consolidating Near 50-Day Moving Average - 6/29/2018 |
View all notes |
Set NEW NOTE alert |
Company Profile |
SEC
News |
Chart |
Request a new note
C
A
S
I |
HTHT
-
NASDAQ
Huazhu Group Ads
LEISURE - Lodging
|
$40.82
|
-0.50
-1.21% |
$41.27
|
954,541
40.83% of 50 DAV
50 DAV is 2,338,000
|
$49.60
-17.70%
|
5/15/2018
|
$34.52
|
PP = $41.57
|
|
MB = $43.65
|
Most Recent Note - 7/9/2018 5:21:48 PM
G - Rebounded near its 50 DMA line ($42.74) after testing prior highs in the $40-41 area. Recently changed its name from China Lodging Group, Ltd to Huazhu Group Ltd.
>>> FEATURED STOCK ARTICLE : At Prior High and Slumping Below 50-Day Average After 4:1 Split - 7/2/2018 |
View all notes |
Set NEW NOTE alert |
Company Profile |
SEC
News |
Chart |
Request a new note
C
A
S
I |
NFLX
-
NASDAQ
Netflix Inc
SPECIALTY RETAIL - Music and Video Stores
|
$418.65
|
+3.02
0.73% |
$419.77
|
9,639,928
108.77% of 50 DAV
50 DAV is 8,863,000
|
$423.21
-1.08%
|
5/24/2018
|
$348.85
|
PP = $338.92
|
|
MB = $355.87
|
Most Recent Note - 7/11/2018 12:55:26 PM
G - Perched near its all-time high, extended from any sound base. Its 50 DMA line ($364) defines near-term support to watch above the prior high ($338.82 on 4/18/18).
>>> FEATURED STOCK ARTICLE : Rally From Advanced Ascending Base With Volume +50% - 5/24/2018 |
View all notes |
Set NEW NOTE alert |
Company Profile |
SEC
News |
Chart |
Request a new note
C
A
S
I |
Symbol/Exchange
Company Name
Industry Group |
PRICE |
CHANGE
(%Change) |
Day High |
Volume
(% DAV)
(% 50 day avg vol) |
52 Wk Hi
% From Hi |
Featured
Date |
Price
Featured |
Pivot Featured |
|
Max Buy |
DPZ
-
NYSE
Dominos Pizza Inc
Retail-Restaurants
|
$279.66
|
+7.27
2.67% |
$280.73
|
781,057
138.98% of 50 DAV
50 DAV is 562,000
|
$293.81
-4.82%
|
5/21/2018
|
$248.13
|
PP = $255.10
|
|
MB = $267.86
|
Most Recent Note - 7/9/2018 5:23:39 PM
G - Has a new CEO effective 7/02/18. Very extended from the latest base. Its 50 DMA line ($263) and prior high ($255 on 4/26/18) define near-term support to watch.
>>> FEATURED STOCK ARTICLE : New High With Gain Backed by Above Average Volume - 6/5/2018 |
View all notes |
Set NEW NOTE alert |
Company Profile |
SEC
News |
Chart |
Request a new note
C
A
S
I |
FIVE
-
NASDAQ
Five Below Inc
Retail-DiscountandVariety
|
$99.55
|
-1.46
-1.45% |
$99.99
|
657,695
47.49% of 50 DAV
50 DAV is 1,385,000
|
$103.99
-4.27%
|
7/6/2018
|
$98.90
|
PP = $104.09
|
|
MB = $109.29
|
Most Recent Note - 7/6/2018 6:11:56 PM
Y - Color code is changed to yellow after a tight consolidation with new pivot point cited base on its 6/13/18 high plus 10 cents. Volume totals have still been cooling. Subsequent volume-driven gains for new highs may trigger a new (or add-on) technical buy signal. Reported earnings +133% on +27% sales revenues for the Apr '18 quarter.
>>> FEATURED STOCK ARTICLE : Hovering Near Record High After Big Gap Up and Volume-Driven Gain - 6/25/2018 |
View all notes |
Set NEW NOTE alert |
Company Profile |
SEC
News |
Chart |
Request a new note
C
A
S
I |
NOW
-
NYSE
Servicenow Inc
Computer Sftwr-Enterprse
|
$187.18
|
+1.58
0.85% |
$188.18
|
1,370,636
82.87% of 50 DAV
50 DAV is 1,654,000
|
$188.59
-0.75%
|
5/8/2018
|
$174.63
|
PP = $176.66
|
|
MB = $185.49
|
Most Recent Note - 7/9/2018 5:27:44 PM
Y - Rebounded near the "max buy" level and prior highs with a spurt of gains lacking volume conviction. The recent low ($167) defines important near-term support.
>>> FEATURED STOCK ARTICLE : Recent Slump Below 50-Day Average Hurt Outlook - 6/26/2018 |
View all notes |
Set NEW NOTE alert |
Company Profile |
SEC
News |
Chart |
Request a new note
C
A
S
I |
NVEE
-
NASDAQ
N V 5 Global Inc
Comml Svcs-Consulting
|
$73.00
|
+0.15
0.21% |
$73.20
|
38,941
55.63% of 50 DAV
50 DAV is 70,000
|
$74.53
-2.05%
|
6/15/2018
|
$7,070.00
|
PP = $72.00
|
|
MB = $75.60
|
Most Recent Note - 7/5/2018 2:02:08 PM
Y - Quietly matched its all-time high with today's gain. Confirming gains above the pivot point backed by at least +40% above average volume may trigger a technical buy signal. Its 50 DMA line ($63.71) defines near-term support above the prior low ($56.65 on 5/15/18).
>>> FEATURED STOCK ARTICLE : Holding its Ground in Tight Range Near All-Time High - 6/28/2018 |
View all notes |
Set NEW NOTE alert |
Company Profile |
SEC
News |
Chart |
Request a new note
C
A
S
I |
PANW
-
NYSE
Palo Alto Networks
Computer Sftwr-Security
|
$212.79
|
+2.09
0.99% |
$213.81
|
1,266,553
92.92% of 50 DAV
50 DAV is 1,363,000
|
$217.40
-2.12%
|
6/12/2018
|
$206.55
|
PP = $214.69
|
|
MB = $225.42
|
Most Recent Note - 7/10/2018 12:48:42 PM
Y - Stalled soon after featured in the 6/12/18 mid-day report and it has been consolidating above its 50 DMA line ($205.19). The prior low ($195.78 on 6/07/18) defines the next important support level.
>>> FEATURED STOCK ARTICLE : New High Close After 2 Consecutive Volume Driven Gains - 6/13/2018 |
View all notes |
Set NEW NOTE alert |
Company Profile |
SEC
News |
Chart |
Request a new note
C
A
S
I |
Symbol/Exchange
Company Name
Industry Group |
PRICE |
CHANGE
(%Change) |
Day High |
Volume
(% DAV)
(% 50 day avg vol) |
52 Wk Hi
% From Hi |
Featured
Date |
Price
Featured |
Pivot Featured |
|
Max Buy |
QLYS
-
NASDAQ
Qualys Inc
Computer Sftwr-Security
|
$90.60
|
+1.50
1.68% |
$91.20
|
193,902
55.88% of 50 DAV
50 DAV is 347,000
|
$97.75
-7.31%
|
4/17/2018
|
$82.85
|
PP = $79.50
|
|
MB = $83.48
|
Most Recent Note - 7/5/2018 1:51:20 PM
G - Quietly consolidating above the prior high ($85.00 on 4/18/18) which defines initial support above its 50 DMA line ($81.63).
>>> FEATURED STOCK ARTICLE : Rebounded Above 50-Day Average Yet Still Faces Overhead Supply - 5/29/2018 |
View all notes |
Set NEW NOTE alert |
Company Profile |
SEC
News |
Chart |
Request a new note
C
A
S
I |
SPLK
-
NASDAQ
Splunk Inc
Computer Sftwr-Database
|
$102.08
|
+1.88
1.88% |
$102.36
|
1,752,183
94.05% of 50 DAV
50 DAV is 1,863,000
|
$121.64
-16.08%
|
5/8/2018
|
$113.14
|
PP = $112.76
|
|
MB = $118.40
|
Most Recent Note - 7/9/2018 5:13:28 PM
G - Still quietly consolidating above prior lows in the $96-97 area which define near-term support above its 200 DMA line ($91.88). A rebound above the 50 DMA line (110.43) still is needed for its outlook to improve.
>>> FEATURED STOCK ARTICLE : Consolidating Near High Following Latest Financial Report - 5/31/2018 |
View all notes |
Set NEW NOTE alert |
Company Profile |
SEC
News |
Chart |
Request a new note
C
A
S
I |
SUPN
-
NASDAQ
Supernus Pharmaceuticals
Medical-Biomed/Biotech
|
$52.95
|
+0.25
0.47% |
$54.25
|
495,132
57.84% of 50 DAV
50 DAV is 856,000
|
$61.25
-13.55%
|
6/20/2018
|
$58.05
|
PP = $59.15
|
|
MB = $62.11
|
Most Recent Note - 7/9/2018 5:40:33 PM
G - Color code is changed to green while sputtering below its 50 DMA line ($54.05). A prompt rebound above the 50 DMA line is needed for its outlook to improve. Concerns were raised after violating the 50 DMA line and the prior low ($53.10 on 6/14/18). Disciplined investors always limit losses by selling any stock that falls more than -7% from their purchase price.
>>> FEATURED STOCK ARTICLE : Extended From Prior Base After Spiking Higher - 6/6/2018 |
View all notes |
Set NEW NOTE alert |
Company Profile |
SEC
News |
Chart |
Request a new note
C
A
S
I |
GRUB
-
NYSE
Grubhub Inc
INTERNET - Content
|
$109.00
|
+0.58
0.53% |
$110.09
|
716,725
41.48% of 50 DAV
50 DAV is 1,728,000
|
$120.07
-9.22%
|
5/30/2018
|
$107.56
|
PP = $105.68
|
|
MB = $110.96
|
Most Recent Note - 7/9/2018 5:20:04 PM
Y - Consolidating above its 50 DMA line ($105.51). Recent lows in the $101 area define the next important near-term support to watch.
>>> FEATURED STOCK ARTICLE : Gain With +25% Above Average Volume for Best Ever Close - 6/12/2018 |
View all notes |
Set NEW NOTE alert |
Company Profile |
SEC
News |
Chart |
Request a new note
C
A
S
I |
HQY
-
NASDAQ
Healthequity Inc
COMPUTER SOFTWARE and SERVICES - Healthcare Information Service
|
$79.75
|
+0.10
0.13% |
$80.16
|
207,348
37.63% of 50 DAV
50 DAV is 551,000
|
$82.04
-2.79%
|
5/2/2018
|
$66.31
|
PP = $68.85
|
|
MB = $72.29
|
Most Recent Note - 7/6/2018 6:13:21 PM
G - Found prompt support near its 50 DMA line ($75.05). More damaging losses would raise greater concerns. It has not formed a sound base.
>>> FEATURED STOCK ARTICLE : Pullback After Volume-Driven Gains For New Highs - 6/7/2018 |
View all notes |
Set NEW NOTE alert |
Company Profile |
SEC
News |
Chart |
Request a new note
C
A
S
I |
Symbol/Exchange
Company Name
Industry Group |
PRICE |
CHANGE
(%Change) |
Day High |
Volume
(% DAV)
(% 50 day avg vol) |
52 Wk Hi
% From Hi |
Featured
Date |
Price
Featured |
Pivot Featured |
|
Max Buy |
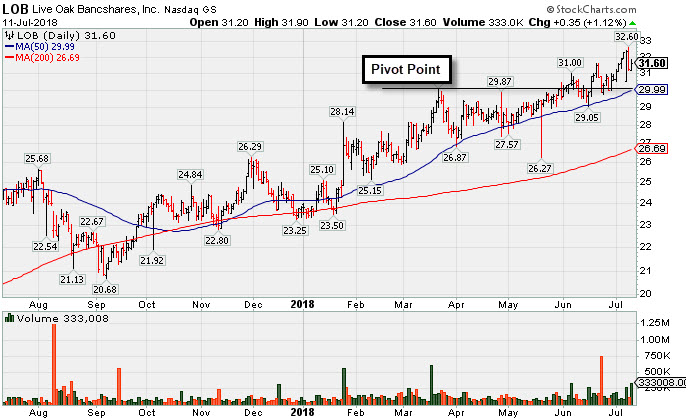
LOB
-
NASDAQ
Live Oak Bancshares Inc
Banks-Southeast
|
$31.60
|
+0.35
1.12% |
$31.90
|
333,008
254.20% of 50 DAV
50 DAV is 131,000
|
$32.60
-3.07%
|
5/21/2018
|
$29.35
|
PP = $30.15
|
|
MB = $31.66
|
Most Recent Note - 7/11/2018 6:46:37 PM
G - Consolidating near its "max buy" level after a streak of 7 consecutive gains. Near term support to watch is at its 50 DMA line ($30). See the latest FSU analysis for more details and a new annotated graph.
>>> FEATURED STOCK ARTICLE : Bank Making Gradual Progress After Support Found at 50-Day Average - 7/11/2018 |
View all notes |
Set NEW NOTE alert |
Company Profile |
SEC
News |
Chart |
Request a new note
C
A
S
I |
PYPL
-
NASDAQ
Paypal Holdings Inc
Finance-CrdtCard/PmtPr
|
$86.25
|
+0.08
0.09% |
$86.86
|
4,143,897
53.31% of 50 DAV
50 DAV is 7,773,000
|
$87.55
-1.48%
|
5/18/2018
|
$81.63
|
PP = $80.89
|
|
MB = $84.93
|
Most Recent Note - 7/6/2018 6:21:44 PM
Y - Finished near its all-time high with today's gain backed by light volume. Found support at its 50 DMA line ($81.11). Disciplined investors will note that since featured on 5/18/18 it has not posted confirming gains above the pivot point backed by at least +40% above average volume to confirm a proper technical buy signal.
>>> FEATURED STOCK ARTICLE : Gains Have Lacked Volume While Approaching All-Time High - 6/8/2018 |
View all notes |
Set NEW NOTE alert |
Company Profile |
SEC
News |
Chart |
Request a new note
C
A
S
I |
OLLI
-
NASDAQ
Ollie's Bargain Outlet
Retail-DiscountandVariety
|
$74.95
|
-0.25
-0.33% |
$75.75
|
528,538
60.82% of 50 DAV
50 DAV is 869,000
|
$77.50
-3.29%
|
4/10/2018
|
$62.05
|
PP = $62.15
|
|
MB = $65.26
|
Most Recent Note - 7/5/2018 5:25:33 PM
G - Consolidating above its 50 DMA line ($69.98) which defines important near-term support to watch on pullbacks. See the latest FSU analysis for more details and a new annotated graph.
>>> FEATURED STOCK ARTICLE : Found Recent Support at 50-Day Moving Average Line - 7/5/2018 |
View all notes |
Set NEW NOTE alert |
Company Profile |
SEC
News |
Chart |
Request a new note
C
A
S
I |
MOMO
-
NASDAQ
Momo Inc Ads Cl A
INTERNET - Content
|
$44.00
|
-1.20
-2.65% |
$44.95
|
3,873,056
78.42% of 50 DAV
50 DAV is 4,939,000
|
$54.24
-18.88%
|
6/1/2018
|
$48.62
|
PP = $46.79
|
|
MB = $49.13
|
Most Recent Note - 7/10/2018 1:27:22 PM
Y - Consolidating above its 50 DMA line ($44.17) which acted as support after a slump below the old high ($46.69 on 8/08/17) into the prior base raised concerns. Subsequent losses below the recent low ($41.11 on 6/27/18) would raise serious concerns and trigger a worrisome technical sell signal.
>>> FEATURED STOCK ARTICLE : Volume-Driven Gain for New All-Time High - 6/1/2018 |
View all notes |
Set NEW NOTE alert |
Company Profile |
SEC
News |
Chart |
Request a new note
C
A
S
I |
NOVT
-
NASDAQ
Novanta Inc
Elec-Scientific/Msrng
|
$65.60
|
-0.45
-0.68% |
$66.25
|
107,978
53.45% of 50 DAV
50 DAV is 202,000
|
$68.00
-3.53%
|
4/17/2018
|
$60.55
|
PP = $60.40
|
|
MB = $63.42
|
Most Recent Note - 7/9/2018 5:25:58 PM
G - Color code is changed to green as it rebounds near the prior high with today's 7th consecutive gain. The recent low ($59.25) defines important near-term support.
>>> FEATURED STOCK ARTICLE : Quietly Hovering Near All-Time High - 5/25/2018 |
View all notes |
Set NEW NOTE alert |
Company Profile |
SEC
News |
Chart |
Request a new note
C
A
S
I |
Symbol/Exchange
Company Name
Industry Group |
PRICE |
CHANGE
(%Change) |
Day High |
Volume
(% DAV)
(% 50 day avg vol) |
52 Wk Hi
% From Hi |
Featured
Date |
Price
Featured |
Pivot Featured |
|
Max Buy |
BZUN
-
NASDAQ
Baozun Inc Cl A Ads
Computer Sftwr-Enterprse
|
$57.61
|
-0.28
-0.48% |
$58.77
|
1,129,242
44.20% of 50 DAV
50 DAV is 2,555,000
|
$67.41
-14.54%
|
5/15/2018
|
$45.38
|
PP = $52.43
|
|
MB = $55.05
|
Most Recent Note - 7/9/2018 5:10:19 PM
G - Color code is changed to green after rising back above its "max buy" level. Found support near prior highs in the $52 area while consolidating near its 50 DMA line ($55.77). The recent low ($51.50 on 6/27/18) defines important near-term support.
>>> FEATURED STOCK ARTICLE : Found Support Near Prior Highs and 50 Day Moving Average - 7/6/2018 |
View all notes |
Set NEW NOTE alert |
Company Profile |
SEC
News |
Chart |
Request a new note
C
A
S
I |