***Last / Change / Volume data in this table is the closing quote data***
Symbol/Exchange
Company Name
Industry Group |
PRICE |
CHANGE
(%Change) |
Day High |
Volume
(% DAV)
(% 50 day avg vol) |
52 Wk Hi
% From Hi |
Featured
Date |
Price
Featured |
Pivot Featured |
|
Max Buy |
 ABCB
-
NASDAQ
ABCB
-
NASDAQ
Ameris Bancorp
BANKING - Regional - Mid-Atlantic Banks
|
$55.86
|
-0.46
-0.82% |
$56.56
|
323,743
71.94% of 50 DAV
50 DAV is 450,000
|
$59.85
-6.67%
|
5/21/2021
|
$58.86
|
PP = $57.91
|
|
MB = $60.81
|
Most Recent Note - 5/28/2021 5:36:22 PM
Y - Abruptly reversed from its high this week and slumped back into the prior base raising concerns. Found support at its 50 DMA line ($53.59). More damaging losses would raise greater concerns and trigger a worrisome technical sell signal.
>>> FEATURED STOCK ARTICLE : Breakout to New All-Time High for Another Regional Bank - 5/21/2021 |
View all notes |
Set NEW NOTE alert |
Company Profile |
SEC
News |
Chart |
Request a new note
C
A
S
I |
SIVB
-
NASDAQ
S V B Financial Group
BANKING - Regional - Pacific Banks
|
$587.94
|
-2.13
-0.36% |
$591.86
|
265,262
52.95% of 50 DAV
50 DAV is 501,000
|
$596.82
-1.49%
|
4/23/2021
|
$579.70
|
PP = $577.16
|
|
MB = $606.02
|
Most Recent Note - 6/1/2021 5:36:08 PM
Y - Touched a new all-time high with today's gain backed by light volume. Confirming volume-driven gains are still needed to help clinch a convincing technical buy signal. Its 50 DMA line ($539) defines near-term support to watch. Reported earnings +293% on +64% sales revenues for the Mar '21 quarter versus the year ago period, its 3rd strong comparison. Completed a new Public Offering on 3/24/21.
>>> FEATURED STOCK ARTICLE : Sputtering Since Featured Without Confirming Gains - 5/20/2021 |
View all notes |
Set NEW NOTE alert |
Company Profile |
SEC
News |
Chart |
Request a new note
C
A
S
I |
LOGI
-
NASDAQ
Logitech Intl Sa
COMPUTER HARDWARE - Computer Peripherals
|
$131.28
|
+3.70
2.90% |
$132.11
|
1,260,553
163.71% of 50 DAV
50 DAV is 770,000
|
$128.15
2.44%
|
5/26/2021
|
$119.13
|
PP = $120.34
|
|
MB = $126.36
|
 Most Recent Note - 6/2/2021 12:18:27 PM
G - Hitting yet another new all-time high with today's 7th consecutive gain, getting extended from the previously noted base. Prior highs in the $120-117 area define initial support to watch on pullbacks.
>>> FEATURED STOCK ARTICLE : Streak of Gains to New Highs Lacked Great Volume Conviction - 5/27/2021 |
View all notes |
Set NEW NOTE alert |
Company Profile |
SEC
News |
Chart |
Request a new note
C
A
S
I |
CROX
-
NASDAQ
Crocs Inc
CONSUMER NON-DURABLES - Textile - Apparel Footwear
|
$100.02
|
-3.11
-3.02% |
$104.79
|
2,309,529
136.74% of 50 DAV
50 DAV is 1,689,000
|
$109.91
-9.00%
|
4/27/2021
|
$99.81
|
PP = $86.50
|
|
MB = $90.83
|
Most Recent Note - 6/2/2021 5:27:59 PM
G - Suffered a loss today with +37% above average volume and closed at the session low. Its 50 DMA line ($91.14) defines initial support above prior highs in the $86 area.
>>> FEATURED STOCK ARTICLE : Encountered Distributional Pressure Late This Week - 5/28/2021 |
View all notes |
Set NEW NOTE alert |
Company Profile |
SEC
News |
Chart |
Request a new note
C
A
S
I |
RCKY
-
NASDAQ
Rocky Brands Inc
CONSUMER NON-DURABLES - Textile - Apparel Footwear
|
$54.84
|
-3.74
-6.38% |
$59.09
|
98,536
99.53% of 50 DAV
50 DAV is 99,000
|
$69.00
-20.52%
|
5/5/2021
|
$61.65
|
PP = $61.55
|
|
MB = $64.63
|
Most Recent Note - 6/2/2021 5:23:00 PM
G - Suffered a big loss today with average volume and violated its 50 DMA line ($55.87) raising concerns. Prior low ($50.52 on 5/19/21) defines the next important support where any violation may trigger a more worrisome technical sell signal. Fundamentals remain strong.
>>> FEATURED STOCK ARTICLE : Rocky Brands Powered Higher After Strong Earnings - 5/5/2021 |
View all notes |
Set NEW NOTE alert |
Company Profile |
SEC
News |
Chart |
Request a new note
C
A
S
I |
Symbol/Exchange
Company Name
Industry Group |
PRICE |
CHANGE
(%Change) |
Day High |
Volume
(% DAV)
(% 50 day avg vol) |
52 Wk Hi
% From Hi |
Featured
Date |
Price
Featured |
Pivot Featured |
|
Max Buy |
CRL
-
NYSE
Charles River Labs Intl
DRUGS - Biotechnology
|
$329.52
|
-3.38
-1.02% |
$333.21
|
469,039
69.18% of 50 DAV
50 DAV is 678,000
|
$349.13
-5.62%
|
12/17/2020
|
$247.06
|
PP = $257.98
|
|
MB = $270.88
|
Most Recent Note - 6/1/2021 5:47:29 PM
G - Pulled back today with near average volume, consolidating above its 50 DMA line ($317) which defines initial support above the prior high ($303). Reported Mar '21 quarterly earnings +38% on +17%v sales revenues versus the year ago period. Two of the past 3 quarterly comparisons have been above the +25% minimum earnings guideline (C criteria).
>>> FEATURED STOCK ARTICLE : Pulling Back From Record High Following Strong Quarterly Report - 5/6/2021 |
View all notes |
Set NEW NOTE alert |
Company Profile |
SEC
News |
Chart |
Request a new note
C
A
S
I |
CAMT
-
NASDAQ
Camtek Ltd
ELECTRONICS - Scientific and Technical Instrum
|
$37.77
|
+1.14
3.11% |
$38.14
|
518,134
176.24% of 50 DAV
50 DAV is 294,000
|
$36.81
2.61%
|
4/28/2021
|
$35.03
|
PP = $35.34
|
|
MB = $37.11
|
Most Recent Note - 6/2/2021 5:39:38 PM
G - Hit a new 52-week high and its color code is changed to green after rising above its "max by" level with today's 5th consecutive gain backed by +76% above average volume. It abruptly rebounded above its 50 DMA line ($31.82) after a deep pullback in recent weeks. See the latest FSU analysis for more details and an annotated graph.
>>> FEATURED STOCK ARTICLE : Perched at 52-Week High After 4th Consecutive Gain - 6/1/2021 |
View all notes |
Set NEW NOTE alert |
Company Profile |
SEC
News |
Chart |
Request a new note
C
A
S
I |
ASML
-
NASDAQ
A S M L Holding N.V. NY
ELECTRONICS - Semiconductor Equipment and Mate
|
$674.09
|
+2.29
0.34% |
$678.73
|
593,551
58.02% of 50 DAV
50 DAV is 1,023,000
|
$688.09
-2.03%
|
5/25/2021
|
$669.59
|
PP = $675.75
|
|
MB = $709.54
|
Most Recent Note - 5/28/2021 5:37:48 PM
Y - Managed a best-ever close with today's gain backed by light volume. Highlighted in yellow with pivot point cited based on its 4/26/21 high plus 10 cents. Subsequent gain and a strong close above its pivot point backed by at least +40% above average volume is needed to trigger a proper technical buy signal. Found support at its 50 DMA line ($634) during a 4-week consolidation. Reported Mar '21 quarterly earnings +264% on +90% sales revenues versus the year-ago period. The 4 latest quarterly comparisons were above the +25% minimum earnings guideline (C criteria). Annual earnings history included a small downturn in FY '19. Dutch Electronics - Semiconductor Equipment firm made an impressive rally from a deep slump in March. See the latest FSU analysis for more details and an annotated graph.
>>> FEATURED STOCK ARTICLE : Perched Near All-Time High After Short Base Above 50-Day Average - 5/26/2021 |
View all notes |
Set NEW NOTE alert |
Company Profile |
SEC
News |
Chart |
Request a new note
C
A
S
I |
BRKS
-
NASDAQ
Brooks Automation
ELECTRONICS - Semiconductor Equipment and Mate
|
$100.48
|
+0.42
0.42% |
$100.81
|
407,178
48.59% of 50 DAV
50 DAV is 838,000
|
$108.72
-7.58%
|
4/5/2021
|
$99.31
|
PP = $91.88
|
|
MB = $96.47
|
Most Recent Note - 5/28/2021 5:39:37 PM
G - Posted a 3rd consecutive gain today with light volume and its color code is changed to green after rising above its "max buy" level. Volume totals have been cooling while consolidating above its 50 DMA line ($94) where it found prompt support. More damaging losses below the recent low ($86.12 on 5/12/21) would raise serious concerns.
>>> FEATURED STOCK ARTICLE : Extended From Base and Consolidating After Recent Rally - 4/30/2021 |
View all notes |
Set NEW NOTE alert |
Company Profile |
SEC
News |
Chart |
Request a new note
C
A
S
I |
OPY
-
NYSE
Oppenheimer Holdings Inc
FINANCIAL SERVICES - Investment Brokerage - Regiona
|
$49.91
|
-1.25
-2.44% |
$51.97
|
80,922
74.93% of 50 DAV
50 DAV is 108,000
|
$52.45
-4.84%
|
2/25/2021
|
$38.95
|
PP = $38.11
|
|
MB = $40.02
|
Most Recent Note - 6/2/2021 5:36:36 PM
G - Perched near its 52-week high, consolidating in an orderly fashion above its 50 DMA line ($46.06). It has not formed a new base of sufficient length. Fundamentals remain strong.
>>> FEATURED STOCK ARTICLE : Extended From Any Sound Base After Decent Rally - 5/17/2021 |
View all notes |
Set NEW NOTE alert |
Company Profile |
SEC
News |
Chart |
Request a new note
C
A
S
I |
Symbol/Exchange
Company Name
Industry Group |
PRICE |
CHANGE
(%Change) |
Day High |
Volume
(% DAV)
(% 50 day avg vol) |
52 Wk Hi
% From Hi |
Featured
Date |
Price
Featured |
Pivot Featured |
|
Max Buy |
MTH
-
NYSE
Meritage Homes Corp
MATERIALS and CONSTRUCTION - Residential Construction
|
$104.91
|
-2.10
-1.96% |
$107.13
|
358,673
90.28% of 50 DAV
50 DAV is 397,300
|
$120.19
-12.71%
|
5/12/2021
|
$108.84
|
PP = $117.16
|
|
MB = $123.02
|
Most Recent Note - 5/27/2021 2:29:43 PM
Y -Volume totals have still been mostly light while consolidating since hitting a new 52-week high on 5/10/21. Subsequent gains above the pivot point with at least +40% above average volume would be a reassuring confirmation of fresh institutional buying demand. Reported earnings +88% on +20% sales revenues for the Mar '21 quarter versus the year ago period, its 7th consecutive strong quarterly comparison above the +25% minimum guideline (C criteria). Annual earnings (A criteria) history has been strong after a downturn in FY '15.
>>> FEATURED STOCK ARTICLE : Homebuilder Pulled Back After Hitting New High - 5/13/2021 |
View all notes |
Set NEW NOTE alert |
Company Profile |
SEC
News |
Chart |
Request a new note
C
A
S
I |
CRMT
-
NASDAQ
Americas Car-Mart Inc
SPECIALTY RETAIL - Auto Dealerships
|
$159.78
|
-4.98
-3.02% |
$164.25
|
65,176
141.69% of 50 DAV
50 DAV is 46,000
|
$177.45
-9.96%
|
5/25/2021
|
$159.80
|
PP = $165.10
|
|
MB = $173.36
|
Most Recent Note - 6/2/2021 5:25:40 PM
Y - Pulled back further today with +41% above average volume, slumping further below the pivot point raising concerns. Prior highs in the $156-158 area define near-term support to watch above its 50 DMA line ($151.12).
>>> FEATURED STOCK ARTICLE : Car Dealership Firm Challenging All-Time High - 5/25/2021 |
View all notes |
Set NEW NOTE alert |
Company Profile |
SEC
News |
Chart |
Request a new note
C
A
S
I |
LAD
-
NYSE
Lithia Motors Inc Cl A
SPECIALTY RETAIL - Auto Dealerships
|
$348.50
|
-8.29
-2.32% |
$359.58
|
515,569
133.91% of 50 DAV
50 DAV is 385,000
|
$417.98
-16.62%
|
4/21/2021
|
$377.00
|
PP = $418.08
|
|
MB = $438.98
|
Most Recent Note - 6/1/2021 5:40:46 PM
G - Completed a new Public Offering on 5/19/21. A rebound above its 50 DMA line ($376.54) is needed for its outlook to improve. It faces resistance due to overhead supply up to the $417 level.
>>> FEATURED STOCK ARTICLE : Gap Down After Proposing New Public Offering - 5/19/2021 |
View all notes |
Set NEW NOTE alert |
Company Profile |
SEC
News |
Chart |
Request a new note
C
A
S
I |
MED
-
NYSE
Medifast Inc
SPECIALTY RETAIL - Specialty Retail, Other
|
$321.81
|
-7.50
-2.28% |
$329.32
|
136,567
115.73% of 50 DAV
50 DAV is 118,000
|
$336.99
-4.50%
|
5/11/2021
|
$285.72
|
PP = $279.56
|
|
MB = $293.54
|
Most Recent Note - 6/2/2021 5:31:41 PM
G - Pulled back today with near average volume. It is very extended from the previously noted base. Prior high in the $279 area defines initial support to watch on pullbacks.
>>> FEATURED STOCK ARTICLE : Held Ground Following Breakout Gain on Prior Session - 5/11/2021 |
View all notes |
Set NEW NOTE alert |
Company Profile |
SEC
News |
Chart |
Request a new note
C
A
S
I |
CLFD
-
NASDAQ
Clearfield Inc
TELECOMMUNICATIONS - Cables / Satalite Equipment
|
$38.09
|
-0.57
-1.47% |
$39.00
|
73,168
59.01% of 50 DAV
50 DAV is 124,000
|
$40.26
-5.39%
|
4/26/2021
|
$39.68
|
PP = $38.85
|
|
MB = $40.79
|
Most Recent Note - 6/1/2021 5:46:29 PM
Y - Posted a gain today rising near its previously cited pivot point. Its 50 DMA line ($33.73) and recent low define important near-term support in the $33 area. Fundamentals remain strong after it reported Mar '21 quarterly earnings +440% on +45% sales revenues versus the year ago period, continuing its strong earnings track record.
>>> FEATURED STOCK ARTICLE : Stalled and Found Support Above 50-Day Moving Average - 5/24/2021 |
View all notes |
Set NEW NOTE alert |
Company Profile |
SEC
News |
Chart |
Request a new note
C
A
S
I |
Symbol/Exchange
Company Name
Industry Group |
PRICE |
CHANGE
(%Change) |
Day High |
Volume
(% DAV)
(% 50 day avg vol) |
52 Wk Hi
% From Hi |
Featured
Date |
Price
Featured |
Pivot Featured |
|
Max Buy |
FSBW
-
NASDAQ
F S Bancorp
Banks-West/Southwest
|
$70.80
|
-0.49
-0.69% |
$71.68
|
10,322
79.40% of 50 DAV
50 DAV is 13,000
|
$73.62
-3.83%
|
5/18/2021
|
$70.16
|
PP = $73.72
|
|
MB = $77.41
|
Most Recent Note - 6/2/2021 5:29:56 PM
Y - This thinly-traded Bank is still perched within striking distance of the pivot point cited based on its 3/08/21 high plus 10 cents. Consolidating above its 50 DMA line ($68.37) where it found prompt support during its ongoing ascent. Subsequent gains above the pivot point backed by at least +40% above average volume are needed to trigger a technical buy signal. Fundamentals remain strong.
>>> FEATURED STOCK ARTICLE : Thinly-Traded Bank Consolidating Above 50-Day Moving Average - 5/18/2021 |
View all notes |
Set NEW NOTE alert |
Company Profile |
SEC
News |
Chart |
Request a new note
C
A
S
I |
SMPL
-
NASDAQ
Simply Good Foods Co
Food-Confectionery
|
$34.54
|
+0.08
0.23% |
$34.95
|
321,570
56.92% of 50 DAV
50 DAV is 565,000
|
$35.48
-2.65%
|
12/28/2020
|
$30.40
|
PP = $31.44
|
|
MB = $33.01
|
Most Recent Note - 5/28/2021 5:30:31 PM
G - Quietly touched a new all-time high on the prior session but reversed and ended near the session low. Found prompt support near its 50 DMA line ($32.92). Reported Feb '21 quarterly earnings +9% on +2% sales revenues versus the year ago period, below the +25% minimum earnings guideline (C criteria), raising fundamental concerns. Its current Relative Strength Rating has improved to 84, above the 80+ minimum guideline for buy candidates.
>>> FEATURED STOCK ARTICLE : Hovering Near All-Time High Following Lackluster Quarter - 5/10/2021 |
View all notes |
Set NEW NOTE alert |
Company Profile |
SEC
News |
Chart |
Request a new note
C
A
S
I |
QRVO
-
NASDAQ
"Qorvo, Inc"
ELECTRONICS - Semiconductor - Integrated Cir
|
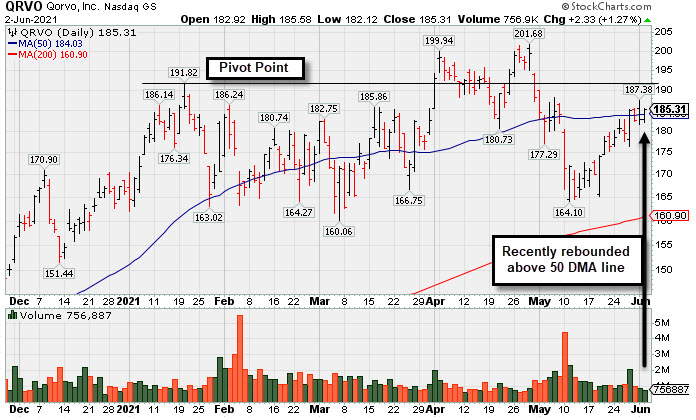
$185.31
|
+2.33
1.27% |
$185.58
|
720,931
62.46% of 50 DAV
50 DAV is 1,154,200
|
$201.68
-8.12%
|
4/1/2021
|
$190.48
|
PP = $191.92
|
|
MB = $201.52
|
Most Recent Note - 5/27/2021 2:34:07 PM
G - Today's gain with light volume is challenging its 50 DMA line ($183.78) which may act as resistance. A rebound above the 50 DMA line is needed for its outlook to improve. Its Relative Strength Rating is 70, below the 80+ minimum for buy candidates. Stalled after recently wedging up to new highs from a 9-week base.
>>> FEATURED STOCK ARTICLE : Rebound Above 50-Day Moving Average Helped Outlook - 6/2/2021 |
View all notes |
Set NEW NOTE alert |
Company Profile |
SEC
News |
Chart |
Request a new note
C
A
S
I |
YETI
-
NYSE
Yeti Holdings Inc
Leisure-Products
|
$87.30
|
-0.70
-0.80% |
$87.84
|
805,818
57.23% of 50 DAV
50 DAV is 1,408,000
|
$91.55
-4.64%
|
5/13/2021
|
$84.20
|
PP = $90.65
|
|
MB = $95.18
|
Most Recent Note - 5/28/2021 5:32:42 PM
Y - Hovering near its all-time high with volume totals cooling. Near term support to watch is at its 50 DMA line ($82.39) and prior highs in the $80 area. Reported Mar 21 quarterly earnings +245% on +42% sales revenues versus the year ago period, continuing its strong earnings track record. Previously noted that a valid secondary buy point exists from its 10 WMA line up to 5% above the latest high.
>>> FEATURED STOCK ARTICLE : Hovering Near Record High Following Volume-Driven Gains - 5/3/2021 |
View all notes |
Set NEW NOTE alert |
Company Profile |
SEC
News |
Chart |
Request a new note
C
A
S
I |
MRBK
-
NASDAQ
Meridian Corp
Banks-Northeast
|
$26.91
|
+0.17
0.64% |
$27.27
|
16,099
55.51% of 50 DAV
50 DAV is 29,000
|
$29.18
-7.78%
|
5/18/2021
|
$25.58
|
PP = $28.06
|
|
MB = $29.46
|
Most Recent Note - 5/27/2021 2:28:24 PM
Y - Tested support at its 50 DMA line this week ($26.02) after stalling since reaching a new 52-week high when featured on 5/18/21. Reported Mar '21 earnings +323% on +93% sales revenues versus the year ago period, continuing its strong earnings track record. Recent low ($24.01 on 4/21/21) defines important near-term support where any violation may trigger a worrisome technical sell signal. Its Relative Strength Rating is 80, right at the 80 minimum guideline.
>>> FEATURED STOCK ARTICLE : Bank Consolidating Near 50 Day Moving Average Line - 5/7/2021 |
View all notes |
Set NEW NOTE alert |
Company Profile |
SEC
News |
Chart |
Request a new note
C
A
S
I |
Symbol/Exchange
Company Name
Industry Group |
PRICE |
CHANGE
(%Change) |
Day High |
Volume
(% DAV)
(% 50 day avg vol) |
52 Wk Hi
% From Hi |
Featured
Date |
Price
Featured |
Pivot Featured |
|
Max Buy |
CLAR
-
NASDAQ
Clarus Corporation
Leisure-Products
|
$24.43
|
-0.68
-2.71% |
$25.88
|
230,256
135.44% of 50 DAV
50 DAV is 170,000
|
$25.21
-3.09%
|
5/12/2021
|
$21.40
|
PP = $19.73
|
|
MB = $20.72
|
Most Recent Note - 6/1/2021 5:38:57 PM
G - Posted a big gain today with higher volume as it hit another new 52-week high, getting very extended from the previously noted base. Prior high ($19.63 on 3/09/21) defines initial support to watch above its 50 DMA line ($19.16).
>>> FEATURED STOCK ARTICLE : 4 Volume-Driven Gains Into New High Territory - 5/12/2021 |
View all notes |
Set NEW NOTE alert |
Company Profile |
SEC
News |
Chart |
Request a new note
C
A
S
I |