You are not logged in.
This means you
CAN ONLY VIEW reports that were published prior to Wednesday, April 16, 2025.
You
MUST UPGRADE YOUR MEMBERSHIP if you want to see any current reports.
AFTER MARKET UPDATE - TUESDAY, MARCH 2ND, 2021
Previous After Market Report Next After Market Report >>>
|
|
|
|
DOW |
-143.99 |
31,391.52 |
-0.46% |
|
Volume |
1,199,654,789 |
+11% |
|
Volume |
4,886,701,600 |
-3% |
|
NASDAQ |
-230.04 |
13,358.79 |
-1.69% |
|
Advancers |
1,359 |
42% |
|
Advancers |
1,129 |
28% |
|
S&P 500 |
-31.53 |
3,870.29 |
-0.81% |
|
Decliners |
1,839 |
57% |
|
Decliners |
2,852 |
72% |
|
Russell 2000 |
-43.81 |
2,231.51 |
-1.93% |
|
52 Wk Highs |
151 |
|
|
52 Wk Highs |
181 |
|
|
S&P 600 |
-22.90 |
1,294.68 |
-1.74% |
|
52 Wk Lows |
89 |
|
|
52 Wk Lows |
154 |
|
|
 |
Breadth Negative as Major Indices Slump
Kenneth J. Gruneisen - Passed the CAN SLIM® Master's Exam
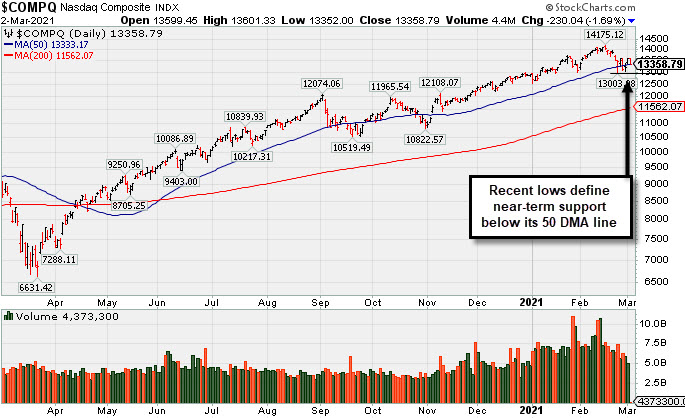
The Dow shed 143 points, while the S&P 500 lost 0.8% following its best one-day performance since June 5 (+2.4% on Monday). The Nasdaq Composite slumped 1.7% amid weakness in Tech and other growth-oriented stocks. The volume totals were mixed, higher than the prior session on the NYSE and lighter on the Nasdaq exchange. Breadth was negative as decliners led advancer by about a 3-2 margin on the NYSE and by 7-3 on the Nasdaq exchange. There were 49 high-ranked companies from the Leaders List that hit new 52-week highs and were listed on the BreakOuts Page, versus the total of 78 on the prior session. New 52-week highs totals contracted but outnumbered growing new 52-week lows totals on both exchanges. The major indices' uptrend (M criteria) has recently come under pressure. It remains very important for healthy leadership to continue, for any rally can only be sustained if it is supported by many stocks hitting new highs. Investors are reminded to always make buying and selling decisions based based on the strict criteria and rules of the fact-based investment system. PICTURED: The Nasdaq Composite Index's recent lows define near-term support below its 50-day moving average (DMA) line.
U.S. stocks ended lower on Tuesday, as Wall Street once again assessed equity valuations on the heels of Monday's rally. Earlier today, China's top banking official expressed concern surrounding the risks from possible asset bubbles.
Market participants also paid close attention to remarks from Federal Reserve members. Notably, Fed Governor Lael Brainard acknowledged that last week’s moves in the bond market caught her attention. She also reiterated that the bank would remain patient on monetary policy as it would take “some time” before the Fed’s employment and inflation goals were met. Treasuries were mixed, with the yield on the 10-year note down three basis points to 1.40%. In commodities, WTI crude dipped 1.7% to $59.60/barrel ahead of this week's OPEC+ meeting.
Ten of 11 S&P 500 sectors finished in negative territory, with Materials the lone advancer. The Information Technology, Consumer Discretionary, and Communication Services groups underperformed, with the oft-cited FAANG group slipping 1.2%. In earnings, Zoom Video Communications (ZM -9.00%) reversed early session gains, falling sharply despite offering strong revenue projections. Meanwhile, Target (TGT -6.83%) fell as the retailer failed to provide forward guidance following a robust profit tally. Elsewhere, drugmaker Novavax (NVAX -14.27%) fell after posting a bigger-than-forecasted quarterly loss. In other corporate news, Nielsen Holdings (NLSN +7.56%) rose after announcing the sale of its Advanced Video Advertising business unit and a strategic data-sharing partnership with streaming platform Roku (ROKU -7.29%). |
 Kenneth J. Gruneisen started out as a licensed stockbroker in August 1987, a couple of months prior to the historic stock market crash that took the Dow Jones Industrial Average down -22.6% in a single day. He has published daily fact-based fundamental and technical analysis on high-ranked stocks online for two decades. Through FACTBASEDINVESTING.COM, Kenneth provides educational articles, news, market commentary, and other information regarding proven investment systems that work in good times and bad.
Comments contained in the body of this report are technical opinions only and are not necessarily those of Gruneisen Growth Corp. The material herein has been obtained from sources believed to be reliable and accurate, however, its accuracy and completeness cannot be guaranteed. Our firm, employees, and customers may effect transactions, including transactions contrary to any recommendation herein, or have positions in the securities mentioned herein or options with respect thereto. Any recommendation contained in this report may not be suitable for all investors and it is not to be deemed an offer or solicitation on our part with respect to the purchase or sale of any securities. |
|
 |
Retail, Financial, Tech, and Energy-Linked Groups Fell
Kenneth J. Gruneisen - Passed the CAN SLIM® Master's Exam
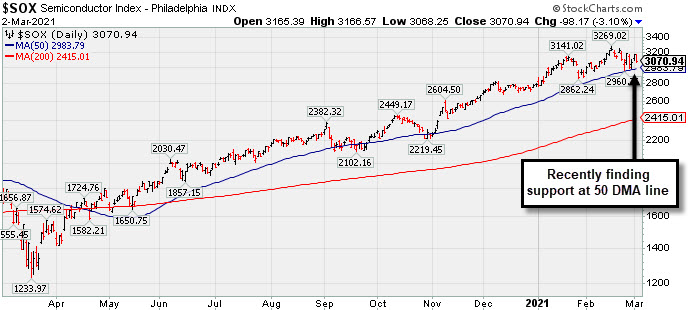
The Retail Index ($RLX -1.51%) created a drag on the major indices along with weakness in the Broker/Dealer Index ($XBD -1.38%) and Bank Index ($BKX -0.66%). The Semiconductor Index ($SOX -3.10%) and Networking Index ($NWX -2.03%) led the tech retreat while the Biotech Index ($BTK -1.61%) posted a smaller loss. Commodity-linked groups were mixed as the Gold & Silver Index ($XAU +3.46%) posted a solid gain while the Oil Services Index ($OSX -3.44%) outpaced the Integrated Oil Index ($XOI -0.81%) to the downside. PICTURED: The Semiconductor Index ($SOX -3.10%) has recently been finding support near its 50-day moving average (DMA) line.
| Oil Services |
$OSX |
56.84 |
-2.03 |
-3.44% |
+28.23% |
| Integrated Oil |
$XOI |
995.46 |
-8.11 |
-0.81% |
+25.61% |
| Semiconductor |
$SOX |
3,070.94 |
-98.17 |
-3.10% |
+9.85% |
| Networking |
$NWX |
781.06 |
-16.18 |
-2.03% |
+8.92% |
| Broker/Dealer |
$XBD |
438.10 |
-6.15 |
-1.38% |
+16.02% |
| Retail |
$RLX |
3,487.15 |
-53.37 |
-1.51% |
-2.14% |
| Gold & Silver |
$XAU |
134.84 |
+4.51 |
+3.46% |
-6.48% |
| Bank |
$BKX |
116.45 |
-0.78 |
-0.66% |
+18.93% |
| Biotech |
$BTK |
5,719.76 |
-93.82 |
-1.61% |
-0.34% |
|
|
|
 |
Found Support Near Prior High and 50-Day Moving Average
Kenneth J. Gruneisen - Passed the CAN SLIM® Master's Exam
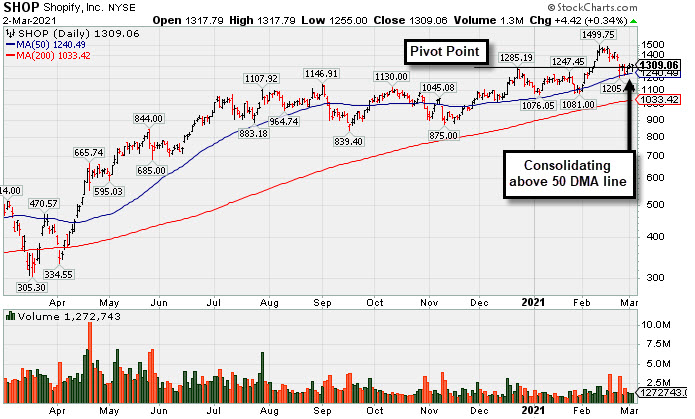
Shopify Inc Cl A (SHOP -$0.88 or -0.07% to $1,309.06) has been finding prompt support after undercutting the prior high ($1,285 on 12/22/20) and retesting important support near its 50-day moving average (DMA) line ($1,240). More damaging losses would raise serious concerns and trigger worrisome technical sell signals.
Recently it reported Dec '20 quarterly earnings +267% on +94% sales revenues versus the year ago period. Prior quarters showed big earnings increases well above the +25% minimum guideline (C criteria) with very strong underlying sales revenues growth. After years of losses it had strong earnings growth in FY '17-19 (A criteria).
The Ontario, Canada-based Computer Software - Enterprise firm was highlighted in yellow with pivot point cited based on its 9/01/20 high plus 10 cents in the 12/15/20 mid-day report (read here). It was last shown in the FSU section on 2/03/21 with an annotated graph under the headline, "Perched Within Striking Distance of New Pivot Point".
The number of top-rated funds owning its shares rose from 1,151 in Sep '19 to 1,712 in Dec '20, a reassuring sign concerning the I criteria. It has a B Timeliness rating and an A Sponsorship Rating. There are 121.9 million shares outstanding (S criteria) which can contribute to greater price volatility in the event of institutional buying or selling. |
|
|
Color Codes Explained :
Y - Better candidates highlighted by our
staff of experts.
G - Previously featured
in past reports as yellow but may no longer be buyable under the
guidelines.
***Last / Change / Volume data in this table is the closing quote data***
Symbol/Exchange
Company Name
Industry Group |
PRICE |
CHANGE
(%Change) |
Day High |
Volume
(% DAV)
(% 50 day avg vol) |
52 Wk Hi
% From Hi |
Featured
Date |
Price
Featured |
Pivot Featured |
|
Max Buy |
 CRL
-
NYSE
CRL
-
NYSE
Charles River Labs Intl
DRUGS - Biotechnology
|
$287.46
|
-2.15
-0.74% |
$291.46
|
215,357
66.06% of 50 DAV
50 DAV is 326,000
|
$303.79
-5.38%
|
12/17/2020
|
$247.06
|
PP = $257.98
|
|
MB = $270.88
|
Most Recent Note - 3/1/2021 5:21:23 PM
G - Posted a gain today with below average volume. Sputtering since it reported Dec '20 quarterly earnings +19% on +14% sales revenues versus the year ago period, below the +25% minimum earnings guideline (C criteria). See the latest FSU analysis for more details and a new annotated graph.
>>> FEATURED STOCK ARTICLE : CRL Still Hovering Near Record High - 3/1/2021 |
View all notes |
Set NEW NOTE alert |
Company Profile |
SEC
News |
Chart |
Request a new note
C
A
S
I |
OPY
-
NYSE
Oppenheimer Holdings Inc
FINANCIAL SERVICES - Investment Brokerage - Regiona
|
$39.44
|
-0.79
-1.96% |
$40.84
|
142,481
115.84% of 50 DAV
50 DAV is 123,000
|
$40.45
-2.50%
|
2/25/2021
|
$38.95
|
PP = $38.11
|
|
MB = $40.02
|
 Most Recent Note - 3/2/2021 12:48:55 PM
G - Hit another new all-time high today following a noted spurt of volume-driven gains since featured in the 2/25/21 mid-day report. Disciplined investors avoid chasing stocks extended more than +5% above their pivot point.
>>> FEATURED STOCK ARTICLE : Rose From "3-weeks Tight" Base But Ended Near Session Low - 2/25/2021 |
View all notes |
Set NEW NOTE alert |
Company Profile |
SEC
News |
Chart |
Request a new note
C
A
S
I |
CLFD
-
NASDAQ
Clearfield Inc
TELECOMMUNICATIONS - Cables / Satalite Equipment
|
$34.19
|
-0.79
-2.26% |
$35.45
|
135,278
85.08% of 50 DAV
50 DAV is 159,000
|
$38.75
-11.77%
|
1/20/2021
|
$31.38
|
PP = $28.42
|
|
MB = $29.84
|
Most Recent Note - 3/1/2021 5:27:08 PM
G - Posted a solid gain today. It is very extended from any sound base. Its 50 DMA line ($30.32) defines important near-term support to watch above its prior highs in the $28 area. Fundamentals remain strong.
>>> FEATURED STOCK ARTICLE : Consolidating Well Above 50-Day Moving Average Line - 2/24/2021 |
View all notes |
Set NEW NOTE alert |
Company Profile |
SEC
News |
Chart |
Request a new note
C
A
S
I |
SMPL
-
NASDAQ
Simply Good Foods Co
Food-Confectionery
|
$28.97
|
-1.76
-5.73% |
$31.05
|
660,235
58.27% of 50 DAV
50 DAV is 1,133,000
|
$32.03
-9.55%
|
12/28/2020
|
$30.40
|
PP = $31.44
|
|
MB = $33.01
|
Most Recent Note - 3/2/2021 5:23:48 PM
Y - Posted a big loss today with below average (but higher) volume, retesting its 50 DMA line ($28.91) which recently acted as support. Its Relative Strength Rating is 75, still below the 80+ minimum guideline. Its prior low ($26.78) defines the next important near term support to watch.
>>> FEATURED STOCK ARTICLE : Pulling Back Quietly After Rebounding Near All-Time High - 2/17/2021 |
View all notes |
Set NEW NOTE alert |
Company Profile |
SEC
News |
Chart |
Request a new note
C
A
S
I |
TEAM
-
NASDAQ
Atlassian Corp Plc
Comp Sftwr-Spec Enterprs
|
$244.40
|
-7.10
-2.82% |
$254.18
|
1,737,642
123.01% of 50 DAV
50 DAV is 1,412,600
|
$262.40
-6.86%
|
10/12/2020
|
$193.77
|
PP = $199.60
|
|
MB = $209.58
|
Most Recent Note - 3/1/2021 5:33:53 PM
G - Rebounded above its 50 DMA line ($238) with today's big gain backed by average volume. The recent low ($208.62 on 1/27/21) defines the next important near-term support to watch. Still, its current Relative Strength Rating is 65, below the +80 minimum guideline for buy candidates. Fundamental concerns remain after earnings rose +0% on +23% sales revenues for the Dec '20 quarter versus the year ago period, its 2nd comparison below the +25% minimum earnings guideline (C criteria).
>>> FEATURED STOCK ARTICLE : Quietly Touched a New High Despite Fundamental Concerns Noted - 2/8/2021 |
View all notes |
Set NEW NOTE alert |
Company Profile |
SEC
News |
Chart |
Request a new note
C
A
S
I |
Symbol/Exchange
Company Name
Industry Group |
PRICE |
CHANGE
(%Change) |
Day High |
Volume
(% DAV)
(% 50 day avg vol) |
52 Wk Hi
% From Hi |
Featured
Date |
Price
Featured |
Pivot Featured |
|
Max Buy |
SHOP
-
NYSE
Shopify Inc Cl A
Computer Sftwr-Enterprse
|
$1,309.06
|
-0.88
-0.07% |
$1,317.79
|
1,272,543
90.00% of 50 DAV
50 DAV is 1,414,000
|
$1,499.75
-12.71%
|
2/2/2021
|
$1,218.72
|
PP = $1,285.28
|
|
MB = $1,349.54
|
Most Recent Note - 3/2/2021 5:21:55 PM
G - Finding support after undercutting the prior high ($1,285 on 12/22/20) and retesting important support near its 50 DMA line ($1,240). More damaging losses would raise serious concerns and trigger worrisome technical sell signals. Reported Dec '20 quarterly earnings +267% on +94% sales revenues versus the year ago period. See the latest FSU analysis for more details and a new annotated graph.
>>> FEATURED STOCK ARTICLE : Found Support Near Prior High and 50-Day Moving Average - 3/2/2021 |
View all notes |
Set NEW NOTE alert |
Company Profile |
SEC
News |
Chart |
Request a new note
C
A
S
I |
YETI
-
NYSE
Yeti Holdings Inc
Leisure-Products
|
$69.76
|
-1.41
-1.98% |
$71.64
|
903,946
61.04% of 50 DAV
50 DAV is 1,481,000
|
$80.89
-13.76%
|
2/19/2021
|
$74.99
|
PP = $80.99
|
|
MB = $85.04
|
Most Recent Note - 3/1/2021 5:35:37 PM
G - Rebounded near its 50 DMA line ($71.53) with today's big gain backed by below average volume. That short-term average may act as resistance. Prior low ($64.80) on 2/01/21) defines important near term support where a violation may trigger a more worrisome technical sell signal. Fundamentals remain strong.
>>> FEATURED STOCK ARTICLE : Rebounded Just Above 50-Day Moving Average Line - 2/18/2021 |
View all notes |
Set NEW NOTE alert |
Company Profile |
SEC
News |
Chart |
Request a new note
C
A
S
I |
DOCU
-
NASDAQ
Docusign Inc
Computer Sftwr-Enterprse
|
$232.59
|
-5.97
-2.50% |
$246.11
|
3,201,963
103.79% of 50 DAV
50 DAV is 3,085,000
|
$290.23
-19.86%
|
1/12/2021
|
$253.50
|
PP = $256.10
|
|
MB = $268.91
|
Most Recent Note - 3/1/2021 5:30:44 PM
G - With today's 2nd consecutive volume-driven gain it rebounded toward its 50 DMA line ($243.51). That important short-term average may act as resistance after damaging losses triggered a technical sell signal. Fundamentals remain strong.
>>> FEATURED STOCK ARTICLE : Consolidating Back Above 50-Day Moving Average Near Prior High - 2/9/2021 |
View all notes |
Set NEW NOTE alert |
Company Profile |
SEC
News |
Chart |
Request a new note
C
A
S
I |
DT
-
NYSE
Dynatrace Inc
Computer Sftwr-Enterprse
|
$52.26
|
-1.09
-2.04% |
$53.78
|
2,981,055
116.04% of 50 DAV
50 DAV is 2,569,000
|
$56.77
-7.94%
|
2/4/2021
|
$51.39
|
PP = $48.95
|
|
MB = $51.40
|
Most Recent Note - 3/1/2021 5:28:24 PM
G - Posted a big gain with near average volume today. Its Relative Strength Rating of 73 remains below the 80+ minimum guideline for buy candidates. Prior highs in the $48 area define initial support to watch above its 50 DMA line ($46.53). Fundamentals remain strong after it reported Dec '20 earnings +70% on +28% sales revenues versus the year ago period.
>>> FEATURED STOCK ARTICLE : Breakout Action Returns Dynatrace to Featured Stocks List - 2/4/2021 |
View all notes |
Set NEW NOTE alert |
Company Profile |
SEC
News |
Chart |
Request a new note
C
A
S
I |
MRBK
-
NASDAQ
Meridian Corp
Banks-Northeast
|
$24.48
|
-0.36
-1.45% |
$25.27
|
28,407
97.96% of 50 DAV
50 DAV is 29,000
|
$26.94
-9.13%
|
2/22/2021
|
$25.58
|
PP = $26.10
|
|
MB = $27.41
|
Most Recent Note - 3/2/2021 5:27:00 PM
Y - Down again today, pulling back following a Special Dividend. Pivot point cited was based on its 12/18/21 high plus 10 cents. Subsequent gains and a strong close above its pivot point backed by at least +40% above average volume may help clinch a convincing technical buy signal. Fundamentals are strong.
>>> FEATURED STOCK ARTICLE : Negative Reversal When Poised to Convincingly Breakout - 2/22/2021 |
View all notes |
Set NEW NOTE alert |
Company Profile |
SEC
News |
Chart |
Request a new note
C
A
S
I |
Symbol/Exchange
Company Name
Industry Group |
PRICE |
CHANGE
(%Change) |
Day High |
Volume
(% DAV)
(% 50 day avg vol) |
52 Wk Hi
% From Hi |
Featured
Date |
Price
Featured |
Pivot Featured |
|
Max Buy |
AXON
-
NASDAQ
Axon Enterprise Inc
Security/Sfty
|
$166.15
|
-3.50
-2.06% |
$172.71
|
814,078
114.18% of 50 DAV
50 DAV is 713,000
|
$212.37
-21.76%
|
12/22/2020
|
$127.84
|
PP = $130.51
|
|
MB = $137.04
|
Most Recent Note - 3/2/2021 5:25:46 PM
G - Still consolidating well above its 50 DMA line ($155), extended from any sound base. Reported strong Dec '20 quarterly results.
>>> FEATURED STOCK ARTICLE : Slumping Toward 50-Day Average Following Great Rally - 2/26/2021 |
View all notes |
Set NEW NOTE alert |
Company Profile |
SEC
News |
Chart |
Request a new note
C
A
S
I |
|
|
|
THESE ARE NOT BUY RECOMMENDATIONS!
Comments contained in the body of this report are technical
opinions only. The material herein has been obtained
from sources believed to be reliable and accurate, however,
its accuracy and completeness cannot be guaranteed.
This site is not an investment advisor, hence it does
not endorse or recommend any securities or other investments.
Any recommendation contained in this report may not
be suitable for all investors and it is not to be deemed
an offer or solicitation on our part with respect to
the purchase or sale of any securities. All trademarks,
service marks and trade names appearing in this report
are the property of their respective owners, and are
likewise used for identification purposes only.
This report is a service available
only to active Paid Premium Members.
You may opt-out of receiving report notifications
at any time. Questions or comments may be submitted
by writing to Premium Membership Services 665 S.E. 10 Street, Suite 201 Deerfield Beach, FL 33441-5634 or by calling 1-800-965-8307
or 954-785-1121.
|
|
|