You are not logged in.
This means you
CAN ONLY VIEW reports that were published prior to Friday, March 28, 2025.
You
MUST UPGRADE YOUR MEMBERSHIP if you want to see any current reports.
AFTER MARKET UPDATE - TUESDAY, APRIL 25TH, 2017
Previous After Market Report Next After Market Report >>>
|
|
|
|
DOW |
+232.23 |
20,996.12 |
+1.12% |
|
Volume |
1,094,378,230 |
+0% |
|
Volume |
1,721,072,600 |
+3% |
|
NASDAQ |
+41.67 |
6,025.49 |
+0.70% |
|
Advancers |
1,996 |
68% |
|
Advancers |
1,961 |
69% |
|
S&P 500 |
+14.46 |
2,388.61 |
+0.61% |
|
Decliners |
944 |
32% |
|
Decliners |
895 |
31% |
|
Russell 2000 |
+13.13 |
1,411.08 |
+0.94% |
|
52 Wk Highs |
301 |
|
|
52 Wk Highs |
313 |
|
|
S&P 600 |
+7.31 |
857.21 |
+0.86% |
|
52 Wk Lows |
17 |
|
|
52 Wk Lows |
44 |
|
|
 |
Nasdaq Composite Tops 6,000 as Major Indices Rally
Kenneth J. Gruneisen - Passed the CAN SLIM® Master's Exam
Stocks finished firmly higher on Tuesday. The Dow jumped 232 points to 20996. The S&P 500 added 14 points to 2388 and the Nasdaq Composite gained 41 points to 6025. The volume totals reported were higher than the prior session totals on the NYSE and on the Nasdaq exchange. Advancers led decliners by a 2-1 margin on the NYSE and on the Nasdaq exchange. There were 111 high-ranked companies from the Leaders List that made new 52-week highs and were listed on the BreakOuts Page, versus the total of 103 on the prior session. New 52-week highs totals expanded and solidly outnumbered new 52-week lows on the NYSE and on the Nasdaq exchange. PICTURED: The Nasdaq Composite Index gapped up on Tuesday for a second consecutive big gain with even higher volume, rallying for new record highs.
The major averages' (M criteria) are in a confirmed uptrend, and there has been a reassuring expansion in leadership (number of high-ranked stocks hitting new highs). New buying efforts should be made only in stocks matching all of the fundamental and technical criteria of the fact-based investment system. The Featured Stocks Page lists noteworthy high-ranked leaders.
The Nasdaq Composite climbed above 6,000 for the time as investors digested optimistic earnings reports and better-than-expected housing data. On Tuesday, the index reached the milestone mark as solid quarterly reports came from several large-cap companies. Caterpillar (CAT +7.86%) rallied as the firm widely beat quarterly profit and revenue estimates. On the data front, new home sales rose 5.8% in March, firmly above analyst expectations.
Nine of 11 sectors in the S&P 500 ended in positive territory. Materials paced the gains with Alcoa (AA +9.55%) posting a big gain and rising above its 50 DMA line. DuPont (DD +3.6%) challenged its 52-week high after the chemical maker posted better-than-expected quarterly revenue. In the consumer space, McDonald’s (MCD +5.57) rose as U.S. same-store sales unexpectedly increased 1.7% in the quarter. Coca-Cola (KO -0.39%) fell after quarterly profit fell short of Street forecasts. In Health Care, Express Scripts (ESRX -10.77%) gapped down after announcing its contract with health insurer Anthem (ANTM +2.40%) is unlikely to be renewed after it expires in 2018. Eli Lilly (LLY -2.66%) fell despite reporting stronger demand for its newer products.
Treasuries declined with the benchmark 10-year note down 17/32 to yield 2.33%. In commodities, NYMEX WTI crude added 1.1% to $49.78/barrel. In FOREX, the Dollar Index fell 0.3%. |
 Kenneth J. Gruneisen started out as a licensed stockbroker in August 1987, a couple of months prior to the historic stock market crash that took the Dow Jones Industrial Average down -22.6% in a single day. He has published daily fact-based fundamental and technical analysis on high-ranked stocks online for two decades. Through FACTBASEDINVESTING.COM, Kenneth provides educational articles, news, market commentary, and other information regarding proven investment systems that work in good times and bad.
Comments contained in the body of this report are technical opinions only and are not necessarily those of Gruneisen Growth Corp. The material herein has been obtained from sources believed to be reliable and accurate, however, its accuracy and completeness cannot be guaranteed. Our firm, employees, and customers may effect transactions, including transactions contrary to any recommendation herein, or have positions in the securities mentioned herein or options with respect thereto. Any recommendation contained in this report may not be suitable for all investors and it is not to be deemed an offer or solicitation on our part with respect to the purchase or sale of any securities. |
|
 |
Financial, Retail, Tech, and Energy-Linked Groups Rose
Kenneth J. Gruneisen - Passed the CAN SLIM® Master's Exam
The Bank Index ($BKX +0.72%), Broker/Dealer Index ($XBD +0.57%), and the Retail Index ($RLX +0.44%) posted gains on Tuesday. The Biotechnology Index ($BTK +1.75%) led the tech sector and the Semiconductor Index ($SOX +0.99%) and Networking Index ($NWX +0.66%) each posted a modest gain. The Integrated Oil Index ($XOI +0.80%) and the Oil Services Index ($OSX +0.95%) both rose. Charts courtesy www.stockcharts.com
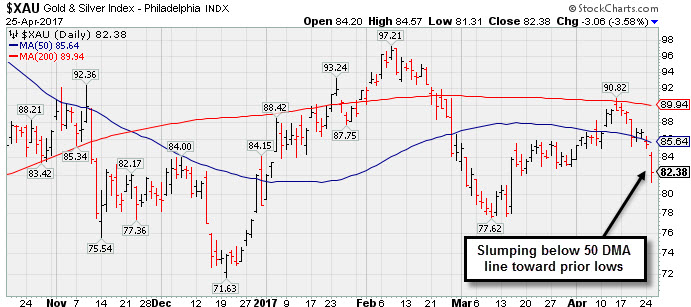 PICTURED: The Gold & Silver Index ($XAU -3.58%) was a standout decliner, slumping below its 50-day moving average (DMA) line toward prior lows.
| Oil Services |
$OSX |
158.77 |
+1.50 |
+0.95% |
-13.61% |
| Integrated Oil |
$XOI |
1,171.58 |
+9.26 |
+0.80% |
-7.60% |
| Semiconductor |
$SOX |
1,017.81 |
+10.01 |
+0.99% |
+12.28% |
| Networking |
$NWX |
456.05 |
+3.00 |
+0.66% |
+2.23% |
| Broker/Dealer |
$XBD |
215.26 |
+1.22 |
+0.57% |
+4.86% |
| Retail |
$RLX |
1,484.36 |
+6.48 |
+0.44% |
+10.53% |
| Gold & Silver |
$XAU |
82.38 |
-3.06 |
-3.58% |
+4.46% |
| Bank |
$BKX |
92.57 |
+0.66 |
+0.72% |
+0.85% |
| Biotech |
$BTK |
3,603.39 |
+61.95 |
+1.75% |
+17.18% |
|
|
|
 |
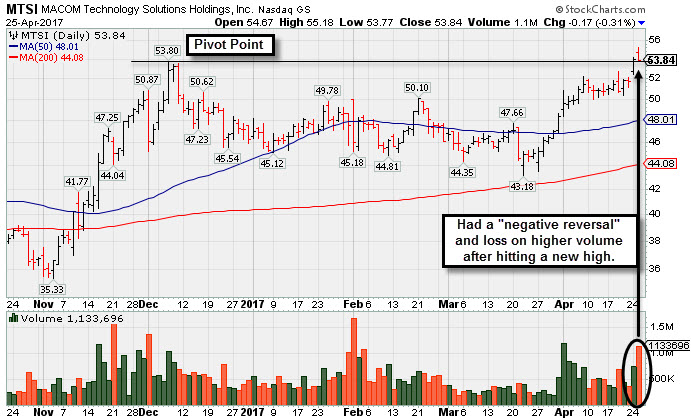
Strong Earnings Report While Perched at All-Time High
Kenneth J. Gruneisen - Passed the CAN SLIM® Master's Exam
Macom Tech Solution Hldg (MTSI -$0.17 or -0.31% to $53.84) had a "negative reversal" and finished the session with a small loss on higher volume. It was highlighted in yellow with pivot point cited based on its 12/07/16 high plus 10 cents in the earlier mid-day report (read here). It hit a new 52-week high today and no resistance remains, but the action was indicative of distributional pressure. Subsequent volume-driven gains above the pivot point may trigger a proper technical buy signal.
Volume and volatility often increase near earnings news. It reported Mar '17 quarterly earnings +38% on +39% sales revenues after the close today, continuing its streak of earnings increases above the +25% minimum guideline (C criteria). Earnings rose +47% on +31% sales revenues for the Dec '16 quarter, . Recent years showed strong annual earnings (A criteria) increases after a slight downturn in FY '13 and '14.
It completed a new Public Offering on 2/05/15. The number of top-rated funds owning its shares rose from 351 in Jun '16 to 382 in Mar '17. The current Up/Down Volume Ratio is 2.0, a reassuring sign its shares have been under institutional accumulation over the past 50 days (I criteria). Its Timeliness Rating is A and Sponsorship Rating is C. Its small supply of only 26.6 million shares in the public float (S criteria) can contribute to greater price volatility in the event of institutional buying or selling.
|
|
|
Color Codes Explained :
Y - Better candidates highlighted by our
staff of experts.
G - Previously featured
in past reports as yellow but may no longer be buyable under the
guidelines.
***Last / Change / Volume data in this table is the closing quote data***
Symbol/Exchange
Company Name
Industry Group |
PRICE |
CHANGE
(%Change) |
Day High |
Volume
(% DAV)
(% 50 day avg vol) |
52 Wk Hi
% From Hi |
Featured
Date |
Price
Featured |
Pivot Featured |
|
Max Buy |
SBCF
-
NASDAQ
Seacoast Banking Corp Fl
BANKING - Regional - Mid-Atlantic Banks
|
$25.23
|
-0.10
-0.39% |
$25.88
|
342,134
74.38% of 50 DAV
50 DAV is 460,000
|
$25.48
-0.98%
|
4/24/2017
|
$25.33
|
PP = $24.38
|
|
MB = $25.60
|
Most Recent Note - 4/24/2017 6:31:14 PM
Y - Color code is changed to yellow with new pivot point cited based on its 3/31/17 high after a cup with handle base. Gapped up today and hit a new all-time high with today's 6th consecutive gain. Gains above the pivot point should be backed by a minimum of +40% above average volume to trigger a proper new (or add-on) technical buy signal. The 50 DMA line ($23.72) and recent low ($21.89 on 3/22/17) define support where violations would raise more serious concerns and trigger worrisome technical sell signals.
>>> FEATURED STOCK ARTICLE : Rebound After Slump Below 50-Day Average Into Prior Base - 3/28/2017 |
View all notes |
Set NEW NOTE alert |
Company Profile |
SEC
News |
Chart |
Request a new note
C
A
S
I |
CSFL
-
NASDAQ
Centerstate Banks Inc
Banks-Southeast
|
$26.09
|
-0.18
-0.69% |
$26.68
|
237,544
80.80% of 50 DAV
50 DAV is 294,000
|
$26.94
-3.15%
|
3/13/2017
|
$25.54
|
PP = $26.40
|
|
MB = $27.72
|
Most Recent Note - 4/24/2017 6:22:52 PM
Y - Rebounded further above its 50 DMA line toward prior highs. Damaging losses below its recent low ($23.64 on 4/17/17) would raise more serious concerns.
>>> FEATURED STOCK ARTICLE : Positive Reversal After Intra-day Low Undercut Prior Lows - 4/17/2017 |
View all notes |
Set NEW NOTE alert |
Company Profile |
SEC
News |
Chart |
Request a new note
C
A
S
I |
NSP
-
NYSE
Insperity Inc
Comml Svcs-Outsourcing
|
$90.80
|
+1.05
1.17% |
$91.80
|
107,389
69.28% of 50 DAV
50 DAV is 155,000
|
$90.80
0.00%
|
4/21/2017
|
$88.65
|
PP = $90.65
|
|
MB = $95.18
|
 Most Recent Note - 4/25/2017 7:37:17 PM
Y - Hit a new high with today's gain on light volume. Color code was changed to yellow with new pivot point cited based on its 3/15/17 high plus 10 cents. Gains above the pivot point backed by at least +40% above average volume are needed to trigger a proper new (or add-on) technical buy signal. Found support while consolidating in an orderly fashion above its 50 DMA line. See the latest FSU analysis for more details and an annotated graph.
>>> FEATURED STOCK ARTICLE : New Base Formed Above 50-Day Moving Average Line - 4/21/2017 |
View all notes |
Set NEW NOTE alert |
Company Profile |
SEC
News |
Chart |
Request a new note
C
A
S
I |
HTHT
-
NASDAQ
China Lodging Group Ads
LEISURE - Lodging
|
$67.36
|
+0.53
0.79% |
$67.97
|
110,948
65.65% of 50 DAV
50 DAV is 169,000
|
$68.34
-1.43%
|
9/29/2016
|
$46.12
|
PP = $47.82
|
|
MB = $50.21
|
Most Recent Note - 4/20/2017 12:21:42 PM
G - Hitting a new all-time high with today's 4th consecutive gain on ever-increasing volume. Found prompt support after violating its 50 DMA line on 4/11/17. Recent low ($57.89 on 4/11/17) defines near-term support to watch on pullbacks. Repeatedly noted with caution - "The 2 latest quarterly comparisons (Sep and Dec '16) were below the +25% minimum earnings guideline (C criteria), and its waning sales revenues growth rate was also noted recently as a fundamental concern. See the latest FSU analysis for more details and an annotated graph.
>>> FEATURED STOCK ARTICLE : Support Shown Promptly After 50-Day Moving Average Violation - 4/19/2017 |
View all notes |
Set NEW NOTE alert |
Company Profile |
SEC
News |
Chart |
Request a new note
C
A
S
I |
SIRI
-
NASDAQ
Sirius X M Holdings Inc
MEDIA - Broadcasting - Radio
|
$5.21
|
+0.08
1.46% |
$5.21
|
27,228,023
104.05% of 50 DAV
50 DAV is 26,167,000
|
$5.53
-5.88%
|
3/13/2017
|
$5.48
|
PP = $5.32
|
|
MB = $5.59
|
Most Recent Note - 4/24/2017 6:33:46 PM
G - Finished at the session high with above average volume behind today's 5th consecutive gain, closing above its 50 DMA line ($5.11), helping its outlook to improve. More damaging losses below the recent low ($4.95 on 4/19/17) would raise greater concerns and trigger a more worrisome technical sell signal.
>>> FEATURED STOCK ARTICLE : Consolidating Above Near-Term Support Level - 4/13/2017 |
View all notes |
Set NEW NOTE alert |
Company Profile |
SEC
News |
Chart |
Request a new note
C
A
S
I |
Symbol/Exchange
Company Name
Industry Group |
PRICE |
CHANGE
(%Change) |
Day High |
Volume
(% DAV)
(% 50 day avg vol) |
52 Wk Hi
% From Hi |
Featured
Date |
Price
Featured |
Pivot Featured |
|
Max Buy |
BEAT
-
NASDAQ
BioTelemetry Inc
Medical-Services
|
$32.55
|
+0.40
1.24% |
$32.85
|
696,374
157.20% of 50 DAV
50 DAV is 443,000
|
$32.48
0.23%
|
2/14/2017
|
$25.10
|
PP = $24.55
|
|
MB = $25.78
|
Most Recent Note - 4/24/2017 6:21:30 PM
G - Gapped up and rallied with average volume for a new all-time high on M&A news. Disciplined investors avoid chasing extended stocks. During recent consolidations it found support well above its 50 DMA line and above prior highs in the $24 area.
>>> FEATURED STOCK ARTICLE : Perched Near High, Extended From Prior Base - 4/3/2017 |
View all notes |
Set NEW NOTE alert |
Company Profile |
SEC
News |
Chart |
Request a new note
C
A
S
I |
ULTA
-
NASDAQ
Ulta Salon Cosm & Frag
SPECIALTY RETAIL - Specialty Retail, Other
|
$277.99
|
-0.22
-0.08% |
$281.19
|
511,757
77.96% of 50 DAV
50 DAV is 656,400
|
$289.27
-3.90%
|
3/6/2017
|
$274.96
|
PP = $278.73
|
|
MB = $292.67
|
Most Recent Note - 4/25/2017 11:27:40 AM
G - Color code is changed to green as its Relative Strength rank has slumped to 69, below the 80+ guideline for buy candidates. Testing prior highs in the $278 area defining important support along with its 50 DMA line ($280.12). More damaging losses would raise concerns and trigger technical sell signals.
>>> FEATURED STOCK ARTICLE : Volume Totals Cooling Following Technical Breakout - 4/7/2017 |
View all notes |
Set NEW NOTE alert |
Company Profile |
SEC
News |
Chart |
Request a new note
C
A
S
I |
ESNT
-
NYSE
Essent Group Ltd
Finance-MrtgandRel Svc
|
$37.98
|
+0.32
0.85% |
$38.44
|
421,265
59.08% of 50 DAV
50 DAV is 713,000
|
$39.50
-3.85%
|
4/4/2017
|
$36.38
|
PP = $36.81
|
|
MB = $38.65
|
Most Recent Note - 4/21/2017 12:23:09 PM
Y - Color code is changed to yellow today after gapping down and trading below its "max buy" level. Its 50 DMA line ($36) and recent lows define important near-term support.
>>> FEATURED STOCK ARTICLE : Quiet Volume Behind Gain for New High Close - 4/10/2017 |
View all notes |
Set NEW NOTE alert |
Company Profile |
SEC
News |
Chart |
Request a new note
C
A
S
I |
MTSI
-
NASDAQ
Macom Tech Solution Hldg
Elec-Semiconductor Mfg
|
$53.84
|
-0.17
-0.31% |
$55.18
|
1,131,696
261.97% of 50 DAV
50 DAV is 432,000
|
$54.17
-0.61%
|
4/25/2017
|
$54.57
|
PP = $53.90
|
|
MB = $56.60
|
Most Recent Note - 4/25/2017 7:11:46 PM
Y - Had a "negative reversal" today after highlighted in yellow in the earlier report with a pivot point cited based on its 12/07/16 high plus 10 cents. No resistance remains. Reported +38% earnings on +39% sales revenues for the Mar '17 quarter after the close today. Volume and volatility often increase near earnings news. See the latest FSU analysis for more details and a new annotated graph.
>>> FEATURED STOCK ARTICLE : Strong Earnings Report While Perched at All-Time High - 4/25/2017 |
View all notes |
Set NEW NOTE alert |
Company Profile |
SEC
News |
Chart |
Request a new note
C
A
S
I |
VEEV
-
NYSE
Veeva Systems Inc Cl A
Computer Sftwr-Medical
|
$52.20
|
-0.35
-0.67% |
$52.96
|
765,132
58.77% of 50 DAV
50 DAV is 1,302,000
|
$53.37
-2.19%
|
3/16/2017
|
$49.00
|
PP = $48.05
|
|
MB = $50.45
|
Most Recent Note - 4/20/2017 5:07:58 PM
G - Hit a new all-time high and finished near the session high with today's solid gain backed by above average volume. Prior highs in the $47-48 area define support coinciding with its 50 DMA line.
>>> FEATURED STOCK ARTICLE : Hovering Near High, Stubbornly Holding its Ground - 4/18/2017 |
View all notes |
Set NEW NOTE alert |
Company Profile |
SEC
News |
Chart |
Request a new note
C
A
S
I |
Symbol/Exchange
Company Name
Industry Group |
PRICE |
CHANGE
(%Change) |
Day High |
Volume
(% DAV)
(% 50 day avg vol) |
52 Wk Hi
% From Hi |
Featured
Date |
Price
Featured |
Pivot Featured |
|
Max Buy |
ANET
-
NYSE
Arista Networks Inc
TELECOMMUNICATIONS - Communication Equipment
|
$139.42
|
+0.42
0.30% |
$140.32
|
595,243
67.72% of 50 DAV
50 DAV is 879,000
|
$139.39
0.02%
|
4/17/2017
|
$132.75
|
PP = $135.27
|
|
MB = $142.03
|
Most Recent Note - 4/21/2017 6:06:40 PM
Y - Perched at its all-time high following 5 consecutive small gains with light volume. Wedged higher with gains lacking great volume conviction since forming an advanced "3-weeks tight" base. Gains with at least +40% above average volume while rising above the new pivot point cited would trigger a new (or add-on) technical buy signal.
>>> FEATURED STOCK ARTICLE : Extended From Any Sound Base After a Considerable Rally - 4/5/2017 |
View all notes |
Set NEW NOTE alert |
Company Profile |
SEC
News |
Chart |
Request a new note
C
A
S
I |
IBP
-
NYSE
Installed Building Prod
DIVERSIFIED SERVICES - Business/Management Services
|
$53.45
|
-0.10
-0.19% |
$54.20
|
99,331
64.50% of 50 DAV
50 DAV is 154,000
|
$54.60
-2.11%
|
4/17/2017
|
$51.75
|
PP = $53.10
|
|
MB = $55.76
|
Most Recent Note - 4/21/2017 6:08:30 PM
Y - Perched at its all-time high. Wedged higher with gains lacking great volume conviction after an advanced "3-weeks tight" base was noted. Subsequent volume-driven gains above the new pivot point cited may trigger a new (or add-on) technical buy signal. Its 50 DMA line ($48.77) defines important near-term support to watch.
>>> FEATURED STOCK ARTICLE : Hovering Near All-Time High Following Volume-Driven Gains - 4/4/2017 |
View all notes |
Set NEW NOTE alert |
Company Profile |
SEC
News |
Chart |
Request a new note
C
A
S
I |
NCOM
-
NASDAQ
National Commerce Corp
BANKING - Regional - Southeast Banks
|
$39.40
|
+1.50
3.96% |
$40.00
|
150,923
539.01% of 50 DAV
50 DAV is 28,000
|
$39.99
-1.48%
|
4/25/2017
|
$38.95
|
PP = $40.09
|
|
MB = $42.09
|
Most Recent Note - 4/25/2017 7:13:02 PM
Y - Finished strong after highlighted in yellow in the mid-day report with new pivot point cited based on its 1/27/17 high plus 10 cents. A volume-driven gain for a new 52-week high is needed to trigger a technical buy signal. Up from its $20 IPO on 3/19/15. Reported Mar '17 earnings +32% on +42% sales revenues extending its streak to 9 consecutive quarterly comparisons with earnings increasing above the +25% minimum guideline (C criteria).
There are no Featured Stock Updates™ available for this stock at this time. You may request one by clicking the Request a New Note link below |
View all notes |
Set NEW NOTE alert |
Company Profile |
SEC
News |
Chart |
Request a new note
C
A
S
I |
INGN
-
NASDAQ
Inogen Inc
HEALTH SERVICES - Medical Instruments and Supplies
|
$81.18
|
+0.26
0.32% |
$82.38
|
137,940
78.82% of 50 DAV
50 DAV is 175,000
|
$82.07
-1.08%
|
4/17/2017
|
$76.77
|
PP = $80.04
|
|
MB = $84.04
|
Most Recent Note - 4/25/2017 11:33:25 AM
Y - Hitting a new all-time high with today's 4th consecutive gain on higher volume. Gains above the pivot point backed by at least +40% above average volume are needed to trigger a proper new (or add-on) technical buy signal. Its 50 DMA line ($74.13) defines near-term support to watch.
>>> FEATURED STOCK ARTICLE : Best Ever Close For High-Ranked Medical Product Maker - 3/31/2017 |
View all notes |
Set NEW NOTE alert |
Company Profile |
SEC
News |
Chart |
Request a new note
C
A
S
I |
PLAY
-
NASDAQ
Dave & Buster's Ent Inc
Retail-Restaurants
|
$63.34
|
-0.21
-0.33% |
$64.48
|
518,005
64.51% of 50 DAV
50 DAV is 803,000
|
$63.89
-0.86%
|
2/23/2017
|
$55.41
|
PP = $58.35
|
|
MB = $61.27
|
Most Recent Note - 4/20/2017 5:02:49 PM
G - Matched its all-time high and ended at a best-ever close with average volume behind today's 5th consecutive gain. Its 50 DMA line ($58.90) defines near-term support to watch on pullbacks. Latest quarter was below the +25% minimum guideline (C criteria), raising fundametal concerns.
>>> FEATURED STOCK ARTICLE : Retreated From All-Time High Following Earnings Report - 3/29/2017 |
View all notes |
Set NEW NOTE alert |
Company Profile |
SEC
News |
Chart |
Request a new note
C
A
S
I |
Symbol/Exchange
Company Name
Industry Group |
PRICE |
CHANGE
(%Change) |
Day High |
Volume
(% DAV)
(% 50 day avg vol) |
52 Wk Hi
% From Hi |
Featured
Date |
Price
Featured |
Pivot Featured |
|
Max Buy |
OLLI
-
NASDAQ
Ollie's Bargain Outlet
Retail-DiscountandVariety
|
$37.65
|
+0.15
0.40% |
$37.95
|
496,873
85.67% of 50 DAV
50 DAV is 580,000
|
$37.70
-0.13%
|
3/27/2017
|
$32.80
|
PP = $33.55
|
|
MB = $35.23
|
Most Recent Note - 4/24/2017 6:43:06 PM
G - Rallied further above its "max buy" level for a new all-time high with today's 6th consecutive gain. Bullish action has continued since reporting earnings +22% on +16% sales revenues for the Jan '17 quarter, below the +25% minimum earnings guideline (C criteria). See the latest FSU analysis for more details and a new annotated graph.
>>> FEATURED STOCK ARTICLE : Winning Streak Continues for Discount Retailer - 4/24/2017 |
View all notes |
Set NEW NOTE alert |
Company Profile |
SEC
News |
Chart |
Request a new note
C
A
S
I |
MOMO
-
NASDAQ
Momo Inc Ads Cl A
INTERNET - Content
|
$38.16
|
-0.29
-0.75% |
$38.70
|
3,766,011
73.35% of 50 DAV
50 DAV is 5,134,000
|
$39.25
-2.78%
|
3/7/2017
|
$29.71
|
PP = $27.83
|
|
MB = $29.22
|
Most Recent Note - 4/24/2017 6:24:10 PM
G - Still hovering near its all-time high, extended from the previously noted base. Its 50 DMA line ($31) and prior highs in the $28 area define important support to watch on pullbacks.
>>> FEATURED STOCK ARTICLE : Extended From Prior Base and Perched Near High - 4/6/2017 |
View all notes |
Set NEW NOTE alert |
Company Profile |
SEC
News |
Chart |
Request a new note
C
A
S
I |
|
|
|
THESE ARE NOT BUY RECOMMENDATIONS!
Comments contained in the body of this report are technical
opinions only. The material herein has been obtained
from sources believed to be reliable and accurate, however,
its accuracy and completeness cannot be guaranteed.
This site is not an investment advisor, hence it does
not endorse or recommend any securities or other investments.
Any recommendation contained in this report may not
be suitable for all investors and it is not to be deemed
an offer or solicitation on our part with respect to
the purchase or sale of any securities. All trademarks,
service marks and trade names appearing in this report
are the property of their respective owners, and are
likewise used for identification purposes only.
This report is a service available
only to active Paid Premium Members.
You may opt-out of receiving report notifications
at any time. Questions or comments may be submitted
by writing to Premium Membership Services 665 S.E. 10 Street, Suite 201 Deerfield Beach, FL 33441-5634 or by calling 1-800-965-8307
or 954-785-1121.
|
|
|