You are not logged in.
This means you
CAN ONLY VIEW reports that were published prior to Tuesday, April 8, 2025.
You
MUST UPGRADE YOUR MEMBERSHIP if you want to see any current reports.
AFTER MARKET UPDATE - THURSDAY, FEBRUARY 18TH, 2021
Previous After Market Report Next After Market Report >>>
|
|
|
|
DOW |
-119.68 |
31,493.34 |
-0.38% |
|
Volume |
941,358,262 |
-3% |
|
Volume |
6,407,668,600 |
-11% |
|
NASDAQ |
-103.31 |
13,862.19 |
-0.74% |
|
Advancers |
1,049 |
33% |
|
Advancers |
1,110 |
28% |
|
S&P 500 |
-17.36 |
3,913.97 |
-0.44% |
|
Decliners |
2,161 |
67% |
|
Decliners |
2,794 |
72% |
|
Russell 2000 |
-37.72 |
2,218.39 |
-1.67% |
|
52 Wk Highs |
101 |
|
|
52 Wk Highs |
146 |
|
|
S&P 600 |
-19.70 |
1,267.12 |
-1.53% |
|
52 Wk Lows |
11 |
|
|
52 Wk Lows |
18 |
|
|
 |
Breadth Negative and Leadership Waned as Major Indices Fell
Kenneth J. Gruneisen - Passed the CAN SLIM® Master's Exam
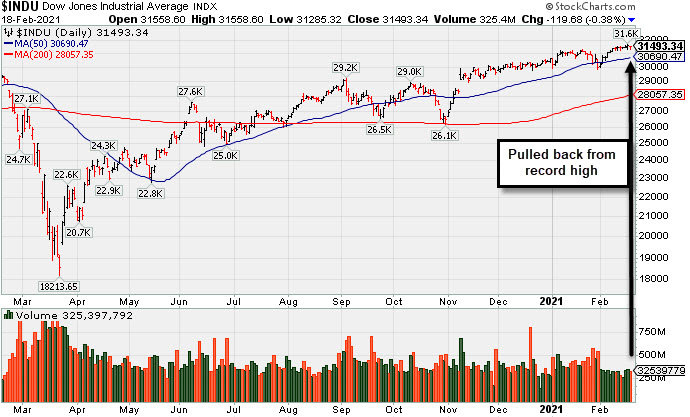
The Dow pared a more than 250 point drop to end 119 points lower, drifting from its record closing high notched yesterday. The S&P 500 lost 0.4%, while the Nasdaq Composite fell 0.7%, with each benchmark capping their first three-day losing streak since December and October, respectively. The volume totals were lighter than the prior session on the NYSE and on the Nasdaq exchange. Decliners led advancers by more than a 2-1 margin on the NYSE and nearly 3-1 on the Nasdaq exchange. Leadership thinned as there were 23 high-ranked companies from the Leaders List that hit new 52-week highs and were listed on the BreakOuts Page, versus the total of 45 on the prior session. New 52-week highs totals contracted yet still easily outnumbered new 52-week lows totals on both exchanges. The major indices are in a confirmed uptrend (M criteria) with healthy leadership provided by many stocks hitting new highs. Investors are reminded to always make buying and selling decisions based based on the strict criteria and rules of the fact-based investment system. PICTURED: The Dow Jones Industrial Average quietly pulled back from its record high.
U.S. stocks ended lower on Thursday as investors assessed the latest batch of economic data releases and corporate earnings results. On the data front, weekly initial jobless claims jumped by 861,000, well above the anticipated 773,000 increase, while the prior week's reading was also upwardly revised. Separate releases revealed housing starts slumped 6% in January, while building permits unexpectedly increased during the same period, surging 10.4%. Treasuries pared some of their early morning weakness, with the yield on the 10-year note rising one basis point to 1.29%. In commodities, COMEX gold closed just above the flat line at $1,771.80/ounce, snapping a six-session losing streak, though still near its lowest level in seven months.
Nine of 11 S&P 500 sectors finished in negative territory, with Utilities and Consumer Discretionary the only advancers. Energy led laggards as WTI crude slid 1.8% to $60.07/barrel despite a larger-than-forecasted drawdown in weekly U.S. crude inventories. In corporate news, Walmart (WMT -6.48%) fell after the big-box retailer missed analyst profit expectations, cautioning that sales should moderate this year as the pandemic-inspired tailwind tapers off. Albemarle (ALB -10.17%) sank as the lithium producer beat top and bottom line estimates but provided mixed forward guidance. Elsewhere, software-maker Twilio (TWLO +7.73%) after posting a surprise profit in the fourth quarter. |
 Kenneth J. Gruneisen started out as a licensed stockbroker in August 1987, a couple of months prior to the historic stock market crash that took the Dow Jones Industrial Average down -22.6% in a single day. He has published daily fact-based fundamental and technical analysis on high-ranked stocks online for two decades. Through FACTBASEDINVESTING.COM, Kenneth provides educational articles, news, market commentary, and other information regarding proven investment systems that work in good times and bad.
Comments contained in the body of this report are technical opinions only and are not necessarily those of Gruneisen Growth Corp. The material herein has been obtained from sources believed to be reliable and accurate, however, its accuracy and completeness cannot be guaranteed. Our firm, employees, and customers may effect transactions, including transactions contrary to any recommendation herein, or have positions in the securities mentioned herein or options with respect thereto. Any recommendation contained in this report may not be suitable for all investors and it is not to be deemed an offer or solicitation on our part with respect to the purchase or sale of any securities. |
|
 |
Financial, Tech, and Commodity-Linked Groups Fell
Kenneth J. Gruneisen - Passed the CAN SLIM® Master's Exam
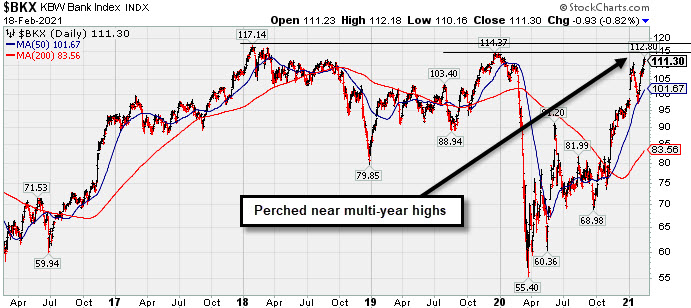
The Broker/Dealer Index ($XBD -1.02%) and Bank Index ($BKX -0.82%) both created a drag on the major indices while the Retail Index ($RLX +0.57%) helped offset widespread weakness. The tech sector saw unanimous losses from the Biotech Index ($BTK -1.55%), Semiconductor Index ($SOX -1.02%), and Networking Index ($NWX -0.91%). Commodity-linked groups had a negative bias as the Oil Services Index ($OSX -4.19%) and Integrated Oil Index ($XOI -2.34%) both outpaced the Gold & Silver Index ($XAU -1.25%) to the downside.
PICTURED: The Bank Index ($BKX -0.82%) pulled back today. It is perched within striking distance of its Dec 2019 high. Subsequent gains above it, and above its 2018 high for a new record, would be a reassuring sign for the broader market. It found prompt support at the 50-day moving average (DMA) line during the recent consolidation.
| Oil Services |
$OSX |
50.98 |
-2.23 |
-4.19% |
+15.01% |
| Integrated Oil |
$XOI |
929.55 |
-22.25 |
-2.34% |
+17.30% |
| Semiconductor |
$SOX |
3,145.78 |
-32.46 |
-1.02% |
+12.53% |
| Networking |
$NWX |
813.62 |
-7.48 |
-0.91% |
+13.46% |
| Broker/Dealer |
$XBD |
432.55 |
-4.48 |
-1.02% |
+14.55% |
| Retail |
$RLX |
3,712.66 |
+21.22 |
+0.57% |
+4.19% |
| Gold & Silver |
$XAU |
135.72 |
-1.71 |
-1.25% |
-5.88% |
| Bank |
$BKX |
111.30 |
-0.93 |
-0.82% |
+13.68% |
| Biotech |
$BTK |
6,034.23 |
-94.90 |
-1.55% |
+5.14% |
|
|
|
 |
Rebounded Just Above 50-Day Moving Average Line
Kenneth J. Gruneisen - Passed the CAN SLIM® Master's Exam
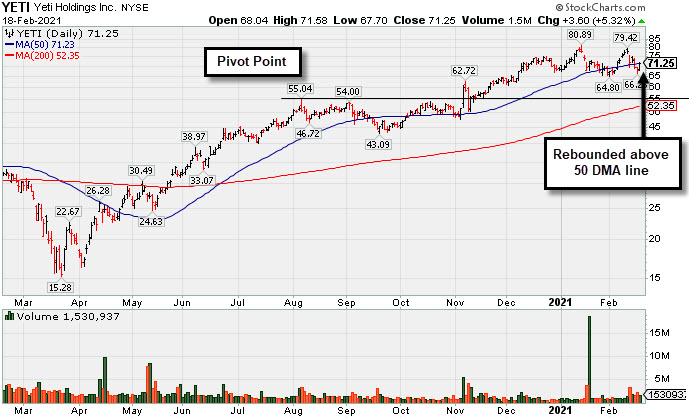
Yeti Holdings Inc (YETI +$3.60 or +5.32% to $71.25) rebounded to close back above the 50-day moving average (DMA) line ($71.23), finding prompt support after damaging volume-driven losses. It has not formed a sound base of sufficient length. The prior low ($64.80) on 2/01/21) defines important near term support where a violation may trigger a more worrisome technical sell signal.
Recently it reported Dec '20 quarterly earnings +72% on +26% sales revenues versus the year ago period, its 6th consecutive quarterly earnings increase above the +25% minimum earnings guideline (C criteria) of the fact-based investment system. Its limited annual earnings (A criteria) history was previously noted as a concern. Also, it hails from the Leisure-Products group which currently has a C+ (49) Group Relative Strength rating (L criteria).
There is a small supply of only 87.1 million shares outstanding (S criteria). The number of top-rated funds owning its shares rose from 310 in Dec '19 to 555 in Dec '20, a reassuring sign concerning the I criteria. Its current Up/Down Volume Ratio of 1.9 is an unbiased indication its shares have been under accumulation over the past 50 days. It completed Secondary Offerings on 5/12/20, 2/20/20, 11/08/19 and 5/08/19 after its $18 IPO on 10/25/18.
|
|
|
Color Codes Explained :
Y - Better candidates highlighted by our
staff of experts.
G - Previously featured
in past reports as yellow but may no longer be buyable under the
guidelines.
***Last / Change / Volume data in this table is the closing quote data***
Symbol/Exchange
Company Name
Industry Group |
PRICE |
CHANGE
(%Change) |
Day High |
Volume
(% DAV)
(% 50 day avg vol) |
52 Wk Hi
% From Hi |
Featured
Date |
Price
Featured |
Pivot Featured |
|
Max Buy |
 CRL
-
NYSE
CRL
-
NYSE
Charles River Labs Intl
DRUGS - Biotechnology
|
$292.51
|
-6.97
-2.33% |
$297.67
|
511,665
164.00% of 50 DAV
50 DAV is 312,000
|
$303.79
-3.71%
|
12/17/2020
|
$247.06
|
PP = $257.98
|
|
MB = $270.88
|
Most Recent Note - 2/17/2021 12:16:19 PM
G - Reported Dec '20 quarterly earnings +19% on +14% sales revenues versus the year ago period, below the +25% minimum earnings guideline (C criteria). Hitting a new record high today. Volume and volatility often increase near earnings news.
>>> FEATURED STOCK ARTICLE : Testing Important Support on Pullback - 1/29/2021 |
View all notes |
Set NEW NOTE alert |
Company Profile |
SEC
News |
Chart |
Request a new note
C
A
S
I |
AMD
-
NYSE
Advanced Micro Devices
ELECTRONICS - Semiconductor - Broad Line
|
$88.64
|
-1.30
-1.45% |
$89.60
|
35,377,092
82.91% of 50 DAV
50 DAV is 42,668,700
|
$99.23
-10.67%
|
11/18/2020
|
$82.54
|
PP = $88.72
|
|
MB = $93.16
|
Most Recent Note - 2/17/2021 5:28:11 PM
G - Quietly slumped back below its 50 DMA line ($91.92) with 2 consecutive quiet losses. Its current Relative Strength rating of 60 is well below the 80+ minimum guideline for buy candidates, however, it remains only -9.4% off its high. Fundamentals remain strong after it reported Dec '20 quarterly earnings +63% on +53% sales revenues versus the year ago period.
>>> FEATURED STOCK ARTICLE : Close Above 50-Day Moving Average But Relative Strength a Concern - 2/10/2021 |
View all notes |
Set NEW NOTE alert |
Company Profile |
SEC
News |
Chart |
Request a new note
C
A
S
I |
AMRC
-
NYSE
Ameresco Inc Cl A
ENERGY - Alternative
|
$62.71
|
-1.91
-2.96% |
$63.56
|
426,322
93.29% of 50 DAV
50 DAV is 457,000
|
$70.26
-10.75%
|
12/15/2020
|
$46.72
|
PP = $47.10
|
|
MB = $49.46
|
Most Recent Note - 2/17/2021 12:07:11 PM
G - Retreating from its all-time high, it is extended from any sound base. Its 50-day moving average (DMA) line ($55.60) defines near-term support to watch..
>>> FEATURED STOCK ARTICLE : Rebounding After Retreat From Record High - 2/1/2021 |
View all notes |
Set NEW NOTE alert |
Company Profile |
SEC
News |
Chart |
Request a new note
C
A
S
I |
TREX
-
NYSE
Trex Company Inc
MATERIALS and CONSTRUCTION - General Building Materials
|
$102.35
|
-2.21
-2.11% |
$104.98
|
654,425
94.71% of 50 DAV
50 DAV is 691,000
|
$107.64
-4.91%
|
6/26/2020
|
$54.53
|
PP = $66.47
|
|
MB = $69.79
|
Most Recent Note - 2/16/2021 5:39:48 PM
G - Recently wedged to new all-time highs with gains backed by below average volume. Its 50 DMA line ($89.56) and prior low define important support to watch on pullbacks. Due to report Dec '20 quarterly results on 2/22/21. Sep '20 quarterly earnings were +14% on +19% sales revenues versus the year ago period, below the +25% minimum guideline (C criteria) raising fundamental concerns. See the latest FSU analysis for more details and a new annotated graph.
>>> FEATURED STOCK ARTICLE : Wedged to New Highs With Earnings Report Due Soon - 2/16/2021 |
View all notes |
Set NEW NOTE alert |
Company Profile |
SEC
News |
Chart |
Request a new note
C
A
S
I |
CLFD
-
NASDAQ
Clearfield Inc
TELECOMMUNICATIONS - Cables / Satalite Equipment
|
$34.50
|
-1.83
-5.04% |
$36.23
|
141,484
91.87% of 50 DAV
50 DAV is 154,000
|
$38.75
-10.97%
|
1/20/2021
|
$31.38
|
PP = $28.42
|
|
MB = $29.84
|
 Most Recent Note - 2/18/2021 5:07:23 PM
G - Retreated from its all-time high with lighter volume behind today's 2nd big loss following 3 consecutive gains with above average volume. Very extended from any sound base. Its 50 DMA line ($29.14) and prior highs in the $28 area define important near-term support to watch. Reported Dec '20 quarterly earnings +475% on +40% sales revenues versus the year ago period, continuing its strong earning track record.
>>> FEATURED STOCK ARTICLE : Perched Near Record High With Earnings Report Due Soon - 1/27/2021 |
View all notes |
Set NEW NOTE alert |
Company Profile |
SEC
News |
Chart |
Request a new note
C
A
S
I |
Symbol/Exchange
Company Name
Industry Group |
PRICE |
CHANGE
(%Change) |
Day High |
Volume
(% DAV)
(% 50 day avg vol) |
52 Wk Hi
% From Hi |
Featured
Date |
Price
Featured |
Pivot Featured |
|
Max Buy |
NOW
-
NYSE
Servicenow Inc
Computer Sftwr-Enterprse
|
$575.80
|
-5.14
-0.88% |
$579.31
|
949,122
70.29% of 50 DAV
50 DAV is 1,350,300
|
$598.37
-3.77%
|
8/20/2020
|
$453.34
|
PP = $454.79
|
|
MB = $477.53
|
Most Recent Note - 2/17/2021 5:34:27 PM
G - Holding its ground stubbornly, it closed today only -2.9% off its all-time high, and volume totals have been cooling. Relative Strength rating has slumped to 67, well below the 80+ minimum guideline for buy candidates. A new pivot point was not cited due to fundamental concerns noted as its impressive rally has continued. Gapped up on 1/28/21 promptly rebounding above its 50 DMA line ($547). Fundamental concerns remain after it reported Dec '20 quarterly earnings +22% on +31% sales revenues versus the year ago period, its 2nd consecutive comparison below the +25% minimum guideline (C criteria) of the fact-based investment system.
>>> FEATURED STOCK ARTICLE : Hit New Highs With Latest Gains Backed by Light Volume - 2/5/2021 |
View all notes |
Set NEW NOTE alert |
Company Profile |
SEC
News |
Chart |
Request a new note
C
A
S
I |
SMPL
-
NASDAQ
Simply Good Foods Co
Food-Confectionery
|
$28.55
|
-0.16
-0.56% |
$28.94
|
560,431
49.82% of 50 DAV
50 DAV is 1,124,900
|
$32.03
-10.86%
|
12/28/2020
|
$30.40
|
PP = $31.44
|
|
MB = $33.01
|
Most Recent Note - 2/17/2021 5:25:41 PM
G - Pulled back for a 3rd consecutive loss today with light volume after it was perched within striking distance of its 52-week high. Its Relative Strength Rating is 60, still below the 80+ minimum guideline. Its 50 DMA line ($28.14) and prior low ($26.78) define near term support to watch. See the latest FSU analysis for more details and a new annotated graph.
>>> FEATURED STOCK ARTICLE : Pulling Back Quietly After Rebounding Near All-Time High - 2/17/2021 |
View all notes |
Set NEW NOTE alert |
Company Profile |
SEC
News |
Chart |
Request a new note
C
A
S
I |
ALRM
-
NASDAQ
Alarm.com Holdings Inc
Security/Sfty
|
$97.69
|
+0.28
0.29% |
$98.27
|
228,432
50.20% of 50 DAV
50 DAV is 455,000
|
$108.67
-10.10%
|
2/9/2021
|
$71.88
|
PP = $108.67
|
|
MB = $114.10
|
Most Recent Note - 2/16/2021 6:00:25 PM
Y - There was a "negative reversal" today. Due to report Dec '20 quarterly results on 2/25/21. Color code was recently changed to yellow as it was noted that a valid secondary buy point exists up to 5% above the prior high since it found support at its 10 week moving average (WMA) line.
>>> FEATURED STOCK ARTICLE : Perched Near Prior High After Finding Support at 10 WMA - 2/11/2021 |
View all notes |
Set NEW NOTE alert |
Company Profile |
SEC
News |
Chart |
Request a new note
C
A
S
I |
TEAM
-
NASDAQ
Atlassian Corp Plc Cl A
Comp Sftwr-Spec Enterprs
|
$256.73
|
+6.20
2.47% |
$258.77
|
1,309,174
94.73% of 50 DAV
50 DAV is 1,382,000
|
$257.01
-0.11%
|
10/12/2020
|
$193.77
|
PP = $199.60
|
|
MB = $209.58
|
Most Recent Note - 2/16/2021 5:54:47 PM
G - Quietly hovering at its all-time high. Rebounded impressively from a brief dip below its 50 DMA line ($235.70). Recent low ($208.62 on 1/27/21) defines important near-term support to watch. Its current Relative Strength Rating is 70, below the +80 minimum guideline for buy candidates. Fundamental concerns remain after earnings rose +0% on +23% sales revenues for the Dec '20 quarter versus the year ago period, its 2nd comparison below the +25% minimum earnings guideline (C criteria).
>>> FEATURED STOCK ARTICLE : Quietly Touched a New High Despite Fundamental Concerns Noted - 2/8/2021 |
View all notes |
Set NEW NOTE alert |
Company Profile |
SEC
News |
Chart |
Request a new note
C
A
S
I |
SHOP
-
NYSE
Shopify Inc Cl A
Computer Sftwr-Enterprse
|
$1,384.57
|
-40.43
-2.84% |
$1,415.00
|
1,242,494
94.56% of 50 DAV
50 DAV is 1,314,000
|
$1,499.75
-7.68%
|
2/2/2021
|
$1,218.72
|
PP = $1,285.28
|
|
MB = $1,349.54
|
Most Recent Note - 2/18/2021 5:14:34 PM
G - Pulled back toward its "max buy" level wit today's loss on lighter volume. Prior high ($1,285 on 12/22/20) defines important support to watch above its 50 DMA line ($1,202). Reported Dec '20 quarterly earnings +267% on +94% sales revenues versus the year ago period.
>>> FEATURED STOCK ARTICLE : Perched Within Striking Distance of New Pivot Point - 2/3/2021 |
View all notes |
Set NEW NOTE alert |
Company Profile |
SEC
News |
Chart |
Request a new note
C
A
S
I |
Symbol/Exchange
Company Name
Industry Group |
PRICE |
CHANGE
(%Change) |
Day High |
Volume
(% DAV)
(% 50 day avg vol) |
52 Wk Hi
% From Hi |
Featured
Date |
Price
Featured |
Pivot Featured |
|
Max Buy |
YETI
-
NYSE
Yeti Holdings Inc
Leisure-Products
|
$71.25
|
+3.60
5.32% |
$71.58
|
1,523,883
105.17% of 50 DAV
50 DAV is 1,449,000
|
$80.89
-11.92%
|
11/5/2020
|
$57.25
|
PP = $55.14
|
|
MB = $57.90
|
Most Recent Note - 2/18/2021 5:05:03 PM
G - Rebounded to close just above its 50 DMA line ($71.23) today after damaging volume-driven losses. Reported Dec '20 quarterly earnings +72% on +26% sales revenues versus the year ago period. It has not formed a sound base of sufficient length. Prior low ($64.80) on 2/01/21) defines important near term support where a violation may trigger a more worrisome technical sell signal. See the latest FSU analysis for more details and a new annotated graph.
>>> FEATURED STOCK ARTICLE : Rebounded Just Above 50-Day Moving Average Line - 2/18/2021 |
View all notes |
Set NEW NOTE alert |
Company Profile |
SEC
News |
Chart |
Request a new note
C
A
S
I |
BJ
-
NYSE
BJs Wholesale Club Hldgs
Retail-DiscountandVariety
|
$44.77
|
+0.96
2.19% |
$45.00
|
1,572,026
69.56% of 50 DAV
50 DAV is 2,260,100
|
$50.18
-10.78%
|
1/28/2021
|
$44.74
|
PP = $47.56
|
|
MB = $49.94
|
Most Recent Note - 2/17/2021 5:30:07 PM
G - Volume totals have been cooling while stubbornly holding its ground. Color code is changed to green as its Relative Strength rating has slumped to 63, well below the 80+ minimum for buy candidates. The prior low and 50 DMA line define important near term support in the $40 area.
>>> FEATURED STOCK ARTICLE : Pulled Back After Breakout Capped 7-Day Winning Streak - 1/28/2021 |
View all notes |
Set NEW NOTE alert |
Company Profile |
SEC
News |
Chart |
Request a new note
C
A
S
I |
DOCU
-
NASDAQ
Docusign Inc
Computer Sftwr-Enterprse
|
$260.99
|
+6.01
2.36% |
$263.45
|
2,033,958
61.17% of 50 DAV
50 DAV is 3,325,000
|
$290.23
-10.07%
|
1/12/2021
|
$253.50
|
PP = $256.10
|
|
MB = $268.91
|
Most Recent Note - 2/16/2021 5:46:59 PM
Y - Up again today wedging higher with gains lacking great volume since its rebound above the 50 DMA line ($241) helped its outlook improve. Faces little resistance due to overhead supply. Fundamentals remain strong.
>>> FEATURED STOCK ARTICLE : Consolidating Back Above 50-Day Moving Average Near Prior High - 2/9/2021 |
View all notes |
Set NEW NOTE alert |
Company Profile |
SEC
News |
Chart |
Request a new note
C
A
S
I |
DT
-
NYSE
Dynatrace Inc
Computer Sftwr-Enterprse
|
$52.99
|
+0.49
0.93% |
$53.45
|
2,366,467
97.43% of 50 DAV
50 DAV is 2,429,000
|
$56.77
-6.66%
|
2/4/2021
|
$51.39
|
PP = $48.95
|
|
MB = $51.40
|
Most Recent Note - 2/17/2021 5:31:58 PM
G - Pulled back with below average volume today for a 6th consecutive loss, retreating from its all-time high following a streak of 6 consecutive gains. Prior highs in the $48 area define initial support to watch above its 50 DMA line ($44.58). Fundamentals remain strong after it reported Dec '20 earnings +70% on +28% sales revenues versus the year ago period.
>>> FEATURED STOCK ARTICLE : Breakout Action Returns Dynatrace to Featured Stocks List - 2/4/2021 |
View all notes |
Set NEW NOTE alert |
Company Profile |
SEC
News |
Chart |
Request a new note
C
A
S
I |
QTWO
-
NYSE
Q2 Holdings Inc
Computer Sftwr-Financial
|
$137.23
|
-7.33
-5.07% |
$144.10
|
868,570
181.33% of 50 DAV
50 DAV is 479,000
|
$148.56
-7.63%
|
11/12/2020
|
$105.14
|
PP = $106.54
|
|
MB = $111.87
|
Most Recent Note - 2/18/2021 5:13:11 PM
G - Suffered a big volume-driven losses today after reporting Dec '20 quarterly earnings -95% on +26% sales revenues versus the year ago period, below the +25% minimum earnings guideline (C criteria), raising fundamental concerns. Volume and volatility often increase near earnings news. Extended from any sound base, its 50 DMA line ($130) defines important near term support to watch above the prior low ($126.52 on 2/01/21).
>>> FEATURED STOCK ARTICLE : Perched Near All-Time High Stubbornly Holding Ground - 1/26/2021 |
View all notes |
Set NEW NOTE alert |
Company Profile |
SEC
News |
Chart |
Request a new note
C
A
S
I |
Symbol/Exchange
Company Name
Industry Group |
PRICE |
CHANGE
(%Change) |
Day High |
Volume
(% DAV)
(% 50 day avg vol) |
52 Wk Hi
% From Hi |
Featured
Date |
Price
Featured |
Pivot Featured |
|
Max Buy |
AXON
-
NASDAQ
Axon Enterprise Inc
Security/Sfty
|
$173.75
|
-4.63
-2.60% |
$178.38
|
477,412
69.19% of 50 DAV
50 DAV is 690,000
|
$212.37
-18.19%
|
12/22/2020
|
$127.84
|
PP = $130.51
|
|
MB = $137.04
|
Most Recent Note - 2/16/2021 5:58:19 PM
G - Suffered a big volume-driven loss today, yet it is still well above support at its 50 DMA line ($146). Fundamentals remain strong. Formerly traded under the ticker symbol AAXN where prior notes and detailed analysis may be reviewed.
>>> FEATURED STOCK ARTICLE : Extended From Prior Base Following Streak fo Volume-Driven Gains - 2/2/2021 |
View all notes |
Set NEW NOTE alert |
Company Profile |
SEC
News |
Chart |
Request a new note
C
A
S
I |
|
|
|
THESE ARE NOT BUY RECOMMENDATIONS!
Comments contained in the body of this report are technical
opinions only. The material herein has been obtained
from sources believed to be reliable and accurate, however,
its accuracy and completeness cannot be guaranteed.
This site is not an investment advisor, hence it does
not endorse or recommend any securities or other investments.
Any recommendation contained in this report may not
be suitable for all investors and it is not to be deemed
an offer or solicitation on our part with respect to
the purchase or sale of any securities. All trademarks,
service marks and trade names appearing in this report
are the property of their respective owners, and are
likewise used for identification purposes only.
This report is a service available
only to active Paid Premium Members.
You may opt-out of receiving report notifications
at any time. Questions or comments may be submitted
by writing to Premium Membership Services 665 S.E. 10 Street, Suite 201 Deerfield Beach, FL 33441-5634 or by calling 1-800-965-8307
or 954-785-1121.
|
|
|